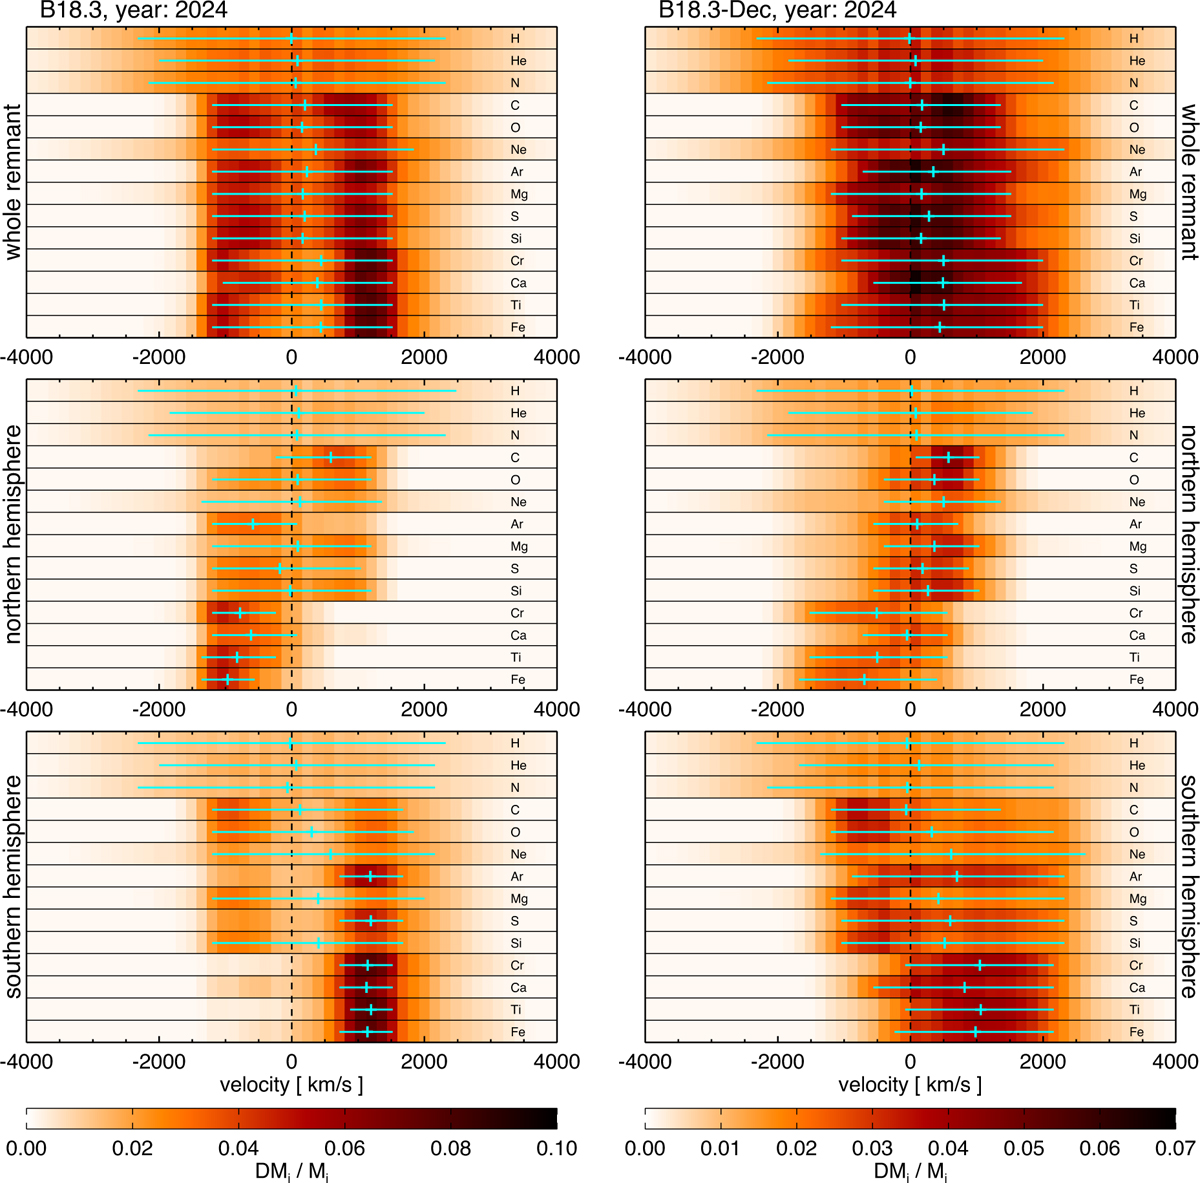
Fig. 2
Download original image
Mass distributions of ejecta species as a function of LoS velocity, derived from models B18.3 (left panels) and B18.3-Dec (right panels) at a remnant age of 37 years (2024). The color bars at the bottom of the figure correspond to their respective columns and are specific to the model represented in each column. The upper panels show the velocity distributions across the entire remnant, while the middle and lower panels correspond to the northern and southern hemispheres, respectively. Crosses mark the mass-weighted average LoS velocity for each species, while the horizontal lines indicate the velocity range where the ejecta mass fraction exceeds 50% of the peak mass fraction.
Current usage metrics show cumulative count of Article Views (full-text article views including HTML views, PDF and ePub downloads, according to the available data) and Abstracts Views on Vision4Press platform.
Data correspond to usage on the plateform after 2015. The current usage metrics is available 48-96 hours after online publication and is updated daily on week days.
Initial download of the metrics may take a while.