Fig. 13
Download original image
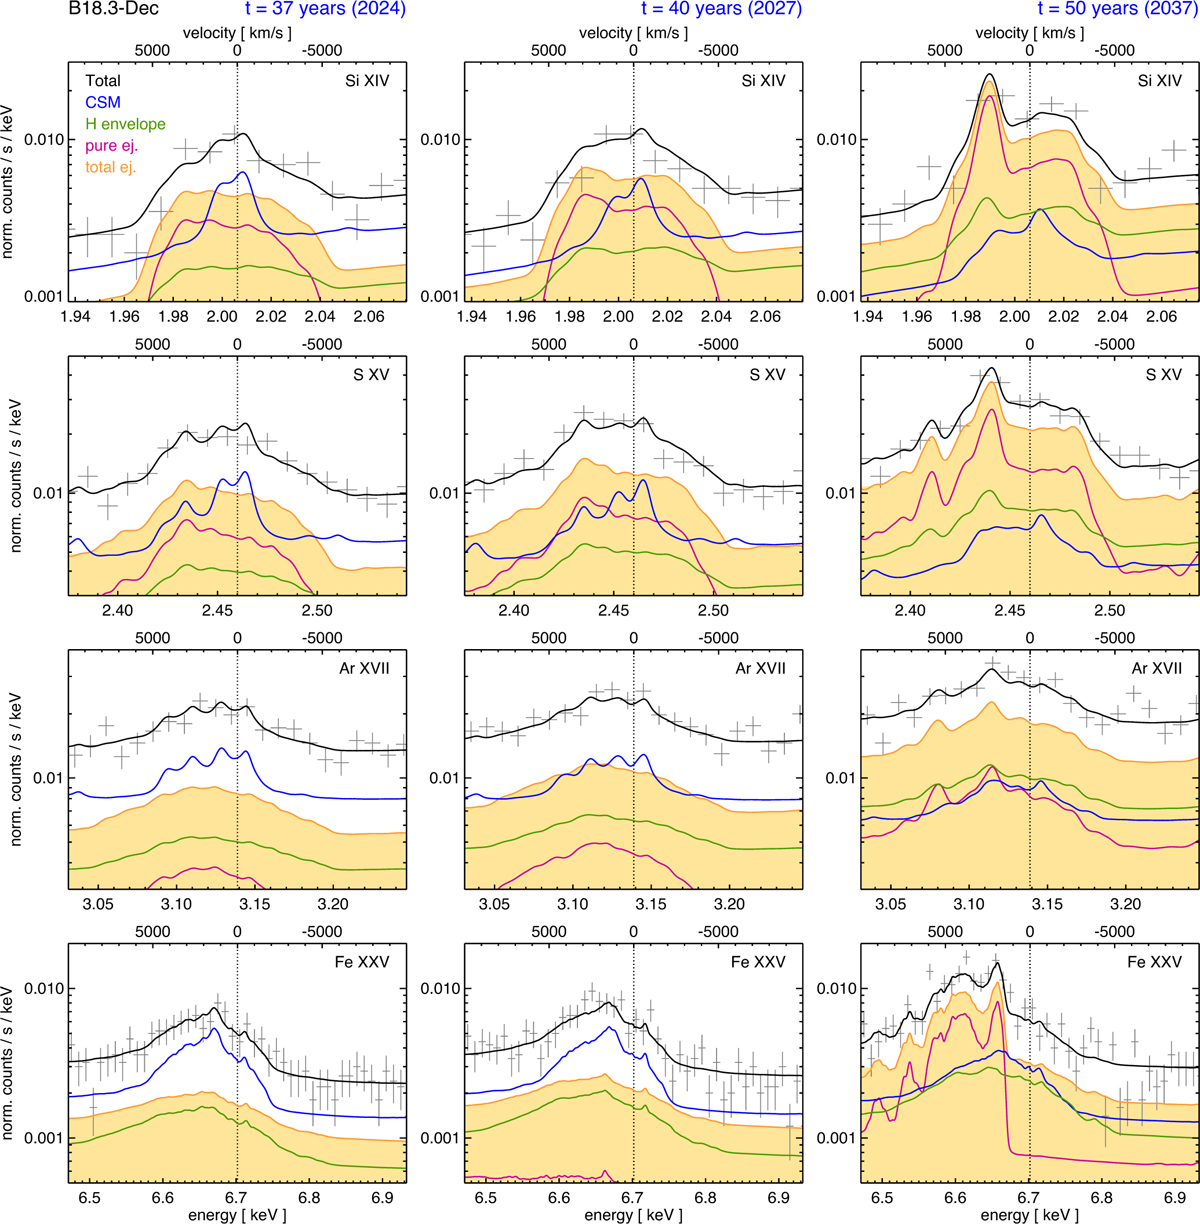
XRISM Resolve spectra synthesized from model B18.3-Dec at three epochs: 2024 (left panels), 2027 (center panels), and 2037 (right panels). The figure presents close-up views of selected emission lines: Si XIV (2.1 keV), S XV (2.46 keV), Ar XVII (3.14 keV), Fe XXV (6.7 keV). Each panel shows the synthetic spectra of SN 1987A as observed with XRISM Resolve (shown as gray crosses), assuming an exposure time of 500 ks. Also included are the ideal synthetic spectra (black lines) and the contributions from different plasma components: shocked CSM (blue), shocked H envelope (green), and shocked pure ejecta (violet). The total contribution from shocked ejecta (H envelope + pure ejecta) is highlighted by the shaded yellow region. The top axis of each panel indicates the corresponding Doppler shift velocities relative to the rest-frame wavelength of each line.
Current usage metrics show cumulative count of Article Views (full-text article views including HTML views, PDF and ePub downloads, according to the available data) and Abstracts Views on Vision4Press platform.
Data correspond to usage on the plateform after 2015. The current usage metrics is available 48-96 hours after online publication and is updated daily on week days.
Initial download of the metrics may take a while.