Fig. 12
Download original image
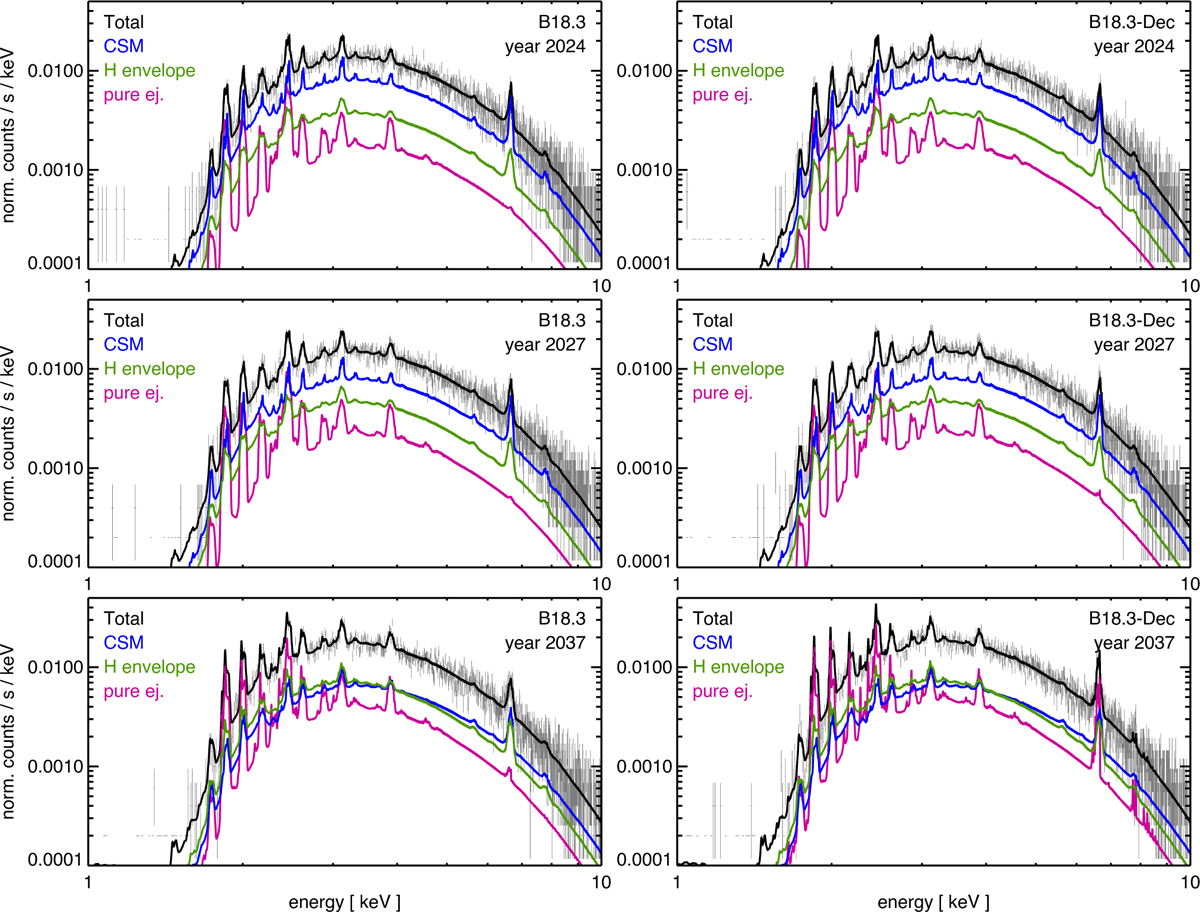
Full XRISM Resolve spectra in the [1.0, 10.0] keV energy range synthesized from models B18.3 (on the left) and B18.3-Dec (on the right) at the labeled times. The spectra (shown as gray crosses) were computed assuming an exposure time of 500 ks. For reference, the figure also shows the ideal synthetic spectra (black lines) along with the contributions from individual plasma components: shocked CSM (blue), shocked H envelope (green), and shocked pure ejecta (violet). No significant signal is detected below 1.8 keV due to the XRISM gate valve remaining closed, which prevents soft X-ray photons from reaching the detector.
Current usage metrics show cumulative count of Article Views (full-text article views including HTML views, PDF and ePub downloads, according to the available data) and Abstracts Views on Vision4Press platform.
Data correspond to usage on the plateform after 2015. The current usage metrics is available 48-96 hours after online publication and is updated daily on week days.
Initial download of the metrics may take a while.