Fig. 8
Download original image
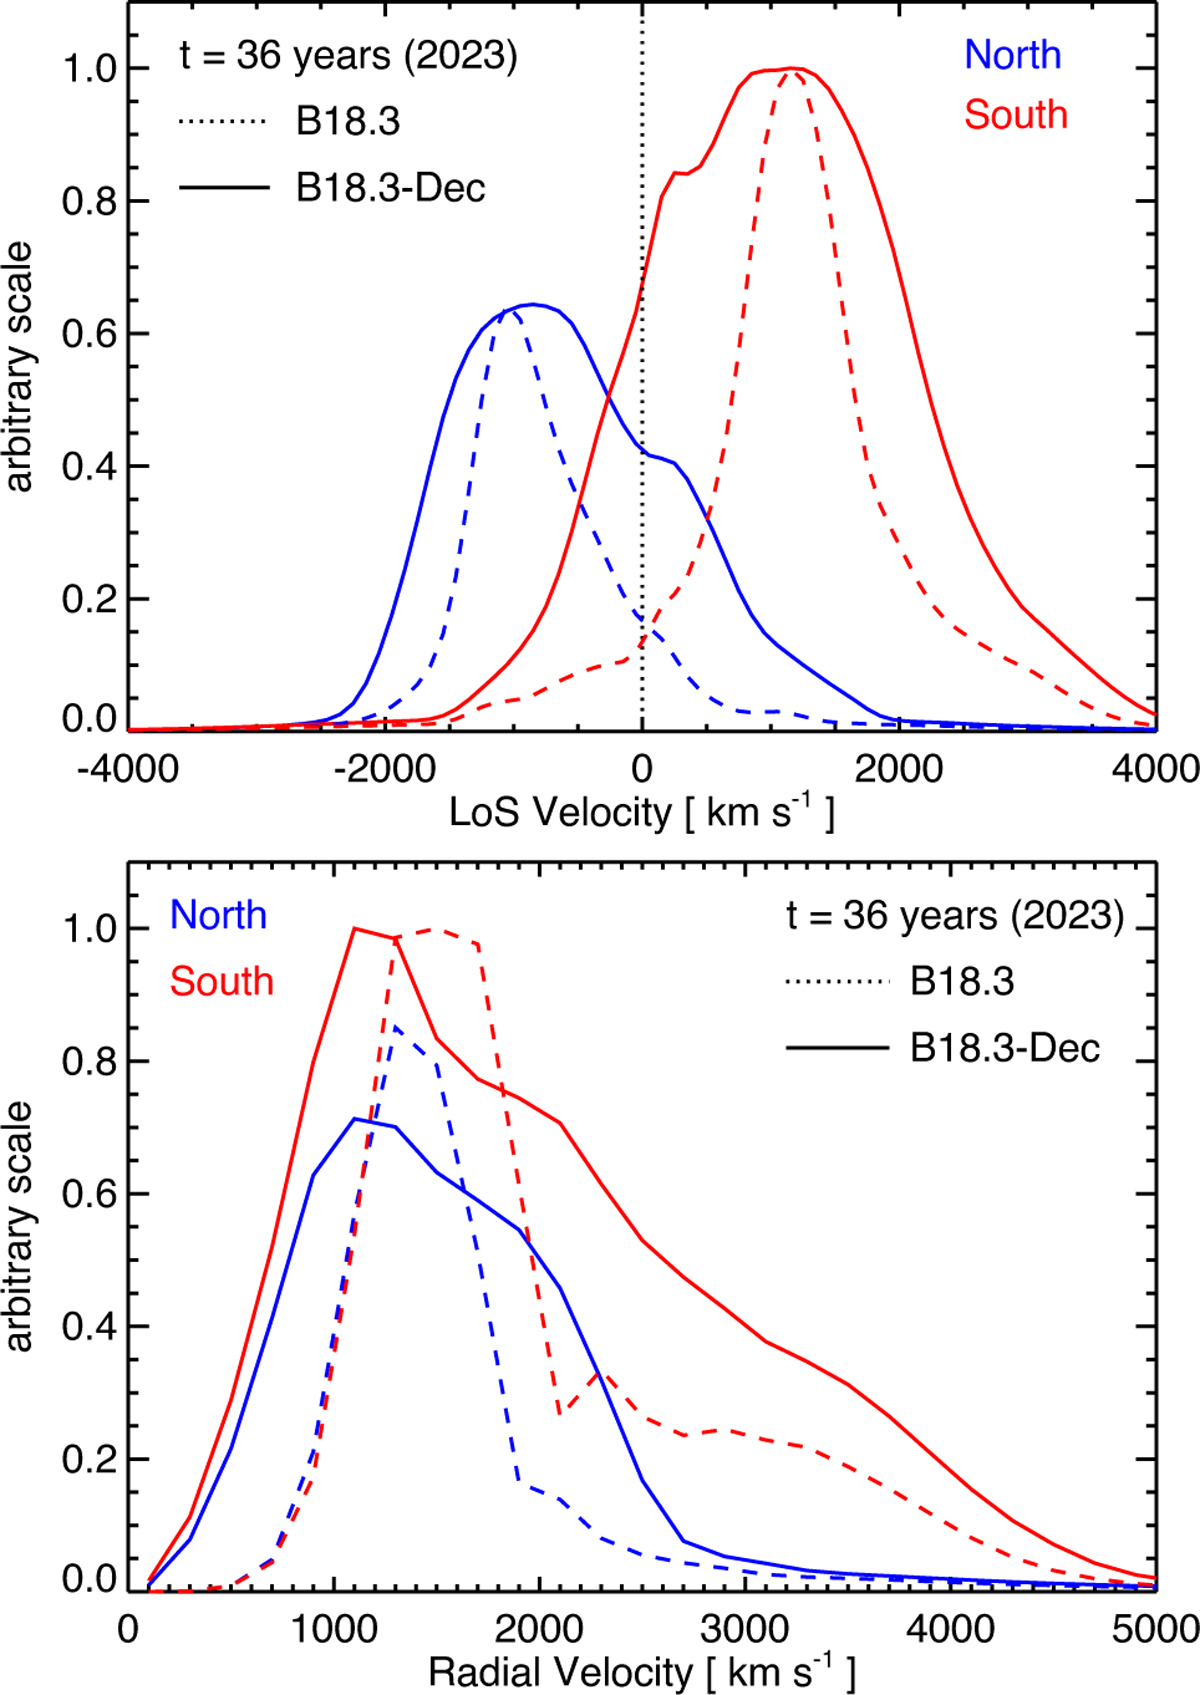
Mass distributions of Fe-rich ejecta as a function of the velocity component along the LoS (upper panel) and the radial velocity (lower panel) at t ≈ 36 years after core collapse (corresponding to February 2023) for models B18.3 (dashed lines) and B18.3-Dec (solid lines). Red and blue curves represent the results for the southern and northern hemispheres, respectively.
Current usage metrics show cumulative count of Article Views (full-text article views including HTML views, PDF and ePub downloads, according to the available data) and Abstracts Views on Vision4Press platform.
Data correspond to usage on the plateform after 2015. The current usage metrics is available 48-96 hours after online publication and is updated daily on week days.
Initial download of the metrics may take a while.