Fig. 1
Download original image
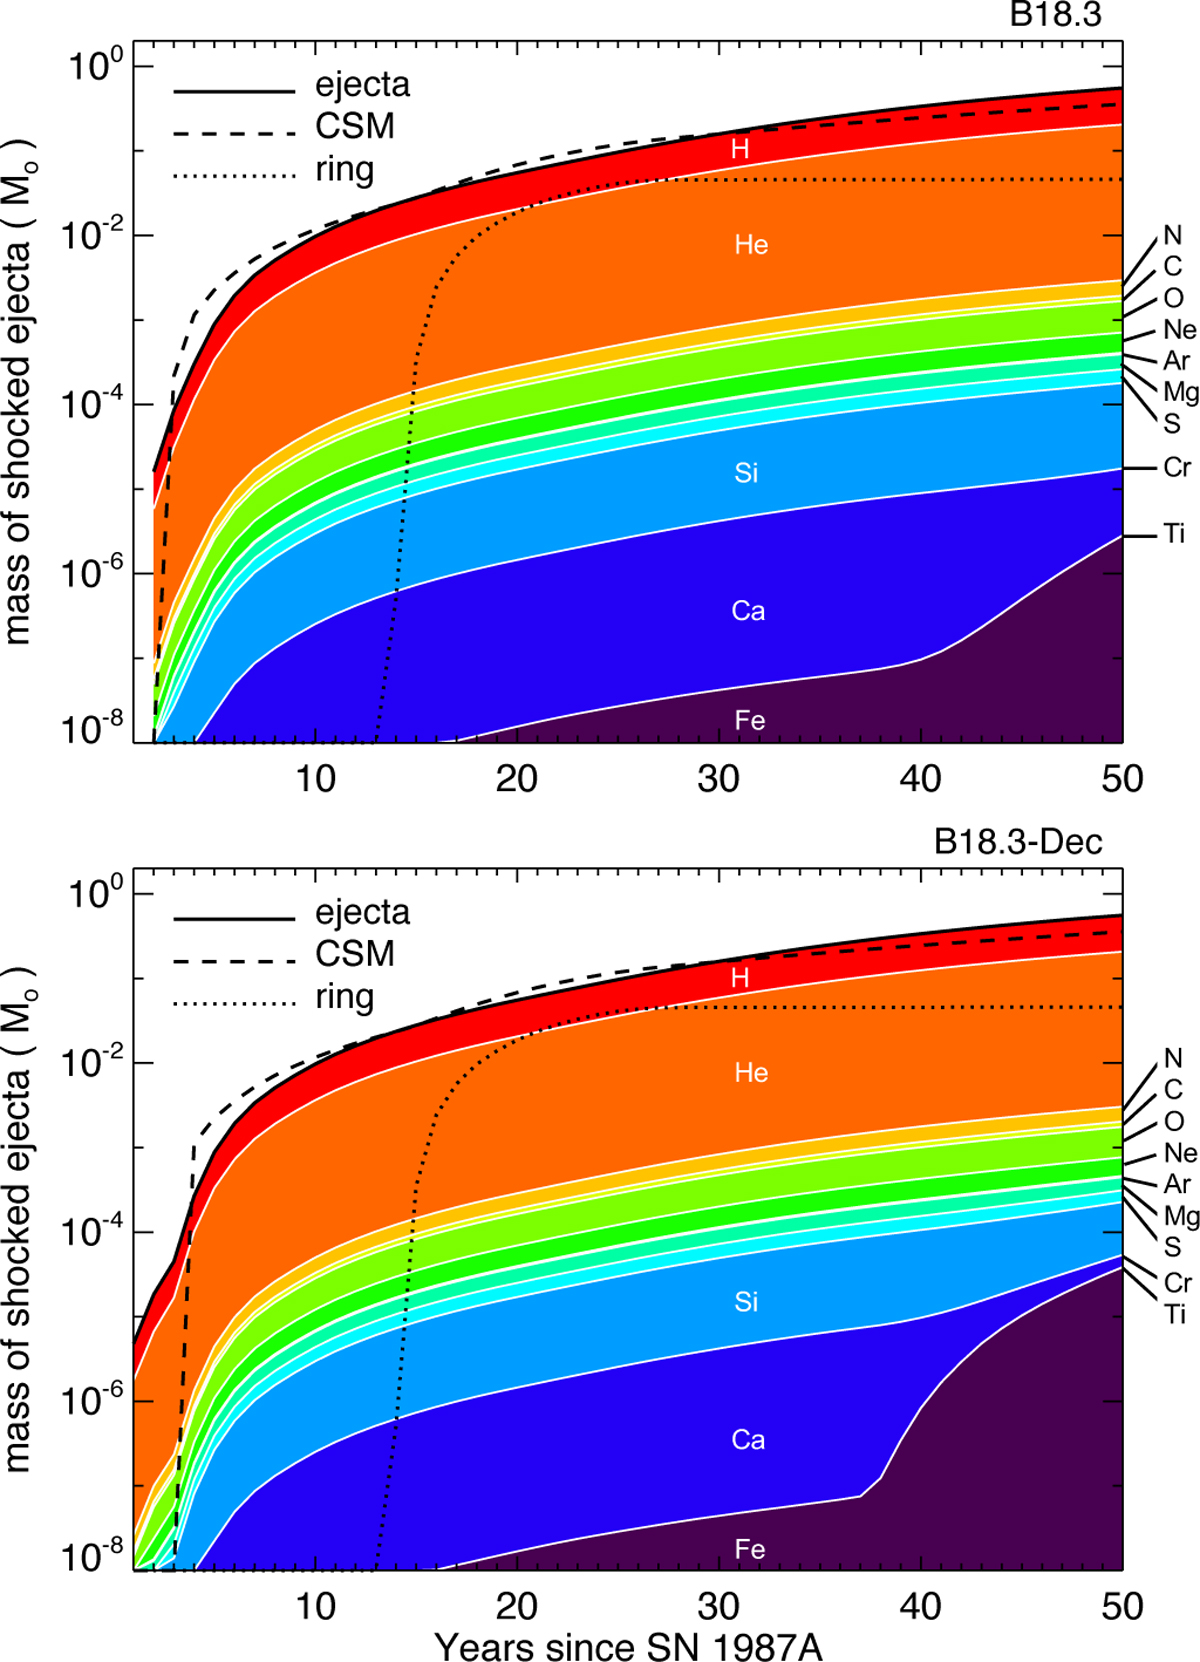
Evolution of the shocked ejecta mass (in units of M⊙) in log scale for various species as derived from models B18.3 (top panel) and B18.3-Dec (bottom). Different colors represent specific elements, as indicated by the labels. The black solid, dashed, and dotted lines represent the total shocked ejecta mass, the shocked CSM mass (including the H II region and the rings), and the mass of shocked material from the equatorial ring, respectively. Due to their low mass content, Ar, Cr, and Ti are barely visible in the figure.
Current usage metrics show cumulative count of Article Views (full-text article views including HTML views, PDF and ePub downloads, according to the available data) and Abstracts Views on Vision4Press platform.
Data correspond to usage on the plateform after 2015. The current usage metrics is available 48-96 hours after online publication and is updated daily on week days.
Initial download of the metrics may take a while.