Fig. 6
Download original image
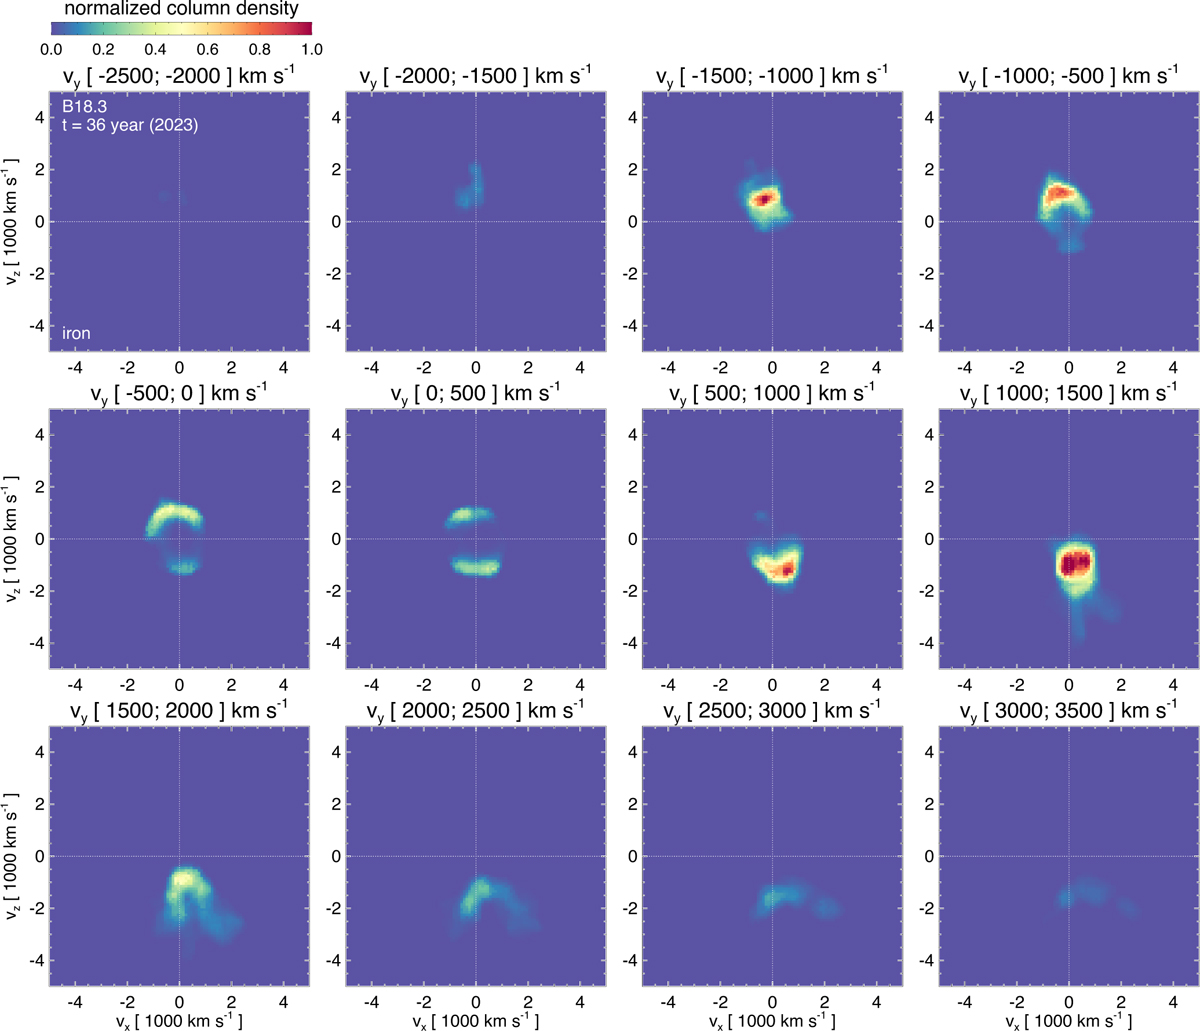
Distribution of Fe-rich ejecta from model B18.3 at t ≈ 36 years after core collapse (corresponding to February 2023) as a function of velocity along the y-axis (LoS), ranging from vy = -2500 km s-1 (top-left panel, near side of the remnant) to vy = 3500 km s-1 (bottom-right panel, far side of the remnant). Each panel shows the Fe-mass density integrated over a 500 km s-1 velocity interval along vy , with the corresponding range labeled above each frame. The color scale (top left of the figure) indicates the normalized column density of Fe. The axes represent velocity components in the plane of the sky: vx (east-west direction) and vz (south-north direction).
Current usage metrics show cumulative count of Article Views (full-text article views including HTML views, PDF and ePub downloads, according to the available data) and Abstracts Views on Vision4Press platform.
Data correspond to usage on the plateform after 2015. The current usage metrics is available 48-96 hours after online publication and is updated daily on week days.
Initial download of the metrics may take a while.