Fig. 15
Download original image
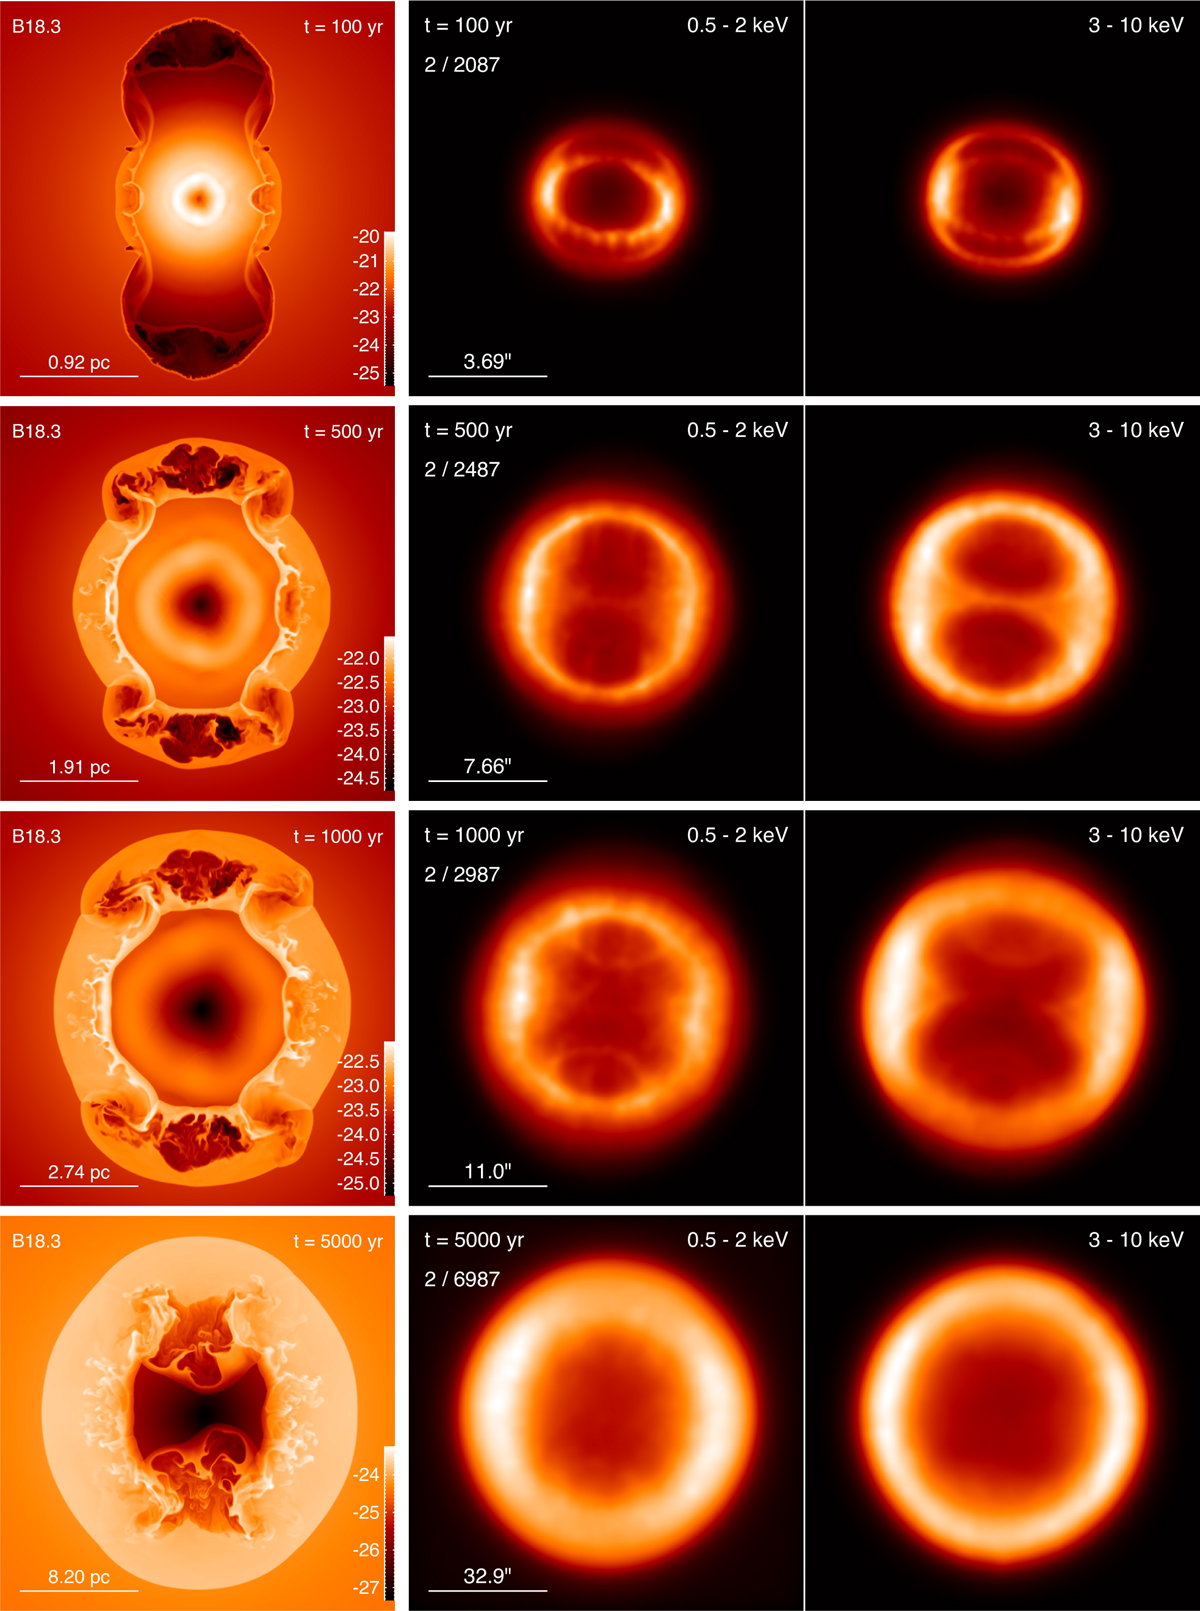
Predicted long-term evolution of SN 1987A over the next 5000 years based on model B18.3. The left panels show cross-sections of the mass density distribution (in log scale, in units of g cm-3) in a plane perpendicular to the equatorial ring, passing through the explosion center, at four different epochs (see labeled times). The right panels present the corresponding synthetic thermal X-ray emission maps in the [0.5, 2.0] keV (on the left) and [3.0, 10.0] keV (on the right) bands, assuming an orientation consistent with that of SN 1987A. Each X-ray image is normalized to its maximum for visibility, and the maps are convolved with a Gaussian of 0.1 arcsec to approximate the spatial resolution of Chandra.
Current usage metrics show cumulative count of Article Views (full-text article views including HTML views, PDF and ePub downloads, according to the available data) and Abstracts Views on Vision4Press platform.
Data correspond to usage on the plateform after 2015. The current usage metrics is available 48-96 hours after online publication and is updated daily on week days.
Initial download of the metrics may take a while.