Fig. 9
Download original image
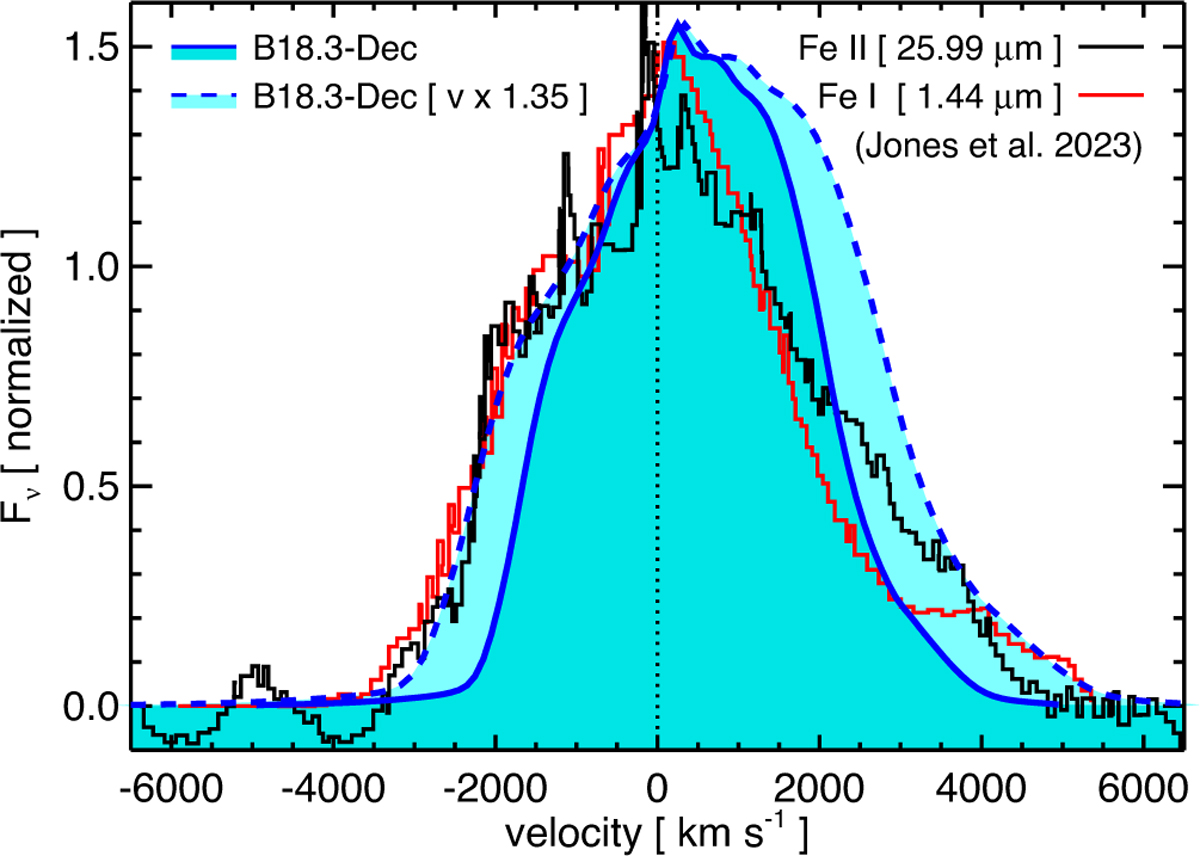
Profiles of continuum-subtracted [Fe II] (25.99 μm; black line) and [Fe I] (1.44 μm; red line) emission lines from the inner ejecta of SN 1987A, as observed on July 16, 2022, with JWST (Jones et al. 2023). These are compared with the total mass distribution of unshocked Fe-rich ejecta as a function of the LoS velocity, predicted by model B18.3-Dec for February 2023 (solid blue line). The dashed blue line represents the Fe mass distribution with an artificially increased LoS velocity (by 35%) to better match the JWST observations (Larsson et al. 2023). The Fe mass distributions have been normalized to roughly match the peak of [Fe I] line.
Current usage metrics show cumulative count of Article Views (full-text article views including HTML views, PDF and ePub downloads, according to the available data) and Abstracts Views on Vision4Press platform.
Data correspond to usage on the plateform after 2015. The current usage metrics is available 48-96 hours after online publication and is updated daily on week days.
Initial download of the metrics may take a while.