| Issue |
A&A
Volume 699, July 2025
|
|
|---|---|---|
| Article Number | A80 | |
| Number of page(s) | 34 | |
| Section | Extragalactic astronomy | |
| DOI | https://doi.org/10.1051/0004-6361/202553896 | |
| Published online | 30 June 2025 | |
The ALMA-CRISTAL survey: Gas, dust, and stars in star-forming galaxies when the Universe was ∼1 Gyr old
I. Survey overview and case studies
1
Departamento de Astronomía, Universidad de Concepción, Barrio Universitario, Concepción, Chile
2
Millenium Nucleus for Galaxies (MINGAL), Concepción, Chile
3
Instituto de Astrofísica, Facultad de Física, Pontificia Universidad Católica de Chile, Santiago 7820436, Chile
4
Max-Planck-Institut für extraterrestrische Physik, Giessenbachstrasse 1, 85748 Garching, Germany
5
Instituto de Estudios Astrofísicos, Facultad de Ingeniería y Ciencias, Universidad Diego Portales, Av. Ejército 441 Santiago 8370191, Chile
6
Sterrenkundig Observatorium, Ghent University, Krijgslaan 281 – S9, B9000 Ghent, Belgium
7
Department of Physics and Astronomy and George P. and Cynthia Woods Mitchell Institute for Fundamental Physics and Astronomy, Texas A&M University, 4242 TAMU, College Station, TX 77843-4242, USA
8
Faculty of Engineering, Hokkai-Gakuen University, Toyohira-ku, Sapporo 062-8605, Japan
9
National Astronomical Observatory of Japan, 2-21-1 Osawa, Mitaka, Tokyo 181-8588, Japan
10
National Radio Astronomy Observatory, 520 Edgemont Road, Charlottesville, VA 22903, USA
11
Department of Astronomy and Joint Space-Science Institute, University of Maryland, College Park, MD 20742, USA
12
Leiden Observatory, Leiden University, NL-2300 RA Leiden, The Netherlands
13
Chemistry Department, Sapienza University of Rome, P.le A. Moro, 00185 Rome, Italy
14
International Centre for Radio Astronomy Research (ICRAR), The University of Western Australia, M468, 35 Stirling Highway, Crawley, WA 6009, Australia
15
Centre for Astrophysics and Supercomputing, Swinburne University of Technology, Hawthorn, VIC 3122, Australia
16
ARC Centre of Excellence for All Sky Astrophysics in 3 Dimensions (ASTRO 3D), Canberra, ACT, Australia
17
Institute of Astrophysics, Foundation for Research and Technology – Hellas (FORTH), Voutes, 70013 Heraklion, Greece
18
School of Sciences, European University Cyprus, Diogenes street, Engomi, 1516 Nicosia, Cyprus
19
Scuola Normale Superiore, Piazza dei Cavalieri 7, 50126 Pisa, Italy
20
Department of Astronomical Science, SOKENDAI (The Graduate University for Advanced Studies), Mitaka, Tokyo 181-8588, Japan
21
Purple Mountain Observatory, Chinese Academy of Sciences, 10 Yuanhua Road, Nanjing 210023, China
22
Department for Astrophysical & Planetary Science, University of Colorado, Boulder, CO 80309, USA
23
Waseda Research Institute for Science and Engineering, Faculty of Science and Engineering, Waseda University, 3-4-1 Okubo, Shinjuku, Tokyo 169-8555, Japan
24
Max-Planck-Institut für Astrophysik, Karl-Schwarzschild-Str. 1, D-85748 Garching, Germany
25
Dipartimento di Fisica e Astronomia “Augusto Righi”, Alma Mater Studiorum, Università di Bologna, Via Gobetti 93/2, 40129 Bologna, Italy
26
INAF – Osservatorio di Astrofisica e Scienza dello Spazio di Bologna, Via Gobetti 93/3, 40129 Bologna, Italy
27
Department of Physics and Astronomy and PITT PACC, University of Pittsburgh, Pittsburgh, PA 15260, USA
28
Astrophysics Research Institute, Liverpool John Moores University, 146 Brownlow Hill, Liverpool L3 5RF, UK
29
School of Physics and Astronomy, Tel Aviv University, Tel Aviv 69978, Israel
30
Dept. Fisica Teorica y del Cosmos, Universidad de Granada, Granada, Spain
31
Department of Astronomy, University of Florida, 211 Bryant Space Sciences Center, Gainesville, FL 32611, USA
32
Cosmic Dawn Center at the Niels Bohr Institute, University of Copenhagen and DTU-Space, Technical University of Denmark, Copenhagen, Denmark
33
Department of Astronomy, University of Virginia, 530 McCormick Road, Charlottesville, VA 22903, USA
34
Las Campanas Observatory, Carnegie Institution of Washington, Raúl Bitrán 1200, La Serena, Chile
35
Jodrell Bank Centre for Astrophysics, Department of Physics and Astronomy, School of Natural Sciences, The University of Manchester, Manchester M13 9PL, UK
⋆ Corresponding author: rhc@astro-udec.cl
Received:
24
January
2025
Accepted:
1
April
2025
We present the ALMA-CRISTAL survey, an ALMA Cycle 8 Large Program designed to investigate the physical properties of star-forming galaxies at 4 ≲ z ≲ 6 through spatially resolved, multiwavelength observations. This survey targets 19 star-forming main-sequence galaxies selected from the ALPINE survey, using ALMA Band 7 observations to study [C II] 158 μm line emission and dust continuum, complemented by JWST/NIRCam and HST imaging to map stellar and UV emission. The CRISTAL sample expanded to 39 after including newly detected galaxies in the CRISTAL fields, archival data, and pilot study targets. The resulting dataset provides a detailed view of gas, dust, and stellar structures on kiloparsec scales at the end of the era of reionization. The survey reveals diverse morphologies and kinematics, including rotating disks, merging systems, [C II] emission tails from potential interactions, and clumpy star formation. Notably, the [C II] emission in many cases extends beyond the stellar light seen in HST and JWST imaging. Scientific highlights include CRISTAL-10, exhibiting an extreme [C II] deficit similar to Arp 220, and CRISTAL-13, where feedback from young star-forming clumps likely causes an offset between the stellar clumps and the peaks of [C II] emission. CRISTAL galaxies exhibit global [C II]/FIR ratios that decrease with increasing FIR luminosity, similar to trends seen in local galaxies but shifted to higher luminosities, likely due to their higher molecular gas content. CRISTAL galaxies also span a previously unexplored range of global FIR surface brightness at high-redshift, showing that high-redshift galaxies can have elevated [C II]/FIR ratios. These elevated ratios are likely influenced by factors such as lower-metallicity gas, the presence of significant extraplanar gas, and contributions from shock-excited gas.
Key words: galaxies: high-redshift / galaxies: interactions / galaxies: ISM / galaxies: kinematics and dynamics / galaxies: star formation / galaxies: structure
© The Authors 2025
 Open Access article, published by EDP Sciences, under the terms of the Creative Commons Attribution License (https://creativecommons.org/licenses/by/4.0), which permits unrestricted use, distribution, and reproduction in any medium, provided the original work is properly cited.
This article is published in open access under the Subscribe to Open model. Subscribe to A&A to support open access publication.
1. Introduction
The study of galaxy formation and evolution is key to understanding the diversity of galaxies in the Universe. Investigating the first billion years after the Big Bang is especially important, as it marks a critical period when galaxies transitioned from primordial gas clouds into organized systems, rapidly assembling their stellar mass, forming stars, growing their gas, metal, and dust content, and playing an important role in reionizing the Universe (e.g., Bromm & Yoshida 2011; Stark 2016).
Multiwavelength observations are crucial for studying these distant galaxies, as they allow us to probe different components of the interstellar (ISM) and circumgalactic (CGM) media. In particular, observations with the Atacama Large Millimeter/submillimeter Array (ALMA) are key for tracing the cold gas and dust reservoirs in galaxies, which fuel star formation and are closely linked to galaxy evolution (e.g., Tacconi et al. 2020; Hodge & da Cunha 2020). When combined with observations with the James Webb Space Telescope (JWST) of the stellar and nebular components (e.g., Robertson 2022), these provide a comprehensive view of how galaxies evolved during the first billion years of cosmic history.
Among the diverse population of galaxies in the Universe, this paper focuses on those that follow the well-established correlation between stellar mass (M⋆) and the star formation rate (SFR), commonly referred to as the main sequence of star-forming galaxies (e.g., Brinchmann et al. 2004; Rodighiero et al. 2011; Speagle et al. 2014). These galaxies represent the majority of star-forming systems across cosmic time, and this relationship has been observed to persist at least up to z ∼ 6 (e.g., Rinaldi et al. 2025). Their location on the main sequence reflects a balance between gas accretion, star formation, and feedback processes, making them ideal laboratories in which to study the interplay between these phenomena, commonly referred to as the baryon cycle of galaxies (e.g., Tumlinson et al. 2017).
In the early days of submillimeter astronomy, studies of high-redshift galaxies focused on the brightest systems due to the limited sensitivity of the available facilities. These included extreme objects such as luminous starbursts, quasars, and highly magnified galaxies observed through gravitational lensing (e.g., Maiolino et al. 2005; Iono et al. 2006; Stacey et al. 2010; Wagg et al. 2010; Cox et al. 2011; De Breuck et al. 2011; Venemans et al. 2012; Walter et al. 2012; Vieira et al. 2013; Gullberg et al. 2015; Decarli et al. 2018). Initially, these studies were confined to global properties of galaxies, but the advent of facilities such as ALMA and the Northern Extended Millimeter Array (NOEMA) enabled spatially resolved investigations on kiloparsec scales (e.g., Riechers et al. 2013; Gullberg et al. 2018; Neeleman et al. 2019, 2020; Rizzo et al. 2021, 2022; Fraternali et al. 2021; Herrera-Camus et al. 2021; Spilker et al. 2022; Fujimoto et al. 2024). While these studies provided valuable insights into the most extreme cases of galaxy evolution, they did not fully capture the broader, more representative population of main-sequence galaxies that dominate cosmic star formation at high redshifts.
The first comprehensive efforts to study the cold gas and dust in main-sequence galaxies at 4 ≲ z ≲ 6 began with small ALMA surveys, observing the [C II] 158 μm line and dust continuum emission in roughly ten galaxies in the COSMOS field (Capak et al. 2015). These were followed by larger surveys, such as the ALMA Large Program ALPINE (Le Fèvre et al. 2020; Béthermin et al. 2020; Faisst et al. 2020a), which expanded the sample to over 100 galaxies. Additionally, the REBELS survey (Bouwens et al. 2022) extended the study of massive, star-forming galaxies to even higher redshifts (z ∼ 7 − 8), offering insights into the cosmic dawn. While these surveys that focused on main-sequence star-forming galaxies provided valuable global measurements of cold gas and dust, they lacked the angular resolution needed to resolve their detailed internal structures. This also complicates the comparison between the cold gas and dust traced by ALMA and the stellar and ionized gas components traced by HST and JWST. To address this limitation, the “[CII] Resolved ISM in STar-forming galaxies with ALMA” (CRISTAL) survey was designed. The primary scientific goal of the CRISTAL survey is to build a detailed census of gas, dust, and stars on kiloparsec scales in typical star-forming galaxies at 4 < z < 6. The goal of this survey paper is to detail the selection process of the CRISTAL galaxies, describe the observations and data reduction methods, summarize the available multiwavelength data, present the results regarding detections and the main properties of the [C II] and dust continuum emission, and highlight key scientific findings from both individual cases and the overall sample.
This paper is organized as follows. In Sect. 2, we summarize the contributions of the CRISTAL survey to four key areas of galaxy evolution: kinematics, outflows, morphologies, and the properties of the ISM and star formation. In Sect. 3, we describe the selection criteria and main properties of the CRISTAL galaxy sample. Section 4 provides an overview of the ALMA observations, while Sect. 5 outlines the data reduction and processing steps for the ALMA data. Section 6 presents the ancillary data available for CRISTAL galaxies, including observations from the Hubble Space Telescope (HST) and JWST. In Sect. 7, we report the results, featuring a multiwavelength view of the CRISTAL galaxies. Section 8 explores two case studies focused on CRISTAL-10 and CRISTAL-13. In Sect. 9, we analyze the [C II]/FIR ratio across the CRISTAL sample. Finally, Sect. 10 presents the summary and conclusions. Throughout this paper, we assume a flat Universe with cosmological parameters of ΩM = 0.3, ΩΛ = 0.7, and H0 = 70 km s−1 Mpc−1. All stellar masses and SFRs are normalized to a Chabrier (2003) initial mass function.
2. Overview of first science results of the CRISTAL survey
2.1. Kinematics
The kinematic properties of galaxies offer valuable insights into their formation history and their current state of evolution. For example, the intrinsic velocity dispersion (σ0) of the gas is a measure of the level of turbulence, with high σ0 values resulting from star formation feedback and radial gas transport (e.g., Krumholz et al. 2018). Moreover, the ratio between the rotation velocity (Vrot) and σ0 serves as an indicator of disk stability. Galaxies with ordered rotation and Vrot/σ0 ≳ 2 − 3 are generally classified as dynamically cold, stable disks (e.g., Förster Schreiber & Wuyts 2020).
For main-sequence galaxies in the redshift range 4 < z < 6, early morpho-kinematic analyses using low-angular-resolution [C II] observations suggest that only a small fraction (≲40%) exhibit evidence of ordered rotation (Le Fèvre et al. 2020), including a more detailed analysis by Jones et al. (2021) using the tilted ring model fitting code 3DBarolo (Di Teodoro & Fraternali 2015). More recent high-resolution [C II] observations at kiloparsec scales have provided a clearer view of the kinematics of these galaxies. For instance, there is evidence of rotationally supported cold disks in star-forming main-sequence galaxies at z = 4.3 (Vrot/σ0 = 3.4; Neeleman et al. 2020) and z = 5.5 (HZ4 or CRISTAL-20: Vrot/σ0 = 2.2; Herrera-Camus et al. 2022), although JWST/NIRSpec data for the latter system suggests a more complex scenario (Parlanti et al. 2025). The same is true for dusty star-forming galaxies above the main sequence (e.g., Rizzo et al. 2021). Similar conclusions are drawn from NIR rest-frame morphological studies, which reveal the existence of massive, unperturbed disk-like galaxies at z ∼ 4 − 6 (e.g., Huertas-Company et al. 2024).
More recently, based on ALMA observations from the CRISTAL survey, in Posses et al. (2025) we analyze the kinematics of the main-sequence galaxy CRISTAL-05 (also known as DEIMOS_COSMOS_683613 and HZ3). In contrast to earlier classifications of CRISTAL-05 as a single source, these new observations reveal it to be a close interacting pair surrounded by an extended region of carbon-enriched gas. The overall velocity is irregular across the full system, although one of the pair member is consistent with disk rotation; the velocity dispersion is roughly constant and around 80 km s−1. Another notable example is the HZ10 system (CRISTAL-22), where CRISTAL and JWST/NIRSpec IFU observations show that this massive galaxy consists of at least three closely projected components, with complex kinematics suggesting a possible close merger or disturbed disk (Jones et al. 2024; Telikova et al. 2025).
The findings from individual CRISTAL systems highlight the intricate kinematics of star-forming galaxies during the first ∼1 Gyr. In Lee et al. (2025), we present a detailed morpho-kinematic analysis of 35 CRISTAL galaxies, reporting that nearly ∼50% of them are classified as disk-dominated. Additionally, CRISTAL galaxies exhibit high intrinsic velocity dispersions (∼70 km s−1), likely driven by gravitational instabilities.
2.2. Outflows
Outflows, driven by stellar and active galactic nucleus (AGN) feedback, are expected to play a key role in regulating star formation and shaping galaxy evolution (e.g., Veilleux et al. 2020). Despite recent progress, we still lack a comprehensive characterization of the outflow properties in individual galaxies during the early cosmic epochs. Recently, JWST/NIRSpec observations have found potential signatures of outflows in low-mass galaxies at z ≳ 4, probing the ionized gas phase (e.g., Zhang et al. 2024; Carniani et al. 2024). However, low ionization or colder (T ∼ 300 − 400 K) gas in the outflow, traced for example by [C II] emission (e.g., Contursi et al. 2013), remains largely unexplored. Understanding this cold component is critical, as it likely dominates the mass of outflows (e.g., Fluetsch et al. 2019; Herrera-Camus et al. 2020). Simulations (e.g., Pizzati et al. 2020, 2023) suggest that these outflows are also connected to the diffuse [C II] emission observed around galaxies, extending into the CGM (Fujimoto et al. 2019, 2020).
For main-sequence galaxies at z ≳ 4, Gallerani et al. (2018) conducted one of the earliest efforts to characterize outflows using stacked global [C II] spectra from galaxies in the Capak et al. (2015) sample, finding tentative evidence of outflows. Building on this work, Ginolfi et al. (2020), using the larger ALPINE sample, detected broad [C II] emission in stacked profiles, with velocities of ∼ 500 km s−1. This broad component is particularly prominent in galaxies with SFRs exceeding ≈ 25 M⊙ yr−1.
For individual galaxies, Herrera-Camus et al. (2021) focus on the neutral outflow phase in HZ4 (CRISTAL-20, DEIMOS_COSMOS_494057), reporting evidence of outflowing gas from the central star-forming region. They find projected velocities of ∼ 400 km s−1 and a neutral gas mass outflow rate ∼ 3 − 6 times higher than the SFR in the central region. Recent JWST/NIRSpec observations have also identified the ionized phase of the HZ4 outflow, confirming that the mass outflow rate is predominantly driven by neutral gas traced by the [C II] transition (Parlanti et al. 2025).
Among the CRISTAL sample, we identify additional evidence of outflowing gas traced by [C II] line emission. One key advantage relative to previous programs such as ALPINE is the higher angular resolution, which allows one to search for outflows in the nuclear regions of galaxies, or centered at star-forming clumps identified with HST or JWST, at a comparable or better sensitivity. For example, CRISTAL-02 exhibits the strongest [C II] outflow, with the ionized counterpart also detected in recent JWST/NIRSpec observations (Davies et al. 2025). CRISTAL-08 exhibits evidence of outflowing gas associated with the giant star-forming clumps abundant in its disk, which will be discussed in detail in a forthcoming letter by Herrera-Camus et al. (in prep.). Additionally, in Birkin et al. (2025) we report tentative evidence of modest outflows with velocities of ∼300 km s−1 based on the stacking of [C II] spectra for CRISTAL galaxies, excluding systems with kinematic evidence of gravitational interactions from high-angular-resolution observations. Overall, we find that mass loading rates in CRISTAL galaxies are generally modest but can reach values comparable to the ones observed in nearby starbursts.
2.3. Morphology
During the early cosmic epochs covered by the CRISTAL survey, galaxies experienced rapid growth and intense star formation. Observing their sizes and morphologies – such as disks, clumps, and spatial offsets between various tracers – reveals how these galaxies assembled under the influence of gravity, mergers, and feedback. Ultimately, morphological studies are important for characterizing the turbulent conditions of the early Universe, providing important tests for models of galaxy growth and the role of physical processes such as feedback.
For main-sequence galaxies at 4 ≲ z ≲ 6, one of the key discoveries by ALMA was detecting [C II] line emission extending well beyond the star-forming regions traced by rest-frame UV or dust continuum emission. Fujimoto et al. (2019) found evidence of a 10 kpc-scale extended gas component through stacked [C II] emission from ALPINE galaxies, with further analysis by Fujimoto et al. (2020) revealing [C II] emission sizes typically 2 − 3 times larger than the UV or dust continuum. Several scenarios could explain these extended [C II] emissions, such as outflows depositing gas in the surrounding medium (e.g., Pizzati et al. 2020, 2023), unresolved satellite galaxies, or circumgalactic photodissociation regions (PDRs). Disentangling these origins requires deep, multiwavelength, spatially resolved observations. Such data have started to emerge; for example, Lambert et al. (2023) find that [C II] emission in HZ7 (CRISTAL-21) is about twice the size of its rest-frame UV emission, likely due to a merger resulting in a nonrotating disk. For HZ4 (CRISTAL-20, DEIMOS_COSMOS_494057), the extended [C II] emission may be linked to the outflowing gas from the central region (Herrera-Camus et al. 2021).
The CRISTAL survey offers an advantage over previous studies by providing deep, spatially resolved [C II] observations that allow one to test various scenarios to explain the extended nature of [C II] emission. Based on CRISTAL observations, we report in Ikeda et al. (2025) that, on average, [C II] emission extends approximately three times farther than rest-frame UV emission and twice as far as the dust continuum. Notably, this extended emission can be well modeled by an exponential disk, without requiring an additional halo-like component. Interestingly, Ikeda et al. (2025) detects extended [C II] emission in CRISTAL galaxies both with and without companions, suggesting that the contributions from PDRs, in addition to diffuse neutral medium (atomic gas) at large radius, may further enhance the spatial distribution of [C II] emission.
An excellent illustration of the complex morphology and spatial distribution of the [C II] emission in z ∼ 5 galaxies is the analysis of the CRISTAL-01 field (DEIMOS_COSMOS_842313) by Solimano et al. (2024, 2025). This system features a close interaction between the disturbed CRISTAL-01 and the submillimeter galaxy (SMG1) J1000+0234 (Gómez-Guijarro et al. 2018; Fraternali et al. 2021), surrounded by two companion systems (CRISTAL-01b and -01c; see Sect. 7.3) and embedded within a giant Lyman-α blob (Jiménez-Andrade et al. 2023). Most notably, a ∼15 kpc plume of [C II] gas emerges from the center of the SMG, potentially driven by AGN activity, as revealed by JWST/NIRSpec observations (Solimano et al. 2025).
Regarding the dust morphology of star-forming galaxies at z ∼ 5, the depth of the CRISTAL survey enables one to probe FIR surface densities an order of magnitude lower than those typical of SMGs. In Mitsuhashi et al. (2024), we find that the effective radius of the dust continuum is, on average, twice as large as that of the UV continuum – contrary to trends predicted by the TNG50 simulations (Popping et al. 2022). One possible interpretation for this intriguing result is that the dust continuum emission traces more extended, global (obscured) star formation, while the rest-frame UV continuum is associated with concentrated star-forming clumps within galaxies and/or less obscured lines of sight.
2.4. Interstellar medium and star formation
By observing both the [C II] line and dust continuum emission, the CRISTAL survey provides valuable information about the ISM of z ∼ 4 − 6 star-forming galaxies. The [C II] line, the primary coolant of the ISM, arises from multiple phases – including dense PDRs, diffuse atomic gas, and ionized gas – making it an effective tracer of the ISM complex structure (e.g., Pineda et al. 2013). Observations of the dust continuum, on the other hand, provide information on the heating mechanisms within the ISM. Dust grains and polycyclic aromatic hydrocarbons absorb UV photons and release electrons, heating the gas through the photoelectric effect. This balance of [C II] cooling and dust-driven heating, often measured by the [C II]/FIR ratio, is important for studying star formation and galaxy evolution in the early Universe (e.g., Wolfire et al. 2022).
In an ISM in thermal equilibrium, cooling via the [C II] line can also trace heating from star formation activity. A strong relationship, both globally and on spatially resolved scales, exists between [C II] line emission and SFR in nearby galaxies (e.g., Pineda et al. 2014; De Looze et al. 2014; Herrera-Camus et al. 2015, 2018a), with little evolution observed in this relation across the redshift range of CRISTAL galaxies (Schaerer et al. 2020). For CRISTAL galaxies, Li et al. (2024) report a strong correlation between [C II] and SFR. However, they also identify significant scatter at larger radii and variable slopes in the [C II]-SFR relation across different CRISTAL systems. A more detailed analysis of the sources of this scatter will be presented in Palla et al. (in prep.).
In spatially resolved observations of CRISTAL galaxies, Herrera-Camus et al. (2021) find that the [C II]/FIR ratio in HZ4 (CRISTAL-20) spans ∼2 − 4 × 10⁻³, similar to values seen in star-forming regions of nearby starbursts such as M82 and M83, which exhibit comparable levels of star-formation rate surface density. In CRISTAL-05, Posses et al. (2025) report [C II]/FIR ratios in the main galaxy component of ∼2 − 8 × 10⁻³, while in outer regions where [C II] line emission is extended, the high [C II]/FIR lower limits (≳10−2) are comparable to values observed in local merging systems where [C II] emission is enhanced by shocks (e.g., Appleton et al. 2013; Peterson et al. 2018). In the system HZ10 (CRISTAL-22), Villanueva et al. (2024) measure [C II]/FIR ratios between ∼1 − 3 × 10⁻³. This analysis is particularly robust, benefiting from ALMA Band 9 observations at the peak of the dust spectral energy distribution (SED), enabling a robust determination of the dust temperature of Tdust = 46.7 ± 6.8 K, and thus a more accurate FIR luminosity.
Spatially resolved dust continuum observations in CRISTAL galaxies are also important to improve the SED modeling and obtain more accurate mapping of physical properties (e.g., age, SFR, M⋆, dust extinction AV). One key finding we present in Li et al. (2024) and Lines et al. (2025) is that, on ∼0.5–1 kpc scales, the stellar mass is not underestimated despite the fact that light from younger stars can outshine and mask the contribution from older, fainter stars – a process typically referred to as outshining.
Additionally, as has been shown by Li et al. (2024), combining JWST/NIRCam stellar light data with ALMA dust continuum measurements helps resolve the age-dust degeneracy, leading to more robust estimates of dust obscuration, which are often overestimated when ALMA data is excluded. These refined obscuration estimates impact the inferred spatial distribution of specific SFRs, offering a clearer view of trends in galaxy growth and quenching, such as inside-out evolution. There results are further supported by the fact that CRISTAL galaxies show a high fraction of dust-obscured star formation – averaging around 50% but varying widely from 20% to 90% – indicating substantial diversity in dust properties and morphology, as we discuss in Mitsuhashi et al. (2024). This level of dust obscuration is comparable to what has been observed in star-forming galaxies at 4 ≲ z ≲ 6 in the ALPINE sample (Khusanova et al. 2021; Fudamoto et al. 2020), and massive star-forming galaxies at z ≳ 6.5 (Inami et al. 2022).
2.5. The emerging picture
The CRISTAL survey provides a detailed view on kiloparsec scales of galaxies during the first billion years of cosmic history, highlighting their complexity and dynamic evolution. The kinematic analyses suggest that star-forming galaxies in this epoch exhibit a wide range of behaviors, from rotationally supported cold disks (∼50%) to complex, irregular velocity fields indicative of interactions or mergers (Lee et al. 2025). Such findings challenge simplified models of early disk formation and point to a dynamic interplay of turbulence, feedback, and environmental interactions shaping galaxy evolution at z = 4 − 6.
Beyond kinematics, the CRISTAL survey has significantly advanced our understanding of outflows, morphologies, and the ISM properties in young galaxies. Outflows traced by [C II] emission, observed in systems such as CRISTAL-20 (Herrera-Camus et al. 2021; Parlanti et al. 2025), CRISTAL-02 (also detected in the ionized phase with JWST/NIRSpec; Davies et al. 2025), and through the stacking of non-interacting CRISTAL systems (Birkin et al. 2025), highlight the role that the neutral gas ejection can have regulating star formation and enriching the CGM.
Our morphological studies reveal extended [C II] emission components, often spanning several times the extent of UV or dust emission regions, which suggest contributions from diffuse gas or feedback-driven processes (Ikeda et al. 2025). Moreover, our analysis of the dust morphology highlights the presence of extended obscured star formation, with dust emission typically reaching approximately twice the size of the rest-frame UV emission (Mitsuhashi et al. 2024). Collectively, these findings emphasize the importance of multiphase, multiwavelength observations in unraveling the complex assembly and evolutionary processes of galaxies during the early Universe.
3. The CRISTAL sample
3.1. Sample selection
The first step in the CRISTAL target selection was to search in the ALMA archive for galaxies in the redshift range 4 ≤ z ≤ 6 detected in [C II] line emission with a signal-to-noise of S/N ≥3. This was motivated by the need to preselect galaxies with a reliable redshift determination and a measured [C II] line flux that allows us to plan follow-up spatially resolved observations. The choice of redshift range, in addition to the scientific motivation described before, was set by the requirement to observe the [C II] transition in Band 7.
About 95% of the preselected galaxies from the ALMA archive at the time were part of the Capak et al. (2015) sample and the ALPINE survey (Le Fèvre et al. 2020; Béthermin et al. 2020; Faisst et al. 2020a). In these two programs, galaxies were typically observed for ≲1 h and with an angular resolution  (≳5 kpc), so most of the systems were barely resolved or spatially unresolved.
The next step was to select galaxies based on the following criteria:
-
Main sequence: With the goal of selecting typical or representative systems of the galaxy population between 4 ≤ z ≤ 6, we only considered galaxies within ±0.5 dex of the main sequence of star-forming galaxies as defined by Speagle et al. (2014). As is shown in Fig. 2, this calibration is is in good agreement with those of Schreiber et al. (2015) and Khusanova et al. (2021) for a similar redshift range. The SFRs and stellar masses for these systems were drawn from the literature (e.g., Capak et al. 2015; Faisst et al. 2020a).
-
Stellar mass: We selected systems with stellar masses greater than M⋆ ≥ 109.5 M⊙ according to the values from the ALPINE catalog presented in Faisst et al. (2020a). Given that the preselected systems are part of the main sequence, a cut in stellar mass also correspond to a cut in SFR of approximately ≥ 20 M⊙ yr−1, which in turn is also closely associated with the [C II] luminosity (e.g., Sargsyan et al. 2012; De Looze et al. 2014; Herrera-Camus et al. 2015; Schaerer et al. 2020). For galaxies with M⋆ ≲ 109.5 M⊙ we estimated that we would need observing times larger than ∼15 h to achieve our required sensitivity. Therefore, applying a stellar mass threshold at M⋆ = 109.5 M⊙ was important to keep the program within the observing time available for Large Programs in ALMA Cycle 8.
-
Rest-frame UV emission: To achieve our scientific goals regarding the study of kinematics, morphology, and star formation, we selected galaxies detected in rest-frame UV emission with the HST Wide Field Camera 3 (WFC3). Given that most of the preselected galaxies that fulfill this criteria are in the COSMOS field (Scoville et al. 2007), observations in at least three WFC3 filters were available for all systems, except for CRISTAL-14 and CRISTAL-19 for which only F160W data exist.
Having JWST data available, which trace the stellar and ionized gas light, was not part of the selection criteria (as the telescope had not yet been launched at the time of the proposal). However, because a large fraction of the preselected systems are in the COSMOS field, there are programs such as COSMOS-Web (PID 1727; co-PIs: Kartaltepe & Casey; Casey et al. 2023) and PRIMER (PI: Dunlop, PID 1837) that provide NIRCam and/or MIRI observations in multiple filters for a large fraction of systems. There is also NIRSpec observations of the main nebular lines from programs such as GA-NIFS (PI: Luetzgendorf, PID 1217), ORCHIDS (PI: Aravena, PID 5974) and PID 3073 (PI Faisst). We discuss this in more detail in Sect. 6.
After applying the initial selection criteria based on redshift (4 ≤ z ≤ 6), [C II] signal-to-noise ratio (S/N ≥3), and main-sequence membership (|log10(ΔMS)| ≤ 0.5 dex), we selected 81 out of 124 systems. Subsequently, applying the additional criteria of stellar mass (Mstar ≥ 109.5 M⊙), observability, and the availability of ancillary HST data reduced the sample to 25 galaxies. Seven of them, however, already had spatially resolved [C II] line observations in the ALMA archive. These systems are: HZ4 (PI R. Herrera-Camus; Herrera-Camus et al. 2021, 2022), HZ3 (PI M. Aravena; Posses et al. 2025), HZ7 (PI M. Aravena; Lambert et al. 2023, HZ10 (PI M. Aravena; Telikova et al. 2025) (all of them designed as pilot programs for the CRISTAL ALMA Large Program), and DEIMOS_COSMOS_818760, DEIMOS_COSMOS_873756, and vuds_cosmos_5101218326 (PI E. Ibar; Devereaux et al. 2024). Except for HZ3, we did not request additional Band 7 observations as the sensitivity and angular resolution achieved in the programs was good enough to pursue the main scientific goals of CRISTAL.
In summary, the sample that was observed with ALMA as part of the CRISTAL Large Program consisted of 19 targets. The details of the ALMA observations are presented in Sect. 4.
3.2. Final CRISTAL sample
After the ALMA observations were completed, the CRISTAL sample increased in size for two main reasons:
-
Additional galaxies in CRISTAL fields: The deeper, higher angular resolution observations revealed additional companion galaxies in the field-of-view of the main 19 CRISTAL targets. In total, we detected seven additional new galaxies in the field (CRISTAL-01b, c, -07c, d, -09b, -10b, -13b) and we spatially resolved four interacting systems into pairs (CRISTAL-04b, -06b, -07b, -16b). A thorough search and characterization of all systems in the CRISTAL [C II] cubes will be presented in van Leeuwen et al. (in prep.).
-
Galaxies in the ALMA archive: In total we included 6 systems from the ALMA archive with angular resolution and sensitivity comparable to that achieved by the CRISTAL program. Three of them are from pilot programs (HZ4, HZ7, and HZ10), and the other three are from an ALPINE follow-up program (PI E. Ibar; DEIMOS_COSMOS_818760, DEIMOS_COSMOS_873756, vuds_cosmos_5101218326; Devereaux et al. 2024). The high-angular-resolution observations of HZ10 and DEIMOS_COSMOS_818760 allow us to spatially resolve the systems into two (CRISTAL-22a, b) and three galaxies (CRISTAL-23a, b, c), respectively.
In total, the final CRISTAL sample includes 39 main-sequence star-forming galaxies, including companion galaxies detected around the originally targeted main galaxies. Among the systems added to the original sample, those with measurable stellar masses meet the criteria for being on the main sequence. However, their stellar masses can extend below the initial selection threshold of M⋆ = 109.5 M⊙.
Table A.1 summarizes the main properties of all CRISTAL systems. The stellar masses and SFRs were derived using the CIGALE code (Boquien et al. 2019), and the details for these calculations are described in Mitsuhashi et al. (2024)2. In general, there is a good agreement between the stellar masses and SFRs derived by Mitsuhashi et al. (2024) using CIGALE, by Li et al. (2024) using MAGPHYS (including JWST/NIRCam data), and those in the ALPINE database (Faisst et al. 2020a) based on the LePhare SED fitting code (Arnouts et al. 1999; Ilbert et al. 2006), with a mean difference of only ∼0.1 dex between the estimates. The coordinates and redshifts in Table A.1 are derived from the [C II] data, with the exception of CRISTAL-18, which is undetected in the [C II] transition despite deep observations (see Sect. 7 for further details).
Together with the 39 star-forming galaxies in CRISTAL, our ALMA observations also included two SMGs, J1000+0234 (Fraternali et al. 2021) and CRLE (Pavesi et al. 2018), which are within the field of view of CRISTAL-01 and CRISTAL-22 observations, respectively. Their properties are also listed in Table A.1. All the ALMA Band 7 observations – new and archival – for the CRISTAL galaxies and the SMGs were processed together through a common and optimized pipeline described in Sect. 5.
Figure 1 presents the distribution of redshift, stellar mass, and SFR for the CRISTAL galaxies in comparison to the ALPINE (Le Fèvre et al. 2020; Béthermin et al. 2020; Faisst et al. 2020a) and REBELS (Bouwens et al. 2022) samples. The median properties of the CRISTAL galaxies are: redshift z = 5.1, stellar mass M⋆ = 1010.1 M⊙, and SFR = 58 M⊙ yr−1. Figure 2 shows the CRISTAL galaxies in the context of the stellar mass-SFR plane for star-forming galaxies between 4 ≤ z ≤ 6. The scaling relations between SFR and M⋆ at z ≈ 5 from Speagle et al. (2014), Schreiber et al. (2015), and Khusanova et al. (2021), which are displayed in the figure, are generally consistent with one another. The colorscale indicates the redshift of the systems. Galaxies in the original CRISTAL sample and detected in the CRISTAL fields are shown as circles. There are three systems with stellar masses below the M⋆ ≥ 109.5 M⊙ selection cut. One of these is CRISTAL-12, for which our CIGALE-based stellar mass resulted in M⋆ ≥ 109.3 M⊙, a factor of ∼3 lower than the value in the ALPINE database (Faisst et al. 2020a). The other two galaxies are the minor companions in the interacting systems CRISTAL-04 and CRISTAL-06, with stellar masses of 108.91 M⊙ and 109.19 M⊙, respectively. Finally, the SMGs in the CRISTAL fields are shown as stars.
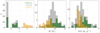 |
Fig. 1. Histograms showing the distribution of redshift (left), stellar mass (center), and SFR (right) for the CRISTAL (green), ALPINE (gray; Le Fèvre et al. 2020; Béthermin et al. 2020; Faisst et al. 2020a), and REBELS samples (gold; Bouwens et al. 2022). |
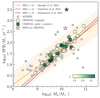 |
Fig. 2. Stellar mass-SFR plane for galaxies between 4 ≲ z ≲ 6. The CRISTAL sample consists of 39 star-forming galaxies between 4 ≲ z ≲ 6 that are representative of the population of massive (M⋆ ≳ 109 M⊙) galaxies at this redshift range. CRISTAL galaxies are shown as green circles, color-coded according to their redshift. The main sequence of star-forming galaxies at z = 5 is shown following the calibrations by Speagle et al. (2014) (with ±0.5 dex width represented by the shaded orange region), Schreiber et al. (2015), and Khusanova et al. (2021). Galaxies from the pilot programs and drawn from the archive are shown as squares. SMGs in the CRISTAL fields are shown as stars. Star-forming galaxies detected in [C II] line emission observed as part of the ALPINE survey (Le Fèvre et al. 2020; Béthermin et al. 2020; Faisst et al. 2020a) are shown as gray circles. |
4. Observations
ALMA observations for the CRISTAL galaxies were carried out during Cycle 8 and Cycle 9, between December 2021 and April 2023. Each galaxy was observed using a combination of a compact (typically C43-1 or -2) and a more extended (typically C43-4 or -5) array configuration. The goal was to spatially resolve the [C II] line and dust continuum emission on kiloparsec scales, while at the same time continue to be sensitive to large-scale (∼5″ or ∼15 kpc), more diffuse [C II] line and dust emission that has been found in high-z galaxies (e.g., Fujimoto et al. 2019, 2020; Lambert et al. 2023; Ikeda et al. 2025; Mitsuhashi et al. 2024).
For each CRISTAL source, we determined the required integration time and angular resolution based on the global [C II] flux from ALPINE (Béthermin et al. 2020) and the expected [C II] size. To estimate the latter, we scaled the rest-frame UV size measured from the HST data by a factor of ×1.5 following the size analysis of the ALPINE galaxies by Fujimoto et al. (2020). Then, we determined the observing time and angular resolution required to detect (≳4σ) and spatially resolve in [C II] line emission each CRISTAL galaxy with at least ∼4 independent beams within one [C II] effective radius. We chose the best combination of array configurations to achieve the desired angular resolution with the help of the simobserve task in CASA and the recommendations made by the ALMA Observing Tool. The final list of array configurations used and angular resolutions achieved for each CRISTAL target can be found in Table B.1.
The number of antennas used for the observations varied from track to track ranging from 41 to 50, with an average of 45. The flux calibrator for most of the CRISTAL sources was the quasar J1058+0133. The detail of the mean number of antennas and flux calibrator used for each CRISTAL target can be found in Table B.1. As can be seen from the first panel of Fig. 3, the observing times typically ranged from ∼4 − 5 h for the most massive sources to ∼8 − 15 h for the less massive systems.
 |
Fig. 3. Histogram showing the distribution of observing time (first panel), synthesized beam size (second panel), noise measured in the cubes for 20 km s−1 channels (third panel), and Band 7 continuum (fourth panel). The average values for ALPINE galaxies (Le Fèvre et al. 2020; Béthermin et al. 2020; Faisst et al. 2020a) are indicated by a gray line. |
The observations were performed in frequency division mode (FDM). In order to fully characterize the [C II] line profile of each CRISTAL target, in particular of systems with broad line profiles such as J1000+0234 in the CRISTAL-01 field, we placed two of the four spectral windows next to each other with an overlap of 0.12 GHz centered at the frequency of the line as detected in the ALPINE lower-angular resolution data (Le Fèvre et al. 2020; Béthermin et al. 2020). This way we provided contiguous frequency coverage of about 3.6 GHz around the line. The spectral resolution for the two spectral windows assigned for the line detection was set to 3.9 MHz, which corresponds to about ∼4 km s−1 for the representative frequency of the CRISTAL galaxies. The remaining two spectral windows were placed in the opposite sideband with the goal of detecting the continuum emission. We chose, however, to use a spectral window with a relatively high resolution of 7.8 MHz (∼8 km s−1) in order to use these data to search for serendipitous line detection in the field given the depth of the CRISTAL data (van Leeuwen et al. in prep.).
5. Data processing
5.1. ALPINE-ALMA
All CRISTAL galaxies were first observed with ALMA Band 7 as part of the ALPINE Large Program (Le Fèvre et al. 2020; Béthermin et al. 2020; Faisst et al. 2020a), and some also as part of the Capak et al. (2015) program (CRISTAL-02, 03, 05, 07, 10, 20, 21, 22). There are two main differences between the ALPINE and the CRISTAL observations:
-
ALPINE was a program with the aim of building a large sample of star-forming galaxies at 4 ≲ z ≲ 6 detected in [C II] line emission. For this reason ALMA observations were carried out in the compact array configuration, achieving angular resolutions typically of
 (Béthermin et al. 2020), which corresponds to physical scales of ∼5 − 7 kpc at this redshift. With CRISTAL, our goal was to spatially resolve our sources, achieving as close as possible to kiloparsec scale resolution.
 -
ALPINE observations were carried out in Time Division Mode (TDM), which implies a spectral resolution of 31.2 MHz. For a typical Band 7 representative frequency of 300 GHz, this corresponds to a velocity resolution of 31.2 km s−1. In contrast, CRISTAL observations were carried out in FDM, achieving a spectral resolution 8× higher.
In the next section (Sect. 5.2), we describe how we combined the ALPINE and CRISTAL data and address the differences in the spectral observing mode (TDM versus FDM).
5.2. Combination, calibration, and imaging
Data calibration and a combination of the different observations were performed using the CASA software (CASA Team 2022). Table C1 lists the IDs of the ALMA observing programs that were used to produce the CRISTAL data products.
We processed the datasets from the different programs using the corresponding pipeline versions: 5.6.1 for the ALPINE program, 5.6.1 for the CRISTAL pilot program, and finally, version 6.5.2 for the CRISTAL program. No extra manual flagging was needed beyond what was already identified by the observatory and automatically flagged by each pipeline. We combined the calibrated datasets into a single measurement set (ms) used to create the images and data cubes, using the task concat. This task and the following procedure are performed using version 6.5.2 of CASA software. For the concatenation process, we opted for the default values for the frequency (freqtol) and direction (dirtol) tolerances. This decision was deliberate, as it ensures that all individual field and spectral windows (SPWs) are kept separately in the concatenated ms. This approach effectively handles any combination of the observations by tclean, not concat.
During the whole process of image and data cube creation, we used clean and the auto-multithresh algorithm. This mode automatically masks regions based on the signal-to-noise of the emission in the image. The creation of these regions is determined by the following parameters: Sidelobethreshold = 2, Noisethreshold = 4.5, Lownoisethreshold = 2, and Minbeamfrac = 0.0. This value choice is intended to match similar results when using manual cleaning. In all cases, the cleaning was performed down to 1σ by selecting nsigma = 1, where σ is estimated automatically by tclean using robust statistics (σ = 1.4826 × MAD with MAD being the median absolute deviation). The critical parameter is Noisethreshold = 4.5, which puts cleaning regions around pixels with signal-to-noise higher than 4.5. This value works well for continuum images, where the combination of the synthesized beam and image size results in 4.5 being a reasonable limit for significant positive emission. We kept the same value for the cubes, even where noise peaks above 4.5 are more common than in the multifrequency synthesis (mfs) images. We checked that the number of 4.5 noise peaks in the cubes was low and that the background noise distribution did not change by cleaning them.
The first step in creating the data cubes and continuum maps was to make an initial mfs using natural weighting and a uv-taper to 1 arcsec to identify the presence of detections manually. Then, we created data cubes using natural weighting and a channel width of 40 km s−1 for each of the sidebands. These cubes are used to identify the frequency ranges where the [C II] line is detected and define the spectral range to avoid when creating the continuum images. Pure continuum images were then created by avoiding the frequency ranges where the line was identified. In the case of continuum emission detected at the position of the central CRISTAL galaxy, we then subtracted the continuum using uvcontsub and fitorder = 0.
From the ms file with the continuum subtracted, we created data cubes with different spectral resolutions. First, we measured the full width at half maximum (FWHM) in the same cube where the frequency range for the [C II] detection was selected. Subsequently, we generated spectral cubes with resolutions of FWHM/5, 20 km s−1, and 10 km s−1. All these cubes cover a velocity range from −1000 km s−1 to +1000 km s−1, relative to the reference frequency of the [C II] emission as defined by the source in the ALPINE catalog (Le Fèvre et al. 2020). The cubes were created using three different weighting schemes: (i) natural weighting, (ii) Briggs weighting with robust = 0.5, and (iii) natural weighting combined with a uv-taper of 1″.
The final step was to inspect the synthesized beams for the continuum and cubes created with Natural and Briggs weighting and retrieve their BMAJ value ranges. We then selected the maximum value of BMAJ in those products and used it to circularize the beams for the continuum and spectral cubes. We used the same parameters for creating the continuum and [C II] cubes as stated above, but now we are setting the restoringbeam parameter into a circular beam of size with the maximum value of BMAJ. These cubes should be a good reference for comparing the properties of the continuum and [C II] emission in beam-by-beam or pixel-to-pixel basis.
One final note on the ALMA-CRISTAL data reduction is that the products presented here are not corrected for the “JvM effect” (Jorsater & van Moorsel 1995; Czekala et al. 2021). However, the impact of this effect is expected to be minimal because the data were cleaned deeply, using nsigma = 1. The “JvM effect” occurs in datasets combining multiple array configurations of an interferometer, where the tclean algorithm produces final images that mix dirty and clean beam units. A detailed analysis of the JvM correction for the individual source CRISTAL-05 is provided in Posses et al. (2025), while a broader assessment of its impact on the full CRISTAL sample will be presented in González-López et al. (in prep.).
5.3. Moment maps
We generated moment maps for integrated intensity, intensity-weighted velocity, and velocity dispersion (moments 0, 1, and 2). The maps were produced in Python, with two versions created. In the first version we integrated the line emission over a frequency range defined by the full width at tenth maximum (FWTM). We refer to the resulting moment maps as the “FWTM-mask” moment maps. The second version involved applying a blanking mask to suppress noise that could otherwise dominate faint line emission. Starting from the naturally weighted cube binned in 20 km s−1 channels, we convolved with a σ = 100 km s−1 Gaussian kernel along the velocity axis, and a σ = 10 pix – 2D Gaussian kernel in the spatial axes (the pixel size in arcseconds depends on the beam size of the cube, and it was determined using the CASA extension tool pickCellSize with npix = 7). We then measured the root mean square (rms) in the signal-free regions of the convolved cube. Finally, we split cells above and below a 2 × rms threshold into a 3D mask, which we then fed to casa task immoments to obtain the intensity, velocity, and velocity dispersion maps from the original cube. We refer to the resulting moment maps as the “dilated-mask” moment maps.
The dilated-mask maps are particularly valuable for identifying systems within the [C II] cubes that exhibit line emission outside the frequency range used to generate the FWTM moment maps of the main CRISTAL targets. They are also effective in detecting companion systems with a central frequency within the FWTM frequency range but with significantly narrower [C II] line profiles. This is the case for example of the detection of CRISTAL-01c, located approximately 32 kpc away from CRISTAL-01a, which we confirmed as a real detection after identifying its stellar counterpart in NIRCam imaging of the field. A full analysis of the detection of serendipitous sources in the [C II] cubes of the CRISTAL fields will be presented in van Leeuwen et al. (in prep.). Another demonstration of the utility of the dilated-mask approach is the detection of extended emission around CRISTAL galaxies where the gas traced by the [C II] line emission extends beyond the stellar light traced by JWST and HST images, such as the case of CRISTAL-09 or CRISTAL-13 (see Sect. 7.3).
5.4. Achieved beam sizes and sensitivities
The achieved synthesized beam sizes for the Natural- and Briggs-weighted [C II] cubes are listed in Table B.1. For the natural weighting, the median size of the minor axis is 0 43 (ranging from 0
 11 to 0
 68) and for the major axis is 0
 53 (ranging from 0
 12 to 0
 82). For the Briggs weighting, the median size of the minor axis is 0
 26 (ranging from 0
 08 to 0
 44) and for the major axis is 0
 30 (ranging from 0
 08 to 0
 54). The second panel of Fig. 3 displays the distribution of beam sizes (calculated as the geometric average between the minor (BMIN) and major (BMAJ) beam axis size) for the Briggs weighting applied to the CRISTAL galaxies.
To illustrate the improvement in angular resolution achieved by CRISTAL relative to ALPINE, Fig. 4 shows the [C II] integrated (top) and velocity field (bottom) maps of CRISTAL-05 (vuds_cosmos_5100822662, HZ3). From left to right, we show the ALPINE and the CRISTAL data using Natural and Briggs weighting. The increase in the angular resolution going from the ALPINE (∼1″, ∼6 kpc) to the CRISTAL ( , ∼1.2 kpc) observations reveal that this system is not a single source, but in fact an interacting system with at least two major components, plus extended emission for about ∼10 kpc in the north-east direction. The kinematics go from what could be considered a smooth velocity gradient in the ALPINE data, to complex, disturbed kinematics consistent with a multicomponent system. A detailed morpho-kinematic analysis of this source is presented in Posses et al. (2025).
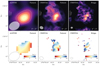 |
Fig. 4. Comparison between the ALPINE and CRISTAL [C II] observations of the CRISTAL-05 galaxy at z = 5.5 (Posses et al. 2025). Top: [C II] integrated intensity map based on the ALPINE Natural weighting observations (left), and the CRISTAL higher-angular observations using the Natural (without applying a uv-taper; center) and Briggs (right) weighting. Bottom: Similar to the top panels, but this time showing the [C II] velocity field. |
Table B.1 also list the noise measured in the [C II] cubes in channels of 20 km s−1 width and the continuum maps. For the cubes, and for the Natural and Briggs weighting, the median noise levels are 0.15 mJy beam−1 and 0.18 mJy beam−1, respectively. For the continuum maps, the median noise levels are 10.3 μJy beam−1 and 11.2 μJy beam−1 for the Natural and Briggs weighting, respectively. The third and fourth panels of Fig. 3 show the distribution of noise measured in the Natural cubes (20 km s−1 channels) and continuum images, respectively3.
5.5. Comparison to other surveys of [C II] 158 μm line emission in normal, star-forming galaxies
To contextualize the contribution of the CRISTAL survey to the study of normal, main-sequence galaxies, Fig. 5 summarizes [C II] 158 μm line surveys of star-forming galaxies at different cosmic epochs. At z ∼ 0, we include the Herschel Space Observatory PACS (Pilbratt et al. 2010; Poglitsch et al. 2010) KINGFISH (Kennicutt et al. 2011) and SHINING (Graciá-Carpio et al. 2011; Herrera-Camus et al. 2018a,b) surveys. For consistency, we exclude galaxies that significantly deviate from the main sequence, such as elliptical galaxies, dwarf systems, and luminous infrared galaxies. At z ∼ 2, we include the sample of six main-sequence star-forming galaxies studied by Zanella et al. (2018). At 4 ≲ z ≲ 6, we include the ALPINE and CRISTAL surveys. For reference, at 6 ≲ z ≲ 8, we include the REBELS survey (Bouwens et al. 2022) as the closest match at higher redshift to the ALPINE and CRISTAL surveys.
Figure 5 illustrates the physical resolution achieved by each survey (y axis). The circles are centered at the average resolution, while the gray boxes indicate the range covered by each survey. The circle size represents the number of galaxies detected in [C II] 158 μm line emission, and the color scale indicates the sensitivity of each survey (measured in 200 km s−1 channels), excluding the Herschel-based surveys. While sensitivity measurements for the KINGFISH and SHINING surveys are unavailable, the lower end of [C II] surface brightness for KINGFISH regions, around ∼105 L⊙ kpc−2 (e.g., Herrera-Camus et al. 2015), is comparable to the sensitivity achieved by the CRISTAL survey.
 |
Fig. 5. [C II] 158 μm line surveys of typical or main-sequence star-forming galaxies as a function of redshift. The surveys included are: Herschel Space Observatory-based KINGFISH (Kennicutt et al. 2011) and SHINING (Graciá-Carpio et al. 2011; Herrera-Camus et al. 2018a,b), as well as ALMA-based ALPINE (Le Fèvre et al. 2020; Béthermin et al. 2020; Faisst et al. 2020a), REBELS (Bouwens et al. 2022), and CRISTAL (Zanella et al. 2018). The circles represent the average redshift and physical angular resolution (in kiloparsecs) achieved by each survey. The circle sizes indicate the number of galaxies detected in [C II] line emission in these surveys (also listed inside each circle). The gray boxes indicate the full range of redshift and angular resolution covered by each survey. The color bar illustrates the sensitivity achieved in 200 km s−1 channels, except for the Herschel-based surveys. |
Building on the pioneering work of surveys such as ALPINE and REBELS, the CRISTAL survey extends the study of star-forming galaxies to kiloparsec scales for a significant sample when the Universe was ∼1 Gyr old. Notably, CRISTAL galaxies also have rest-frame UV and optical observations (see Sect. 6), providing a comprehensive view of the gas, dust, and stars in early galaxies. This approach parallels the detailed understanding of nearby galaxies achieved over the past decade through a combination of Herschel/PACS observations, ground-based optical data, and GALEX UV imaging.
6. Ancillary data
Most of the CRISTAL galaxies are located in the COSMOS field (Scoville et al. 2007; Weaver et al. 2022), which implies that there is a wealth of optical and near-infrared data available (e.g., Faisst et al. 2020a). Figure 8 shows the position in the sky of the CRISTAL galaxies and the JWST and HST footprints pointings from large surveys such as COSMOS-Web (PID 1727; co-PIs: Kartaltepe & Casey; Casey et al. 2023), PRIMER (PI: Dunlop, PID 1837), COSMOS-CANDELS (Grogin et al. 2011), COSMOS-DASH (Mowla et al. 2019), and 3D-HST (Brammer et al. 2012). Table D1 summarizes the HST/WFC3 and the JWST Near Infrared Camera (NIRCam; Rieke et al. 2023) data available for each CRISTAL source. In this section, we describe how we reduced and processed the HST and JWST data.
6.1. HST
We employed the grizli pipeline (Brammer 2023) to retrieve and process archival HST Advanced Camera for Surveys (ACS) and HST/WFC3 data for all selected targets. The pipeline automatically retrieves, calibrates, and resamples the individual raw exposures that overlap with the target coordinates for each filter. The calibrated frames were then precisely aligned using several astrometric reference catalogs, including the DESI Legacy Imaging Survey DR9, PANSTARRS (PS1), and Gaia, leading to an uncertainty of about 0 1. Finally, the aligned frames were combined into the final mosaics.
6.2. JWST/NIRCam
The extensive JWST/NIRCam data available for the CRISTAL galaxies enable us to probe the rest-frame optical light, complementing the HST data, which is limited to the rest-frame UV and sensitive to dust obscuration. Of the 25 main systems in our sample, 19 have been observed with NIRCam, with the longest wavelength covered by the F444W filter, as part of several programs: PRIMER (PI: Dunlop, PID 1837), COSMOS-Web (PID 1727; co-PIs: Kartaltepe & Casey; Casey et al. 2023), GOODS-S (PID 1286, PI Eisenstein), and various GO programs (PIDs 3215, 2198, 3990).
For the CRISTAL galaxies in the PRIMER-COSMOS field, we used the data products from the Dawn JWST Archive (DJA) Mosaic release v7 (Heintz et al. 2025), which used the grizli pipeline (Brammer 2023). For the rest of the CRISTAL systems, we processed the data using a modified version of the official JWST pipeline (version 1.10.0, pmap 1075). The processing followed the methods outlined in Bagley et al. (2023) to remove wisps, snowballs, and 1/f noise, applying flat field corrections and wisp templates from the NIRCam team. We also removed stripes using de-striping techniques aligned with the diffraction spikes of the PSF, specifically addressing tilted stripes affecting PRIMER data. We then applied constant background subtraction following prescription from Bagley et al. (2023). The final mosaic was drizzled to a pixel scale of  with the default square kernel and pixel fraction of 1.0. For the astrometry, we first use the 3D-HST catalog and align it to Gaia DR3, then use the astrometry-corrected 3D-HST catalog as the absolute reference catalog for the JWST pipeline, so that the final mosaic has an astrometry corrected.
7. Results
7.1. Line widths and fluxes
Figure 6 shows the [C II] line spectra extracted for all CRISTAL galaxies, plus the two sub-millimeter galaxies J1000+0234 and CRLE located in CRISTAL fields (see Table A.1 for details). The global [C II] spectra of all CRISTAL galaxies can be well fitted by a single Gaussian component, except four: CRISTAL-02, -04, -06 and -22. For CRISTAL-02, there is evidence that the need for a broad, second Gaussian component could be associated with widespread outflow activity. This is discussed in detail in Davies et al. (2025). For CRISTAL-04, -06 and -22, the most likely explanation for the need of a second Gaussian component is the interacting nature of these systems. This is discussed in more detailed in the kinematic analysis of the CRISTAL galaxies presented in Lee et al. (2025).
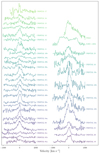 |
Fig. 6. [C II] 158 μm line spectra for all the star-forming galaxies in the CRISTAL sample listed in Table A.1, except for CRISTAL-18 which is undetected. [C II] line intensities are arbitrary. |
Based on a single Gaussian fit, we measure the FWHM of the [C II] line. The results can be found in Table 1. The line widths range from ∼250–350 km s−1, for the most massive systems, to ∼120 km s−1 for the small companions detected around some of the main CRISTAL systems (e.g., CRISTAL-01c, CRISTAL-04b).
CRISTAL line widths and fluxes.
To measure the [C II] and continuum fluxes, we used the Natural-weighted integrated intensity maps (see Sect. 5.3) and three different methods.
-
Aperture photometry: With the astropy photutils package, we used circular apertures of increasing size to measure the integrated flux and construct a flux curve-of-growth. We identified the radius where the curve-of-growth flattens out or where an increase in flux due to the presence of a companion galaxy is detected. This radius was used to measure the total flux. This method can be useful to disentangle the emission from interacting systems, as the presence of a companion system can be identified by a second increase in the enclosed emission after the initial convergence of the flux curve.
-
Two-dimensional Gaussian fit: Using the CASA tool imfit, we measured the flux fitting a two-dimensional elliptical Gaussian choosing a fitting box with a variable size depending on the source size. For interacting systems, we defined the fitting box to minimize any additional flux contribution from the companion galaxy. The error in the flux measurement was calculated following the formalism described by Condon (1997).
-
Flux above a S/N threshold: We measured the flux by integrating the emission above a specified S/N threshold, analogous to the isophotal magnitude method used in optical astronomy. This technique can be particularly useful for measuring flux in sources with complex structures. However, it encounters difficulties in the presence of interacting systems, especially when galaxies are connected by diffuse emission. To address this, we restricted our flux measurements to the area within the fitting box defined for the two-dimensional Gaussian fit method. For our measurements, we used a S/N threshold of 2σ on the integrated map.
The [C II] and continuum flux measurements obtained using the three methods are consistent within 10%, with the exception of CRISTAL-04b, -07a, -07b, and -09b. In these cases, the flux measured using the S/N threshold method is approximately 20% higher than the flux obtained from the other methods. This discrepancy is expected, as these four galaxies are part of interacting systems connected by diffuse emission.
Table 1 lists the [C II] and dust continuum fluxes for the CRISTAL galaxies based on the aperture photometry method. The CRISTAL fluxes are consistent with those measured from the low-angular resolution ALPINE data reported by Béthermin et al. (2020), with discrepancies within ∼15%, as illustrated in Fig. 7. The exceptions are four galaxies where we observe differences of around 50%. In these cases, however, the integrated [C II] line emission was detected with S/N ≲5 in the ALPINE data, which could be the cause for the discrepancy.
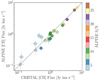 |
Fig. 7. [C II] integrated flux measured from the CRISTAL and ALPINE data. The colorscale represents the S/N of the integrated line detection in the ALPINE data (Béthermin et al. 2020). In general there is good agreement between the CRISTAL and ALPINE fluxes, except for four systems that were detected with S/N ≲5 in the ALPINE data. |
The [C II] and continuum fluxes in Table 1 agree on average within a ∼10% and ∼20% with the fluxes measured in Ikeda et al. (2025) and Mitsuhashi et al. (2024). The latter fluxes were measured directly in the visibility plane, making them independent of imaging parameter choices.
7.2. CRISTAL family portrait
Figure 9 shows the integrated [C II] 158 μm line emission maps for all CRISTAL galaxies, providing a comprehensive view of the gas distribution across the sample. Complementing this, Fig. 10 displays composite JWST/NIRCam images of the same galaxies, overlaid with contours of [C II] line and dust continuum emission. To ensure consistent comparison, all maps are scaled to the same physical size.
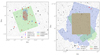 |
Fig. 8. Position in the sky of the CRISTAL galaxies including the JWST pointings footprints from programs COSMOS-Web, PRIMER, JADES, and FRESCO, and HST pointings footprints from programs COSMOS-DASH, CANDELS, and 3D-HST. CRISTAL galaxies from the original sample, pilot programs, and extracted from the ALMA archive are shown as red circles, blue squares, and magenta diamonds, respectively. SMGs in the field of CRISTAL galaxies are shown as orange triangles. CRISTAL galaxies that are not part of large HST surveys are covered by individual HST programs. |
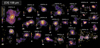 |
Fig. 9. [C II] integrated line emission maps for the CRISTAL galaxies, constructed from the naturally weighted cubes. All maps have been scaled to the same physical size, indicated by a white line on the left side representing 6 kpc. The colorscale represents the integrated flux emission, and the contours correspond to [3, 4, 5, 7, 9, 11, 13, 15]σ, except for CRISTAL-01, where the emission intensity is shown in logarithmic scale and the contours represent the [4, 6, 8, 10, 50, 150]σ levels (the last two in red). The beam is shown in the lower left corner of each panel. |
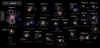 |
Fig. 10. JWST composite images of CRISTAL galaxies, overlaid with [C II] line emission (white contours) and dust continuum emission (pink contours). Contour levels correspond to [3, 5, 10]σ, except for CRISTAL-01, where the emission intensity is shown on a logarithmic scale, and contours represent [4, 6, 8, 20, 60, 100]σ levels. All maps are scaled to the same physical size, with a 6 kpc scale bar shown as a white line on the left side of each panel. For galaxies CRISTAL-10, -20, -22, and -23 we show the HST composite images as there are no JWST/NIRCam observations available. |
These visualizations highlight the diversity in sizes, morphologies, and structural features among CRISTAL galaxies, offering valuable insights into their assembly histories and evolutionary pathways during the first ∼1 Gyr of the Universe. A significant number exhibit evidence of morphological disturbances, likely driven by dynamic processes in their environments. For example, systems such as CRISTAL-02, -03, -09, -12, and -13 feature extended emission structures reminiscent of tidal tails, suggesting interactions with minor companions. Meanwhile, galaxies such as CRISTAL-01, -04, -06, and -07 appear to be undergoing merger events, with their morphologies indicating complex dynamical states. The properties of individual CRISTAL systems are discussed in detail in the following section.
7.3. Multiwavelength view of individual CRISTAL galaxies
One of the advantages of the CRISTAL survey is the availability of multiwavelength data for a large fraction of the systems. This includes observations of the rest-frame UV and optical stellar light with HST/WFC3 and JWST/NIRCam, as well as more recent observations of the ionized gas with JWST/NIRSpec IFU (e.g., PID 1217, 3073, 4265, 5974). Figures 11 to E.4 show, for each system detected in the CRISTAL survey at z ≈ 4 − 6, a series of panels that include the integrated [C II] line emission, the [C II]-based velocity field, the dust continuum, and the [C II] line and dust continuum emission overlaid on composites images of the stellar light derived from HST/WFC3 and JWST/NIRCam observations. Based on this multiwavelength view of the CRISTAL galaxies, we provide a brief description of their main characteristics:
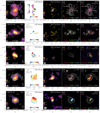 |
Fig. 11. Multiwavelength view of the CRISTAL galaxies including from left to right: integrated [C II] line emission, [C II]-based velocity field, dust continuum emission, [C II] and dust continuum emission overlaid on a composite image based on HST/WFC3 and JWST/NIRCam observations. The redshift, stellar mass, and SFR are listed in the top left corner of the second panel. S/N contours correspond to 3, 4, and 5σ and then increase in steps of 2σ, except for CRISTAL-01, where the emission intensity is shown in logarithmic scale and the contours represent the [4, 6, 8, 10, 50, 150]σ levels (the last two in red). Additional figures showing the multiwavelength view of the remaining CRISTAL galaxies are included in Appendix E. |
CRISTAL-01 (DC-842313): This galaxy is among the most massive in the CRISTAL survey. While initial stellar mass estimates from ALPINE suggested M⋆ = 1010.84 M⊙ (Faisst et al. 2020a), updated photometry by Mitsuhashi et al. (2024) revised this to M⋆ = 1010.65 M⊙. CRISTAL-01a is undergoing a major interaction with its companion, the SMG J1000+0234 (Fraternali et al. 2021), and this explains its very disturbed morphology. Despite its significant mass, CRISTAL-01a was not detected in dust continuum emission.
The depth of the [C II] map from the combination of the CRISTAL and the ancillary data reveals, for the first time in this system, an elongated structure (or plume) of [C II] line emission connected to the SMG and extending north for about a projected distance of ∼15 kpc. The origin of this extended component is discussed in detail in Solimano et al. (2024), who consider four potential scenarios: a conical outflow, a cold accretion stream, ram pressure stripping, and gravitational interactions. New JWST/NIRSpec observations presented in detail in Solimano et al. (2025) reveal a compact component at the base of the [C II] plume exhibiting broad [OIII] line emission, consistent with the presence of an ionized outflow. The source of this broad line emission could be a compact AGN or represent the escape path for an outflow from the center of SMG J1000+0234.
CRISTAL-01 resides in a protocluster environment, where multiple Lyα emitters and Lyman-break galaxies have been detected in its vicinity (Jiménez-Andrade et al. 2023). In our ALMA-CRISTAL observations, we identify two additional [C II] line emitters, CRISTAL-01b and CRISTAL-01c, at similar redshifts (|Δz|≲0.02) and located approximately ∼7″ (∼45 kpc) and ∼5″ (∼32 kpc) from the CRISTAL-01a/J1000+0234 interacting pair, respectively. While CRISTAL-01c is not visible in the HST data, it is detected in the JWST/NIRCam imaging.
CRISTAL-02 (DC-848185, HZ6, LBG-1): This galaxy is located in the field of the galaxy protocluster associated with the SMG AzTEC-3 at z = 5.3, at a projected distance of ∼15″. CRISTAL-02 was first detected in [C II] line emission by Riechers et al. (2014), and then re-observed under the name HZ6 by Capak et al. (2015), detecting for the first time the dust continuum emission. The connection between the [C II] line emission and the distribution of the neutral gas as traced by the Lyα line emission is discussed in Guaita et al. (2022).
The rest-frame UV and optical stellar emission in this galaxy is dominated by four stellar clumps of approximately kiloparsec size ( ), three in the central part of the galaxy and one in the north. The dust continuum emission is strong and peaks in the central region, coincident with the three central stellar clumps. The [C II] line emission traces the gas in the extended disk and shows interesting asymmetries perpendicular to the major morphological axis: a lump of emission extending from the center to the east, and a tail of [C II] emission to the west extending for about ∼10 kpc. The [C II] line profile in CRISTAL-02 is best modeled by a double Gaussian fit including a broad and a narrow component (see Fig. 6). The interpretation of the broad component as an outflow is discussed in detail in Davies et al. (2025).
CRISTAL-03 (DEIMOS_COSMOS_536534, HZ1): This system shows rest-frame UV and stellar light emission that is extended approximately in the same direction as the [C II] kinematic axis. Similar to CRISTAL-02, there is a tail of [C II] line emission extending in the north-east direction for about ∼10 kpc. The dust continuum peaks in two locations: at the center, where reddened optical emission is observed in the NIRCam data, and to the north of the center, at the base of the [C II] tail, where no stellar light counterpart is detected.
CRISTAL-04 (vuds_cosmos_5100822662): This system is experiencing a merger event with a stellar mass ratio between CRISTAL-04a and CRISTAL-04b of approximately 17:1. Both galaxies are detected in the rest-frame UV, optical, [C II] line, and dust continuum emission (although the dust continuum detection in CRISTAL-04b is marginal). It is important to note that the spatial distribution of the [C II] line emission is very extended (∼30 kpc long), disturbed, and connects the two galaxies (Ikeda et al. 2025). This is expected from a tracer of the cold neutral gas, and resembles the perturbed and extended atomic HI emission observed in merging systems in the nearby Universe (e.g., Hibbard & van Gorkom 1996).
CRISTAL-05 (DEIMOS_COSMOS_683613, HZ3): This galaxy, also shown in Fig. 4 and analyzed in detail by Posses et al. (2025), exhibits a complex structure. It comprises a close pair of interacting galaxies surrounded by an extended gas component traced by [C II] line emission. As is described by Posses et al. (2025), this component extends to about four times the size of the star-forming disk traced by the rest-frame UV emission, and accounts for about 40% of the total [C II] emission. The L[CII]/LFIR ratio upper-limits in this extended component are consistent with values found in shocked regions of nearby merging systems (e.g., Appleton et al. 2013; Peterson et al. 2018).
CRISTAL-06 (vuds_cosmos_5100541407): Similar to CRISTAL-04, this system represents a major merger involving at least two galaxies, CRISTAL-06a and CRISTAL-06b, with a stellar mass ratio of 8:1. Both galaxies are detected in rest-frame UV and optical emission and are connected by a disturbed, extended gas component traced by the [C II] line emission.
A closer inspection of CRISTAL-06a reveals two distinct components: one to the west, faint in rest-frame UV and optical data but bright in dust continuum and [C II] line emission; and one to the east, bright in rest-frame UV and optical emission but less prominent in dust continuum and [C II] line emission. Notably, CRISTAL-06a is the only system in the CRISTAL survey classified as “multiple-[C II]” by Ikeda et al. (2025), indicating the presence of multiple [C II] line emission peaks associated with a single UV component. The kinematic analysis of CRISTAL-06a suggests two systems counter-rotating, implying that CRISTAL-06a itself may represent an advanced-stage merger of two galaxies.
CRISTAL-07 (DEIMOS_COSMOS_873321, HZ8): This system is composed of two galaxies, CRISTAL-07a and CRISTAL-07b, likely in an advanced stage of a major merger (1.5:1), separated by a projected distance of approximately ∼9 kpc. This was already hinted by the low-angular resolution [C II] observations analyzed in Capak et al. (2015). CRISTAL-07a and CRISTAL-07b have comparable [C II] luminosities, although only CRISTAL-07a is detected in the dust continuum. Additionally, another system of galaxies, CRISTAL-07c and CRISTAL-07d, is detected about ∼75 kpc west of CRISTAL-07ab. CRISTAL-07c is more massive and brighter in [C II] line emission than CRISTAL-07a and CRISTAL-07b, and it shows disturbed, extended emission to the south, which is connected to a smaller companion in size, CRISTAL-07d, located at a projected distance of approximately ∼15 kpc. CRISTAL-07d is nearly as bright in [C II] line emission as CRISTAL-07c, but has a wider line profile (FWHM[CII] = 375 ± 73 km s−1).
CRISTAL-08 (vuds_efdcs_530029038): The rest-frame UV and optical emission from HST and JWST reveal at least eight kiloparsec-sized stellar clumps with a range of colors. SED modeling of these clumps following the same method as Li et al. (2024) indicates stellar masses ranging from ∼2 − 8 × 10⁸ M⊙ and ages between ∼70 − 200 Myr (Herrera-Camus et al. in prep.). The [C II] line emission is extended and the peaks is offset from the stellar clumps, with prominent regions in the northwest and southwest. In contrast, the [C II] line emission is faintest in the east, where the largest concentration of stellar clumps is located. The dust continuum peaks near the [C II] line emission maximum in the northwest.
Despite its clumpy structure, CRISTAL-08 exhibits evidence of smooth, ordered rotation (see Lee et al. 2025, for a detailed kinematic analysis). This behavior is reminiscent of main-sequence star-forming galaxies at cosmic noon, where regular rotating disks are observed in ≈70–80% of cases, even when stellar light reveals significant clumpiness (e.g., Wisnioski et al. 2015; Förster Schreiber & Wuyts 2020).
Notably, there is evidence of outflows traced by the [C II] line emission, potentially emerging from some of the giant star-forming clumps. The outflow velocities are consistent with those observed in other CRISTAL systems (e.g., Herrera-Camus et al. 2021; Davies et al. 2025; Birkin et al. 2025). These outflows, along with their properties, will be analyzed in detail in Herrera-Camus et al. (in prep.).
CRISTAL-09 (DEIMOS_COSMOS_519281): This galaxy exemplifies how ALMA [C II] observations can provide a complementary and more revealing view of the complexity of z ≈ 4 − 6 galaxies compared to HST and JWST observations. The rest-frame UV and optical emission of CRISTAL-09a is compact (Reff ≈ 0.7 kpc) relative to the [C II] line emission that extends for about ∼12 kpc to the west and connect CRISTAL-09a with a potential minor companion, CRISTAL-09b (Ikeda et al. 2025). Notably, CRISTAL-09b has no counterpart in HST or JWST observations.
CRISTAL-10 (DEIMOS_COSMOS_417567, HZ2): This system is particularly intriguing due to the complexity of its gas, dust, and stellar morphology. The stellar emission reveals three clumps, with the brightest located to the west. The cold neutral gas, traced by the [C II] line emission, covers all three clumps but peaks at the central stellar clump. Interestingly, the stellar and [C II] emissions form a semi-ring around the dust continuum emission, which is detected in an offset position. This complex morphology and the implications of the observed L[CII]/LFIR ratio are discussed in more detail in Fig. 12 and Sect. 8.1.
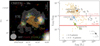 |
Fig. 12. Left: Multiwavelength view of CRISTAL-10, a main-sequence star-forming galaxy at z = 5.67. The background image is a composite of three HST/WFC3 filters, highlighting the rest-frame UV stellar light emitted by young, massive stars. Overlaid on this image are white contours showing the integrated [C II] line emission (3, 4, 5, 7 and 10σ levels), and orange contours showing the dust continuum emission at rest-frame 158 μm (2.5, 3, 4 and 5σ levels). The dust continuum reveals two distinct peaks, designated as Region 1 and Region 2. In Region 1, the dust continuum emission lacks a corresponding rest-frame UV light counterpart, and the [C II] line emission is faint. Region 2, on the other hand, correspond to a star-forming region where the rest-frame UV, dust, and [C II] line emission peak. Right: [C II]/FIR luminosity ratio as a function of the FIR luminosity observed in nearby star-forming galaxies and starbursts (beige points; Lutz et al. 2016; Herrera-Camus et al. 2018b) and high-z star-forming galaxies (gray points; Spilker et al. 2016, and references therein). The [C II]/FIR luminosity ratio measured in the star-forming Region 2 (light blue circle) is comparable to that measured in the dense PDR of the Orion complex, while the [C II]/FIR luminosity ratio of Region 1 (yellow) is significantly low, comparable only to extreme local systems such as Arp 220 (e.g., Luhman et al. 1998, 2003), characterized by deeply embedded star formation. The FIR luminosities where measured based on the Band 7 continuum using the conversion factor by Béthermin et al. (2020) and assuming a dust temperature of 50 K. The diagonal line represents how much the measurements of Regions 1 and 2 change if we assume a dust temperature of 40 K and 60 K. We also show the global value (orange circle) measured using the LFIR in Mitsuhashi et al. (2024) and the integrated [C II] flux from Table 1. |
We detect an additional galaxy in the field, designated CRISTAL-10b, located at a projected distance of approximately ∼47 kpc to the northeast of CRISTAL-10a. The [C II] morphology of this system is highly disturbed, with no corresponding rest-frame UV or optical emission detected.
CRISTAL-11 (DEIMOS_COSMOS_630594): Similar to CRISTAL-09, the rest-frame and optical emission in this galaxy is compact (Reff ≈ 0.8 kpc) relative to the extent of the [C II] line emission. The [C II] line emission extends significantly to the east, forming a tail with a disturbed morphology that stretches for a projected distance of approximately ∼36 kpc. There is no corresponding stellar light emission detected in the HST or JWST data for this extended component (Ikeda et al. 2025). The dust continuum is detected at the 3σ level, peaking in the northern part of the stellar distribution. Lines et al. (2025) model the SED of CRISTAL-11 based on NIRCam observations from the PRIMER survey. They find that the northern region shows higher dust attenuation and an older stellar population (≈200 Myr) compared to the southern region, which exhibits minimal dust attenuation and a young stellar population (≈10 Myr).
CRISTAL-12 (CANDELS_GOODSS_21): Similar to CRISTAL-01a, the updated SED modeling by Mitsuhashi et al. (2024) scaled down the stellar mass and SFR of this system by a factor of ∼3 relative to the values reported by the ALPINE survey (Faisst et al. 2020a), although the two values remain consistent within a 1σ uncertainty. This difference could be due to the use of updated fluxes from the ASTRODEEP-GS43 catalog (Merlin et al. 2021) in Mitsuhashi et al. (2024). CRISTAL-12 is detected in rest-frame UV emission, and the [C II] line emission peaks at the position of the stellar light, and then extends to the west. There is a hint of [C II] line extended emission toward the northwest, resembling the tails of [C II] line emission observed in other CRISTAL systems (e.g., CRISTAL-09, -11).
CRISTAL-13 (vuds_cosmos_5100994794): This galaxy exhibits a complex structure, with rest-frame UV and optical stellar emission revealing a main component to the east and a tail of stellar emission extending approximately ∼10 kpc to the northwest. Lines et al. (2025) use the NIRCam data from the PRIMER survey to model the SED and find that this extended tail is composed of at least five stellar clumps with high specific SFR (sSFR ≈ 10−8 yr−1), young age (tage ≈ 50 Myr), and blue rest-frame UV slope (βUV ≈ −2.25). The stellar mass of the system is dominated by the stellar component on the east, which has an age of ≈100 Myr. This complex system is discussed in more detail in Sect. 8.2 and Fig. 13.
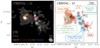 |
Fig. 13. Left: Composite image based on three JWST/NIRCam blue filters (F090W, F115W, F150W) that show the stellar light from multiple young stellar clumps in CRISTAL-13, a main-sequence star-forming galaxy at z = 4.58. Overlaid are the integrated [C II] line emission (white contours; ) and the dust continuum (orange; ). The ALMA beam is shown in the lower right corner. Right: Cartoon representation of the distribution of the stellar clumps traced by JWST (blue and green), the cold gas traced by the [C II] line (red), and the dust continuum (orange). The properties of the stellar clumps are based on the SED modeling presented in Lines et al. (2025). |
CRISTAL-14 (DEIMOS_COSMOS_709575): This galaxy has one of the smallest rest-frame UV sizes in the CRISTAL sample, and therefore our planned ALMA observations aimed to have a higher angular resolution than the average of the other CRISTAL targets to spatially resolve the source. The resulting beam size, for natural weighting, was  , corresponding to a physical scale of approximately ≈700 pc at the redshift of the source. The [C II] line emission is more extended than the stellar component traced by NIRCam observations, with a hint of extended [C II] line emission toward the northwest, which our ALMA observations appear to tentatively detect.
CRISTAL-15 (vuds_cosmos_5101244930): The composite HST and JWST imaging reveal three main clumps of rest-frame UV and optical light emission. However, detailed analysis of the blue filters of JWST/NIRCam show that there are at least five separate star-forming clumps that are only a few million years old (Lines et al. 2025). The [C II] line emission is elongated and connect these three clumps displaying a well defined velocity gradient from northwest to southeast. Notably, the [C II] line emission also extends toward the northeast, resembling the tail-like [C II] line emission observed in other CRISTAL systems such as CRISTAL-02, CRISTAL-03, andCRISTAL-09.
CRISTAL-16 (CANDELS_GOODSS_38): This galaxy appears to have two distinct components. The first is the main component, which shows a clear counterpart in HST rest-frame UV emission and exhibits a velocity gradient oriented from north to south. Additionally, there is a tentative detection of dust continuum emission in this region. The second component, located to the west, initially seems to be an extension of the disk. However, its distinct kinematic properties suggest that it is, in fact, a minor companion. We refer to this system as CRISTAL-16b.
CRISTAL-17 (DEIMOS_COSMOS_742174): This system is only weakly detected in rest-frame UV emission with HST. The JWST NIRCam image from the PRIMER survey is also low signal-to-noise but it is still possible to identify two main stellar clumps and a faint tail of emission extending from the eastern component (Lines et al. 2025). The [C II] line emission is detected, but only with a S/N ≈4.
CRISTAL-18 (vuds_cosmos_5101288969): This system was selected to be included in the ALPINE survey based on spectroscopic data from the VIMOS Ultra-Deep Survey (Le Fèvre et al. 2015). The spectrum contained a single emission line, which, if identified as Ly-α, corresponds to a redshift of zLyα = 5.6982. Given the presence of only one line in the spectrum and the observed continuum, this redshift has an estimated probability of ∼80% to be correct (Le Fèvre et al. 2015). The ALPINE ALMA follow-up observations tentatively detected the [C II] line emission with a S/N ≈4 at a redshift z[CII] = 5.7209, differing by only |Δz| = 0.002 from the Lyα redshift.
As is described in Sect. 4, we placed two of the four spectral windows next to each other with a small overlap centered at the frequency of the line, based on the ALPINE [C II] line tentative detection. Despite a deep integration, we did not detect the [C II] line in any of the four spectral windows. If the Lyα detection is real and the ALPINE [C II] line detection spurious, this would imply a record velocity offset of the [C II] line relative to the Lyα line of ≳1000 km s−1 (e.g., Hashimoto et al. 2019; Baier-Soto et al. 2022).
At the sensitivity of our observations (S[CII],Nat = 0.1 mJy beam−1), and if we assume a line width of 250 km s−1, the 3σ upper limit for the integrated [C II] line flux is 0.03 Jy km s−1. This translates to a 3σ upper limit [C II] line luminosity of ≈106.7 L⊙.
CRISTAL-19 (DEIMOS_COSMOS_494763): The [C II] line and dust continuum emission in this system are significantly detected and are co-spatial with the rest-frame UV and optical emission. The velocity gradient observed in the [C II] line emission is also aligned with the major morphological axis of the stellar light. As is seen in other systems such as CRISTAL-09 and CRISTAL-10, CRISTAL-19 exhibits extended [C II] line emission to the south, spanning approximately 23 kpc.
This concludes the discussion of the 19 fields observed as part of the CRISTAL ALMA Large Program. The following six systems discussed here have been included in the final CRISTAL sample given that they fulfill all relevant sample criteria outlined in Sect. 3.
CRISTAL-20 (DEIMOS_COSMOS_494057, HZ4): This galaxy has been extensively discussed in Herrera-Camus et al. (2021, 2022). The [C II] line emission extends well beyond the star-forming disk as traced by the rest-frame UV emission and the dust continuum. There is also evidence of a neutral gas outflow traced by a broad component of the [C II] line emission that is aligned with the minor morphological and kinematic axis, similar to the case of nearby starbursts such as M 82 or NGC 253 (for a review see Veilleux et al. 2020). The kinematic analysis of the [C II] line emission suggest that CRISTAL-20 (or HZ4) has a regular rotating disk (Vrot/σ0 ≈ 2) with a high intrinsic velocity dispersion (σ0 ≈ 65 km s−1), but the analysis of JWST/NIRSpec data suggest that the galaxy is undergoing a merger (Parlanti et al. 2025).
CRISTAL-21 (HZ7): A detailed analysis of the [C II] line emission in this galaxy is presented in Lambert et al. (2023). The analysis reveals that the system exhibits a complex [C II] line morphology and kinematics, with the [C II] line emission being approximately twice as extended as the rest-frame UV emission. This evidence strongly suggests that the galaxy is an interacting system.
CRISTAL-22 (HZ10): This system is one of the brightest in the CRISTAL sample, exhibiting a broad [C II] line profile that requires fitting with a double Gaussian profile. The line widths of the two components are FWHM1 = 201 ± 24 km s−1 and FWHM2 = 590 ± 27 km s−1. The HST rest-frame UV emission shows two main young stellar components, with the one in the west significantly fainter. Both stellar components are detected in the dust continuum under the [C II] line, and analysis of new Band 9 observations reveal the rest-frame UV emission from the west component is strongly attenuated by the dust (Villanueva et al. 2024). The [C II] line emission connects the two components, and exhibit complex kinematics which will be discussed in detail in Telikova et al. (2025). The complex nature of the system has been confirmed by Jones et al. (2024) based NIRSpec IFU observations of the main nebular lines, which also discovered a minor companion to the east of the main stellar component. At about a projected distance of ∼77 kpc south of CRISTAL-22 (HZ10), our ALMA [C II] line and dust continuum observations also include in the field the starbursting galaxy CRLE (Pavesi et al. 2018), at a similar redshift to CRISTAL-22 (|Δz| = 0.014).
CRISTAL-23 (DEIMOS_COSMOS_818760): The [C II] line emission in this system has been extensively analyzed in Jones et al. (2021) and Devereaux et al. (2024). Their analysis concludes that the system comprises three components: two primary components involved in a major merger (stellar mass ratio almost 1:1; Mitsuhashi et al. 2024, see also Table A.1), and a third component located approximately ∼18 kpc to the west, likely representing an upcoming minor merger.
CRISTAL-24 (DEIMOS_COSMOS_873756): This galaxy is the brightest in [C II] line emission within the ALPINE survey, comparable in our sample only to CRISTAL-22. The integrated [C II] line emission reveals a complex structure, which Devereaux et al. (2024) attribute to the presence of multiple merging components or clumps of star formation within the system. The dust continuum peaks co-spatially with the [C II] in the main system but also extends toward the northwest, following the [C II] line emission. JWST/NIRCam observations reveal two peaks of stellar light, with the western peak being brighter. The dust continuum emission peaks offset from the stellar light peaks by approximately ∼1 kpc to the south. Additionally, a secondary 3σ dust continuum peak is detected at a projected distance of ∼10 kpc. There is no HST or JWST counterpart for this outer [C II] or dust continuum emission.
CRISTAL-25 (vuds_cosmos_5101218326): The [C II] line and dust continuum emission of this system are analyzed in detail in Devereaux et al. (2024). The integrated [C II] line emission shows two distinct peaks. The primary peak, located in the southwest, spatially coincides with the main dust continuum peak. Interestingly, in between the two [C II] peaks we observe a second and fainter dust continuum peak, spatially coincident with the bulk of the stellar light traced by the HST and JWST images.
8. Case studies: CRISTAL-10 and CRISTAL-13
The multiwavelength observations on kiloparsec scales available for the CRISTAL galaxies provide a unique opportunity to conduct comprehensive analyses of their gas, dust, and stellar properties. Previous studies have focused on individual CRISTAL sources, such as CRISTAL-01 (Solimano et al. 2024), CRISTAL-05 (Posses et al. 2025), and CRISTAL-22 (Villanueva et al. 2024), and in this section we present two additional cases where the CRISTAL data offer valuable insights into the ISM properties of high-redshift galaxies.
8.1. CRISTAL-10: Arp 220 conditions at z ≈ 5?
As was initially described in Sect. 7.3, CRISTAL-10a presents an intriguing case due to the spatial distribution of the dust continuum relative to the [C II] and stellar light emission. The left panel of Fig. 12 shows that there are three main stellar clumps detected in rest-frame UV emission (unfortunately there are no JWST/NIRCam observations available). The two primary clumps, located in the north and northwest, align with peaks in the [C II] line emission. Conversely, the bulk of the dust continuum emission is concentrated in a region offset to the south of the [C II] and stellar peaks, where the [C II] line emission is faint and the stellar light is undetected.
To investigate the nature of this dusty component of CRISTAL-10a, we measure the [C II]/FIR ratio placing two circular apertures of 0 5 (∼3 kpc) radius centered in regions where the dust continuum is detected. Region 1 is the region where the dust continuum is strong, the [C II] line emission is faint, and there is no detectable rest-frame UV light. In contrast, Region 2 is the star-forming region where the [C II], dust, and stellar light emission are spatially coincident. Assuming a dust temperature of Tdust = 50 K (following Tdust measured in the western component of CRISTAL-22 (HZ10) that also shows a high level of dust obscuration; Faisst et al. 2020b; Villanueva et al. 2024), we measure [C II]/FIR ratios of 2.5 × 10⁻⁴ and 8.3 × 10⁻⁴ for Region 1 and Region 2, respectively. For comparison, the [C II]/FIR ratio measured globally is higher (L[CII]/LFIR = 2.6 × 10⁻³), driven in large part because the [C II] line emission is much more extended than the dust continuum, peaking in the other two main star forming regions traced by the rest-frame UV emission.
The right panel of Fig. 12 shows the [C II]/FIR ratio measured in Region 1 (green) and Region 2 (blue) of CRISTAL-10a in context with [C II]/FIR ratios measured in nearby and high-z systems (similar to the left panel of Fig. 9). The diagonal bar shows how much the [C II]/FIR ratio and LFIR change if we assume a dust temperature ±10 K around Tdust = 50 K. However, given the characteristics of this source, the dust temperature could potentially be higher.
The [C II]/FIR ratio measured in the star-forming Region 2 is comparable to that found in typical dense PDRs such as that in the Orion Nebula, where the FUV radiation field and neutral gas densities are high (e.g., G0 ≳ 104, nH ≳ 105 cm−3; Goicoechea et al. 2015). In contrast, the [C II]/FIR ratio measured in Region 1 is comparable to that measured in Arp 220, a highly dust obscured ultraluminous infrared galaxy (ULIRG) with deeply embedded star forming formation and potential AGN activity (e.g., Luhman et al. 1998, 2003; González-Alfonso et al. 2004; Barcos-Muñoz et al. 2018; Perna et al. 2024). Finally, the global [C II]/FIR ratio is a factor of ∼10 higher than that measured in Region 1, highlighting that spatially resolved data are important to properly interpret source-integrated measurements.
The notably low [C II]/FIR ratio observed in Arp 220 relative to other star-forming galaxies and (U)LIRGs can be attributed to different factors, including: a) significant non-PDR contributions to the FIR emission due to a high ionization parameter U (e.g., González-Alfonso et al. 2004; Graciá-Carpio et al. 2011) and/or strong AGN activity (e.g., Spoon et al. 2004), and 2) optically thick or self-absorbed [C II] line emission due to the high FIR optical depth (τ ∼ 5 at 100 μm and τ ∼ 1 at 240 μm; Rangwala et al. 2011), although this scenario is likely not dominant (e.g., Luhman et al. 2003). Despite the extensive dataset available for Arp220, the primary cause of the observed [C II] deficit remains unclear, complicating the interpretation of the similarly low [C II]/FIR ratio observed in Region 1 of CRISTAL-10a, which has far less ancillary data available.
The discovery of a comparably low [C II]/FIR ratio in CRISTAL-10a at z = 5.67 as observed in the extreme nearby system Arp 220 is particularly intriguing. This finding highlights the need for additional observations to further understand the power source and properties of the ISM in Region 1 of CRISTAL-10a, such as observations of additional FIR lines.
8.2. CRISTAL-13: Burst of star formation and offset with [C II] line emission
To gain a deeper insight into the spatial distribution of cold gas, dust, and stellar emission within this complex system, we analyzed high-resolution Briggs-weighted [C II] and dust continuum maps. These maps provide an angular resolution of approximately ∼ 1 kpc ( ). The left panel of Fig. 13 illustrates the distribution of cold gas (traced by the [C II] line) and dust (traced by the continuum) on kiloparsec scales, compared to the young stellar light traced by combining three NIRCam blue filters (F090W, F115W, F150W). The NIRCam imaging reveals at least seven star-forming clumps: a primary clump in the east and six clumps in the west, distributed from north to south. In the main eastern component, the peak of stellar light is offset by approximately ∼1 kpc from the peak of the [C II] line and dust continuum emission. One possibility is that this offset is caused by dust obscuration, although stellar light from this position is also visible in the redder NIRCam filters, including F444W. In contrast, the western component, dominated by young stellar clumps, shows only faint [C II] line emission, with [C II] primarily tracing neutral gas surrounding the clumps.
The right panel of Fig. 13 shows a cartoon representation of the main components of CRISTAL-13. The physical properties of the stellar clumps are derived based on the modeling of the stellar light SED presented in Lines et al. (2025). Starting with the east component, there is a stellar clump with a stellar population of age ≈100 Myr that contains about half of the total stellar mass of the system. The stellar mass and SFR of this clump (sSFR ≈ 0.5 × 10⁻⁸ yr−1) place it on the main-sequence of star-forming galaxies at z ≈ 5 (e.g., Speagle et al. 2014). Right next to this massive star-forming clump there is a peak in the [C II] and dust continuum that can be interpreted as a massive and dusty PDR illuminated by the stellar light from the massive stellar clump. The [C II]/FIR ratio measured in this region is L[CII]/LFIR = 2 × 10⁻³ (assuming Tdust = 40 K; Faisst et al. 2020b; Villanueva et al. 2024), comparable to that measured in the dense PDR in the Orion Nebula.
The situation in the western component of CRISTAL-13 appears to be more interesting due to the offset between the six giant stellar clumps, which are aligned from north to south, and the neutral gas traced by the [C II] line emission. In the Briggs-weighted map, the [C II] emission peaks west of these giant clumps. In contrast, the natural-weighted map (Fig. E.3) reveals some diffuse [C II] emission overlapping with the stellar clumps, though it is significantly fainter than the stronger [C II] emission surrounding them. The six stellar clumps are young (tage ≲ 50 Myr), blue (β ≈ −2.25), and exhibit a sSFR that places them at least a factor 10 above the main-sequence relation of star-forming galaxies. The more concentrated [C II] line emission is distributed around the stellar clumps, with a peak in the south resembling a PDR illuminated mainly by the emission from clumps 5 and 6. This spatial anticorrelation between young stellar clusters and the peak [C II] line emission is expected and observed in H II region-PDR complexes such as M 17, the Orion Nebula, and 30 Doradus (e.g., Goicoechea et al. 2015; Pellegrini et al. 2007; Okada et al. 2019; Pabst et al. 2021). The key difference in CRISTAL-13 is the physical scale, as we are discussing giant stellar clumps and PDRs on kiloparsec scales, where much of the complexity is hidden by our angular resolution.
Simulations of star-forming galaxies have investigated the impact of stellar feedback on the ISM under conditions similar to those observed in high-redshift galaxies such as CRISTAL-13. For example, Vallini et al. (2017) study the photo-evaporation timescale of molecular clouds as a function of metallicity and the FUV radiation field intensity, G0. In models with gas metallicity Z = 0.2 Z⊙, expected for the gas in CRISTAL-13, the photo-evaporation timescales are approximately ∼10 Myr for G0 values ranging from ≈1 − 103, and then decrease from ∼10 Myr to ∼1 Myr as G0 increases from ∼103 to ∼105. This is consistent with the scenario where strong stellar feedback from the six young (≲50 Myr) stellar clusters in the west component of CRISTAL-13 are responsible for clearing or photo-evaporating the surrounding cold gas.
Similar results are found in the synthetic observations of smoothed particle hydrodynamics simulations of a dwarf galaxy merger (Z = 0.1 Z⊙), where supernova feedback from the stellar clusters disperses the dense gas, leading to a decrease in the [C II] luminosity (Bisbas et al. 2022). Furthermore, Katz et al. (2017) use cosmological simulations of star-forming galaxies at z ≈ 6 to investigate the spatial distribution of star formation activity (traced by UV light), dust, and [C II] line emission. They find that in regions with low gas metallicity and dust content, UV and optical light from young stars escapes without significant reprocessing, and the [C II] is suppressed. This scenario is also consistent with our observations of the western component of CRISTAL-13. Conversely, in the central regions of galaxies where metallicity and dust content are higher, the [C II] emission produced in dense PDRs pass through the dust, while UV light is obscured, resulting in a spatial offset similar to that observed in the main component of CRISTAL-13.
9. The [C II]/FIR ratio in CRISTAL galaxies and systems across redshift
The photoelectric heating efficiency (ϵph) – defined as the ratio of the energy transferred to the gas to the energy absorbed by dust grains from UV radiation – plays a key role in regulating the thermal balance of the ISM. This efficiency typically ranges from 0.1% to 1% (e.g., Malhotra et al. 2001; Smith et al. 2017; Herrera-Camus et al. 2018b). A key factor influencing ϵph is the ratio of the UV radiation field intensity to the neutral gas density, G0/nH, which affects the charge state of dust grains and, consequently, their heating efficiency (e.g., Rubin et al. 2009; Díaz-Santos et al. 2017). Observationally, ϵph is often estimated through the ratio of [C II] to FIR luminosities, based on the assumption that the photoelectric effect on dust grains is the dominant heating mechanism, and that the [C II] emission is the main coolant of the cold neutral gas. However, it is important to note that there may be non-negligible contributions from other cooling lines, such as the [O I] 63 μm transition (e.g., Rosenberg et al. 2015).
One of the key advantages of the CRISTAL survey is its ability to extend the study of the L[CII]/LFIR ratio, and consequently ϵph, to star-forming galaxies at z ≈ 4 − 6, including lower-mass galaxies than previously explored at high-redshift (e.g., Spilker et al. 2016). Figure 14 shows the L[CII]/LFIR ratio measured in nearby star-forming galaxies and starbursts (gold), and in high-redshift galaxies (gray), including the CRISTAL galaxies (green contours), as a function of FIR luminosity (LFIR; left panel) and surface density (ΣFIR; right panel). FIR luminosities of CRISTAL galaxies are drawn from Mitsuhashi et al. (2024). The vertical axis on the right shows the L[CII]/LFIR ratio normalized to the value observed in the dense PDR of Orion. Notably, all global values for the CRISTAL galaxies exceed the Orion PDR ratio, although, as we discuss in the case of CRISTAL-10, this may not hold on kiloparsec scales.
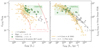 |
Fig. 14. Left: [C II]/FIR luminosity ratio as a function of the FIR luminosity observed in nearby star-forming galaxies and starbursts (beige points; Lutz et al. 2016; Herrera-Camus et al. 2018b) and high-z star-forming galaxies (gray points; Spilker et al. 2016, and references therein). CRISTAL galaxies are shown as gray points with green borders. As a reference, the y axis on the right shows the [C II]/FIR luminosity ratio normalized to the value measured in the dense PDR of the Orion Nebula (L[CII]/LFIR = 1.1 × 10⁻³; Goicoechea et al. 2015). The predictions from the models by Narayanan & Krumholz (2017) of how the relation between L[CII]/LFIR and LFIR changes if the molecular gas content increase by a factor of ×10 are shown as light-blue lines. The solid golden line represents the running median for z ≈ 0 galaxies, while the dashed lines indicate the 10th and 90th percentiles. Right: Similar to the left panel, but this time we plot the [C II]/FIR luminosity ratio as a function of the FIR surface brightness (ΣFIR). The best fit to the data at z ≈ 0 (Lutz et al. 2016; Herrera-Camus et al. 2018b) and z ≈ 3 − 6 (this work; Eq. (2)) are shown as beige and gray lines, respectively. |
It is well established that the L[CII]/LFIR ratio decreases with increasing LFIR in both nearby and high-redshift galaxies, a phenomenon known as the “[C II] deficit” (e.g., Malhotra et al. 1997, 2001; Luhman et al. 2003; Díaz-Santos et al. 2013, 2017; Herrera-Camus et al. 2018a,b). The left panel of Fig. 14 illustrates this trend, showing that while both local and high-redshift galaxies follow this pattern, high-redshift galaxies are shifted toward higher FIR luminosities (e.g., Maiolino et al. 2009; Stacey et al. 2010; Graciá-Carpio et al. 2011).
Narayanan & Krumholz (2017) propose a theoretical explanation for the “[C II] deficit”, based on models that consider clouds composed of atomic and molecular hydrogen, coupled with chemical equilibrium networks and radiative transfer models. According to their framework, the decline in the [C II]/FIR ratio with increasing LFIR is driven by the relationship between the SFR (and thus LFIR) and the surface density of gas clouds (Σgas). As Σgas increases, LFIR rises, and the carbon in molecular gas is principally in the form of CO, leading to a decrease in C+ abundance, and consequently, a lower [C II]/FIR ratio.
Their model also accounts for the scatter observed around the declining [C II]/FIR trend with LFIR. Since the SFR, and therefore LFIR, scales with both gas mass (Mgas) and Σgas, any increase in Mgas, while keeping LFIR fixed, must result in a lower Σgas. As Σgas decreases, C+ abundance increases, raising the [C II]/FIR ratio. This effect is illustrated by the model curves in the left panel of Fig. 14, which shows the impact of increasing the gas mass by a factor of 10. Under this interpretation, the offset in the “[C II] deficit” observed between local and high-z galaxies arises because high-z galaxies are generally richer in molecular gas (e.g., Tacconi et al. 2020; Dessauges-Zavadsky et al. 2020; Aravena et al. 2024). The CRISTAL galaxies appear to occupy the upper envelope of nearby galaxies with similar FIR luminosities and overlap with high-z systems at comparable FIR luminosities, bridging the characteristics of these two populations.
The right panel of Fig. 14 presents the “[C II] deficit” as a function of FIR surface brightness, ΣFIR. For the CRISTAL galaxies, ΣFIR is calculated using the dust continuum sizes measured by Mitsuhashi et al. (2024). The relationship between the [C II]/FIR ratio and ΣFIR is significantly tighter than when plotted against LFIR, and the offset between nearby and high-z galaxy populations becomes less pronounced. This tighter correlation between the [C II]/FIR ratio and ΣFIR has been reported in previous studies (e.g., Lutz et al. 2016; Spilker et al. 2016; Díaz-Santos et al. 2017; Herrera-Camus et al. 2018b), and aligns with other findings that show a stronger relationship between Σ[CII] and ΣSFR compared to L[CII] and SFR (e.g., Herrera-Camus et al. 2015, 2018a; De Looze et al. 2014). This likely originates from the closer connection between G0/H, the primary parameter controlling the physical and thermal structure of PDRs, and ΣFIR, compared to LFIR.
With the CRISTAL survey, we can now extend the study of the [C II]/FIR–ΣFIR relation in high-redshift galaxies to values of  , covering a range similar to that of previous studies of nearby galaxies. Following Lutz et al. (2016), the relation between the [C II]/FIR ratio and ΣFIR for star-forming galaxies at z ≈ 0 is parameterized as
![$$ \begin{aligned} \mathrm{log}_{10}(L_{\rm [CII]}/L_{\rm FIR})~[z\approx 0]&= -11.7044 + 2.1676\times \mathrm{log}_{10}(\Sigma _{\rm FIR}) \nonumber \\&\quad - 0.1235\times (\mathrm{log}_{10}(\Sigma _{\rm FIR}))^2, \end{aligned} $$](/articles/aa/full_html/2025/07/aa53896-25/aa53896-25-eq23.gif)
shown as the solid golden line in the right panel of Fig. 9.
Using a similar approach for star-forming galaxies at z ≈ 3 − 6, including the CRISTAL galaxies covering the range  , and the galaxies from Spilker et al. (2016) (and references therein) covering
  , we derive the following relation:
![$$ \begin{aligned} \mathrm{log}_{10}(L_{\rm [CII]}/L_{\rm FIR})~[z\approx 3{-}6]&= -8.4163 + 1.3245\times \mathrm{log}_{10}(\Sigma _{\rm FIR}) \nonumber \\&\quad - 0.0731\times (\mathrm{log}_{10}(\Sigma _{\rm FIR}))^2, \end{aligned} $$](/articles/aa/full_html/2025/07/aa53896-25/aa53896-25-eq26.gif)
represented by the solid gray line in the right panel of Fig. 14.
Notably, in the range  , star-forming galaxies at z ≈ 3 − 6 exhibit [C II]/FIR ratios that are higher by factors of 3–10, compared to galaxies at z ≈ 0, for a given value of ΣFIR. One alternative to explain the physical origin driving the elevated [C II]/FIR ratios observed in high-redshift galaxies compared to nearby star-forming systems could be metallicity. Metallicity plays an important role in determining the cooling efficiency of the ISM. In low-metallicity environments, the reduced dust content allows a larger fraction of FUV photons to penetrate deeper into molecular clouds, leading to more extended PDRs. Elevated [C II]/FIR ratios have been observed in gas with metallicities around ∼1/2 − 1/5 of solar abundance, similar to what could be expected for massive star-forming galaxies at z ≳ 4 − 6 such as CRISTAL systems (e.g., Curti et al. 2024; Nakajima et al. 2023). Examples include the Small Magellanic Cloud (Israel & Maloney 2011) and low-metallicity, kiloparsec-scale regions of nearby galaxies (Smith et al. 2017). Consequently, high-z galaxies with lower metal content could exhibit enhanced [C II] emission relative to their FIR luminosity, contributing to the elevated [C II]/FIR ratios observed in these systems.
A second factor, not as significant as metallicity but complementary, could be the presence of diffuse, extra-planar [C II] gas, which extends beyond the star-forming regions of CRISTAL galaxies. In this scenario, the [C II] emission may originate not only from PDRs but also from lower-density, more diffuse gas in the CGM. Evidence of [C II] line emission significantly extending beyond the star-forming disk as traced by the UV/optical/infrared emission has been found in CRISTAL galaxies (Ikeda et al. 2025) and other star-forming high-z galaxies (Fujimoto et al. 2019, 2020; Ginolfi et al. 2020), including massive, intensely star-forming galaxies at z ∼ 3 (e.g., Rybak et al. 2019). In the particular case of interacting galaxies, which represent at least one-third of the CRISTAL galaxies, extra-planar, low-velocity shocked gas can also contribute to the [C II] line emission (e.g., Appleton et al. 2013; Peterson et al. 2018). However, it is important to note that at z ∼ 5, cosmic microwave background (CMB) suppression of the [C II] emission from diffuse gas becomes significant and works against this interpretation (Kohandel et al. 2019). In all these cases, the diffuse gas adds to the total [C II] flux without a corresponding increase in FIR, potentially contributing to the elevated [C II]/FIR ratios observed at high redshift relative to systems with comparable ΣFIR at lower redshift.
In the future, JWST/NIRSpec observations of the main nebular lines in CRISTAL galaxies will provide valuable insights into the role of metal content in determining the [C II]/FIR ratio on kiloparsec scales (Herrera-Camus et al. in prep.). This will enable direct comparisons with similar spatial scale observations of nearby galaxies, where a clear dependence of the [C II]/FIR ratio with metallicity is observed (e.g., Smith et al. 2017).
10. Summary
We present the CRISTAL survey, an ALMA Cycle 8 Large Program designed to explore the physical properties of star-forming galaxies in the early Universe through spatially resolved, multiwavelength observations. CRISTAL focuses on main-sequence star-forming galaxies at redshifts of 4 ≲ z ≲ 6, selected from the ALPINE survey (Le Fèvre et al. 2020; Béthermin et al. 2020; Faisst et al. 2020a). Based on ALMA Band 7 data to observe the [C II] line emission and dust continuum, and complemented by HST observations of rest-frame UV emission and JWST/NIRCam imaging of stellar light, CRISTAL offers a comprehensive view of the gas, dust, and stars on kiloparsec scales at the end of the era of reionization.
The main results of our study can be summarized as follows:
-
Sample size: The initial CRISTAL sample consisted of 19 galaxies; however, the depth and angular resolution of the observations allowed us to detect seven additional galaxies within CRISTAL fields and to spatially resolve four interacting systems into distinct pairs. Additionally, we incorporated three galaxies from pilot programs (HZ4, HZ7, and HZ10) and included three galaxies from the ALMA archive that meet the CRISTAL selection criteria. The sample also includes two SMGs within CRISTAL fields: J1000+0234 and CRLE. In total, the extended CRISTAL sample consists of 39 main-sequence star-forming galaxies, 24 of which are detected in the dust continuum. The main properties of these systems are detailed in Table A.1 and Table 1.
-
Diverse nature of CRISTAL galaxies: The CRISTAL galaxies exhibit a wide range of morphologies and kinematic properties. This includes evidence of rotating disks (e.g., CRISTAL-11, -15, -20, -23c), mergers (e.g., CRISTAL-01, -04, -06, -07, -16, -22), and galaxies with [C II] emission tails that are likely indicative of interactions with minor companions (e.g., CRISTAL-02, -03, -09, -11, -12, -19). We also identify systems displaying extended [C II] emission without a corresponding stellar counterpart in HST or JWST/NIRCam images (e.g., CRISTAL-02, -05, -13). Some galaxies exhibit clumpy stellar structures with spatially offset [C II] emission (e.g., CRISTAL-13), while others show a smoother [C II] spatial distribution and kinematics (e.g., CRISTAL-08). Overall, the [C II] line emission reveals the complex nature of star-forming galaxies at 4 ≲ z ≲ 6, with [C II] emission often extending beyond the stellar light captured by HST and JWST, and in many cases displaying a disturbed morphology.
The multiwavelength, spatially resolved nature of the CRISTAL survey enables in-depth studies of four main aspects of galaxies: kinematics, outflows, morphology, and the physical conditions of the ISM (see, for example, CRISTAL papers by Li et al. 2024; Lines et al. 2025; Mitsuhashi et al. 2024; Villanueva et al. 2024; Posses et al. 2025; Ikeda et al. 2025; Solimano et al. 2024; Lee et al. 2025; Birkin et al. 2025; Telikova et al. 2025). In this overview paper, we highlight two case studies – CRISTAL–10 and -13 – that exemplify these primary research areas.
-
CRISTAL-10: Evidence for Arp 220-like conditions in the ISM of az ∼ 5 galaxy. CRISTAL-10a, a main-sequence star-forming galaxy at z = 5.67, presents an intriguing scenario: the peaks of the dust continuum and [C II] line emission are significantly offset, separated by over ∼ 3 kpc. This pronounced offset points to an extreme [C II] deficit. In the region where the dust continuum is most intense, the [C II]/FIR ratio drops to 2.5 × 10⁻⁴, comparable to the extreme low value observed in the highly dust-obscured ULIRG Arp 220 (Luhman et al. 1998; Herrera-Camus et al. 2018b). Notably, the global [C II]/FIR ratio for CRISTAL-10a is nearly an order of magnitude higher, emphasizing the localized nature of the deficit and the importance of spatially resolved observations in characterizing the ISM properties of high-z systems.
-
CRISTAL-13: Burst of star formation and CIIemission offset. CRISTAL-13, a star-forming galaxy at z = 4.579, showcases a complex morphology characterized by at least seven giant star-forming clumps identified through multiband JWST/NIRCam imaging. The most massive clump, situated in the eastern region, coincides spatially with the [C II] and dust continuum peaks, and has a [C II]/FIR ratio comparable to that found in dense PDRs such as Orion. In contrast, the western region hosts a group of at least six young (≲50 Myr) giant star-forming clumps (Lines et al. 2025). We observe a strong spatial anticorrelation between these young stellar clusters and [C II] line emission, likely due to strong feedback effects from the star-forming clumps.
-
The [C II]/FIR ratio in CRISTAL galaxies and its comparison across cosmic time. CRISTAL galaxies have global [C II]/FIR ratios ranging from 1.5 × 10⁻³ to 8 × 10⁻³, following a similar trend of decreasing [C II]/FIR with increasing FIR luminosity as has been observed in nearby galaxies, but shifted toward higher FIR luminosities. One likely explanation is that CRISTAL galaxies at z ∼ 4 − 6 are significantly more molecular gas-rich compared to typical nearby star-forming systems (e.g., Graciá-Carpio et al. 2011; Narayanan & Krumholz 2017). When considering FIR surface brightness – a proxy for the G0/H ratio – CRISTAL galaxies span a unique range of ΣFIR values between 109 and 1011 L⊙ kpc−2, previously unexplored at high-z. Complemented by observations of bright z ≳ 3 sources such as SMGs, we find that the [C II]/FIR ratio tend to be higher than star-forming galaxies at z ∼ 0. This behavior could be attributed to lower metallicities in high-z galaxies or the presence of significant extraplanar gas.
Through the CRISTAL ALMA Large Program, we have advanced our understanding of the complex processes driving galaxy evolution during the first gigayear of the Universe. Future JWST/NIRSpec programs (e.g., PID 3073, PI Faisst, PID 5974, ORCHIDS, and PI Aravena) will build on this progress, expanding the CRISTAL survey by incorporating detailed observations of the physical conditions of ionized gas and metals. This addition will provide a more complete picture of the interplay between the neutral and ionized gas, dust, stars, and metals in the early Universe.
Here we use the definition in Hodge & da Cunha (2020) of a submillimeter galaxy: a system with a high submillimeter flux density of S850 mm ≳ 1 mJy.
Mitsuhashi et al. (2024) use all available broad and medium bands in optical to near-infrared for the SED fitting. From the COSMOS2015 catalog, these include 10 broad bands (u*, B, V, r+, i+, z++, Y, J, H, Ks), 12 medium bands on Ground-based telescopes, and 4 Spitzer bands. Mitsuhashi et al. (2024) also take 4 broad bands (U, B, R, Ks) and 23 medium bands on ground-based telescopes, and 10 HST and 4 Spitzer bands on space telescopes from the ASTRODEEP catalog. The CRISTAL galaxies for which the ALMA Band 7 continuum was included in the SED fitting are listed in Table 1 of Mitsuhashi et al. (2024).
Acknowledgments
RH-C thanks the Max Planck Society for support under the Partner Group project “The Baryon Cycle in Galaxies” between the Max Planck for Extraterrestrial Physics and the Universidad de Concepción. R.H-C. also gratefully acknowledge financial support from ANID – MILENIO – NCN2024_112 and ANID BASAL FB210003. RJA was supported by FONDECYT grant number 1231718. RH-C, MA and RJA were supported by the ANID BASAL project FB210003. N.M.F.S. acknowledges funding by the European Union (ERC Advanced Grant GALPHYS, 101055023). Views and opinions expressed are, however, those of the author(s) only and do not necessarily reflect those of the European Union or the European Research Council. Neither the European Union nor the granting authority can be held responsible for them. J. G-L., acknowledge support from ANID BASAL project FB210003 and Programa de Inserción Académica 2024 Vicerrectoría Académica y Prorrectoría Pontificia Universidad Católica de Chile. RB acknowledges support from an STFC Ernest Rutherford Fellowship (grant number ST/T003596/1). HÜ acknowledges support through the ERC Starting Grant 101164796 “APEX”. TDS acknowledges the research project was supported by the Hellenic Foundation for Research and Innovation (HFRI) under the “2nd Call for HFRI Research Projects to support Faculty Members & Researchers” (Project Number: 03382). K.T. acknowledges support from JSPS KAKENHI Grant No. 23K03466. MR acknowledges support from project PID2023-150178NB-I00 (and PID2020-114414GB-I00), financed by MCIU/AEI/10.13039/501100011033, and by FEDER, UE. This paper makes use of the following ALMA data: ADS/JAO.ALMA#2021.1.00280.L, 2017.1.00428.L, 2012.1.00523.S, 2018.1.01359.S, 2019.1.01075.S. ALMA is a partnership of ESO (representing its member states), NSF (USA) and NINS (Japan), together with NRC (Canada), NSTC and ASIAA (Taiwan), and KASI (Republic of Korea), in cooperation with the Republic of Chile. The Joint ALMA Observatory is operated by ESO, AUI/NRAO and NAOJ. This work is based in part on observations made with the NASA/ESA/CSA James Webb Space Telescope and NASA/ESA Hubble Space Telescope. The data were obtained from the Mikulski Archive for Space Telescopes at the Space Telescope Science Institute, which is operated by the Association of Universities for Research in Astronomy, Inc., under NASA contract NAS 5-03127 for JWST and NAS 1432 5–26555 for HST. Some of the data products presented in this work were retrieved from the DJA. DJA is an initiative of the Cosmic Dawn Center, which is funded by the Danish National Research Foundation under grant No. 140. We acknowledge that the research in this paper was conducted on Noongar land and pay our respects to its traditional custodians and elders, past and present. T.N. acknowledges support from the Deutsche Forschungsgemeinschaft (DFG, German Research Foundation) under Germany’s Excellence Strategy – EXC-2094 – 390783311 from the DFG Cluster of Excellence “ORIGINS”. MA acknowledges support from ANID Basal Project FB210003 and ANID MILENIO NCN2024_112.
References
- Appleton, P. N., Guillard, P., Boulanger, F., et al. 2013, ApJ, 777, 66 [CrossRef] [Google Scholar]
- Aravena, M., Heintz, K., Dessauges-Zavadsky, M., et al. 2024, A&A, 682, A24 [NASA ADS] [CrossRef] [EDP Sciences] [Google Scholar]
- Arnouts, S., Cristiani, S., Moscardini, L., et al. 1999, MNRAS, 310, 540 [Google Scholar]
- Bagley, M. B., Finkelstein, S. L., Koekemoer, A. M., et al. 2023, ApJ, 946, L12 [NASA ADS] [CrossRef] [Google Scholar]
- Baier-Soto, R., Herrera-Camus, R., Förster Schreiber, N. M., et al. 2022, A&A, 664, L5 [NASA ADS] [CrossRef] [EDP Sciences] [Google Scholar]
- Barcos-Muñoz, L., Aalto, S., Thompson, T. A., et al. 2018, ApJ, 853, L28 [Google Scholar]
- Béthermin, M., Fudamoto, Y., Ginolfi, M., et al. 2020, A&A, 643, A2 [Google Scholar]
- Birkin, J. E., Spilker, J. S., Herrera-Camus, R., et al. 2025, ApJ, accepted [arXiv:2504.17877] [Google Scholar]
- Bisbas, T. G., Walch, S., Naab, T., et al. 2022, ApJ, 934, 115 [NASA ADS] [CrossRef] [Google Scholar]
- Boquien, M., Burgarella, D., Roehlly, Y., et al. 2019, A&A, 622, A103 [NASA ADS] [CrossRef] [EDP Sciences] [Google Scholar]
- Bouwens, R. J., Smit, R., Schouws, S., et al. 2022, ApJ, 931, 160 [NASA ADS] [CrossRef] [Google Scholar]
- Brammer, G. 2023, https://doi.org/10.5281/zenodo.7712834 [Google Scholar]
- Brammer, G. B., van Dokkum, P. G., Franx, M., et al. 2012, ApJS, 200, 13 [Google Scholar]
- Brinchmann, J., Charlot, S., White, S. D. M., et al. 2004, MNRAS, 351, 1151 [Google Scholar]
- Bromm, V., & Yoshida, N. 2011, ARA&A, 49, 373 [CrossRef] [Google Scholar]
- Capak, P. L., Carilli, C., Jones, G., et al. 2015, Nature, 522, 455 [NASA ADS] [CrossRef] [Google Scholar]
- Carniani, S., Venturi, G., Parlanti, E., et al. 2024, A&A, 685, A99 [NASA ADS] [CrossRef] [EDP Sciences] [Google Scholar]
- CASA Team, Bean, B., Bhatnagar, S., et al. 2022, PASP, 134, 114501 [NASA ADS] [CrossRef] [Google Scholar]
- Casey, C. M., Kartaltepe, J. S., Drakos, N. E., et al. 2023, ApJ, 954, 31 [NASA ADS] [CrossRef] [Google Scholar]
- Chabrier, G. 2003, PASP, 115, 763 [Google Scholar]
- Condon, J. J. 1997, PASP, 109, 166 [NASA ADS] [CrossRef] [Google Scholar]
- Contursi, A., Poglitsch, A., Grácia Carpio, J., et al. 2013, A&A, 549, A118 [NASA ADS] [CrossRef] [EDP Sciences] [Google Scholar]
- Cox, P., Krips, M., Neri, R., et al. 2011, ApJ, 740, 63 [NASA ADS] [CrossRef] [Google Scholar]
- Curti, M., Maiolino, R., Curtis-Lake, E., et al. 2024, A&A, 684, A75 [NASA ADS] [CrossRef] [EDP Sciences] [Google Scholar]
- Czekala, I., Loomis, R. A., Teague, R., et al. 2021, ApJS, 257, 2 [NASA ADS] [CrossRef] [Google Scholar]
- Davies, R. L., Fisher, D., & Herrera-Camus, R. 2025, Science, submitted [Google Scholar]
- De Breuck, C., Maiolino, R., Caselli, P., et al. 2011, A&A, 530, L8 [NASA ADS] [CrossRef] [EDP Sciences] [Google Scholar]
- Decarli, R., Walter, F., Venemans, B. P., et al. 2018, ApJ, 854, 97 [Google Scholar]
- De Looze, I., Cormier, D., Lebouteiller, V., et al. 2014, A&A, 568, A62 [NASA ADS] [CrossRef] [EDP Sciences] [Google Scholar]
- Dessauges-Zavadsky, M., Ginolfi, M., Pozzi, F., et al. 2020, A&A, 643, A5 [NASA ADS] [CrossRef] [EDP Sciences] [Google Scholar]
- Devereaux, T., Cassata, P., Ibar, E., et al. 2024, A&A, 686, A156 [NASA ADS] [CrossRef] [EDP Sciences] [Google Scholar]
- Díaz-Santos, T., Armus, L., Charmandaris, V., et al. 2013, ApJ, 774, 68 [Google Scholar]
- Díaz-Santos, T., Armus, L., Charmandaris, V., et al. 2017, ApJ, 846, 32 [Google Scholar]
- Di Teodoro, E. M., & Fraternali, F. 2015, MNRAS, 451, 3021 [Google Scholar]
- Faisst, A. L., Schaerer, D., Lemaux, B. C., et al. 2020a, ApJS, 247, 61 [NASA ADS] [CrossRef] [Google Scholar]
- Faisst, A. L., Fudamoto, Y., Oesch, P. A., et al. 2020b, MNRAS, 498, 4192 [NASA ADS] [CrossRef] [Google Scholar]
- Fluetsch, A., Maiolino, R., Carniani, S., et al. 2019, MNRAS, 483, 4586 [NASA ADS] [Google Scholar]
- Förster Schreiber, N. M., & Wuyts, S. 2020, ARA&A, 58, 661 [Google Scholar]
- Fraternali, F., Karim, A., Magnelli, B., et al. 2021, A&A, 647, A194 [NASA ADS] [CrossRef] [EDP Sciences] [Google Scholar]
- Fudamoto, Y., Oesch, P. A., Faisst, A., et al. 2020, A&A, 643, A4 [NASA ADS] [CrossRef] [EDP Sciences] [Google Scholar]
- Fujimoto, S., Ouchi, M., Ferrara, A., et al. 2019, ApJ, 887, 107 [Google Scholar]
- Fujimoto, S., Silverman, J. D., Bethermin, M., et al. 2020, ApJ, 900, 1 [Google Scholar]
- Fujimoto, S., Ouchi, M., Kohno, K., et al. 2024, Nat. Astron., in press [arXiv:2402.18543] [Google Scholar]
- Gallerani, S., Pallottini, A., Feruglio, C., et al. 2018, MNRAS, 473, 1909 [Google Scholar]
- Ginolfi, M., Jones, G. C., Béthermin, M., et al. 2020, A&A, 633, A90 [NASA ADS] [CrossRef] [EDP Sciences] [Google Scholar]
- Goicoechea, J. R., Teyssier, D., Etxaluze, M., et al. 2015, ApJ, 812, 75 [Google Scholar]
- Gómez-Guijarro, C., Toft, S., Karim, A., et al. 2018, ApJ, 856, 121 [Google Scholar]
- González-Alfonso, E., Smith, H. A., Fischer, J., & Cernicharo, J. 2004, ApJ, 613, 247 [Google Scholar]
- Graciá-Carpio, J., Sturm, E., Hailey-Dunsheath, S., et al. 2011, ApJ, 728, L7 [Google Scholar]
- Grogin, N. A., Kocevski, D. D., Faber, S. M., et al. 2011, ApJS, 197, 35 [NASA ADS] [CrossRef] [Google Scholar]
- Guaita, L., Aravena, M., Gurung-Lopez, S., et al. 2022, A&A, 660, A137 [NASA ADS] [CrossRef] [EDP Sciences] [Google Scholar]
- Gullberg, B., De Breuck, C., Vieira, J. D., et al. 2015, MNRAS, 449, 2883 [Google Scholar]
- Gullberg, B., Swinbank, A. M., Smail, I., et al. 2018, ApJ, 859, 12 [Google Scholar]
- Hashimoto, T., Inoue, A. K., Mawatari, K., et al. 2019, PASJ, 71, 71 [Google Scholar]
- Heintz, K. E., Brammer, G. B., Watson, D., et al. 2025, A&A, 693, A60 [Google Scholar]
- Herrera-Camus, R., Bolatto, A. D., Wolfire, M. G., et al. 2015, ApJ, 800, 1 [Google Scholar]
- Herrera-Camus, R., Sturm, E., Graciá-Carpio, J., et al. 2018a, ApJ, 861, 95 [Google Scholar]
- Herrera-Camus, R., Sturm, E., Graciá-Carpio, J., et al. 2018b, ApJ, 861, 94 [Google Scholar]
- Herrera-Camus, R., Janssen, A., Sturm, E., et al. 2020, A&A, 635, A47 [NASA ADS] [CrossRef] [EDP Sciences] [Google Scholar]
- Herrera-Camus, R., Förster Schreiber, N., Genzel, R., & Tacconi, L. 2021, A&A, 1, 1 [Google Scholar]
- Herrera-Camus, R., Förster Schreiber, N. M., Price, S. H., et al. 2022, A&A, 665, L8 [NASA ADS] [CrossRef] [EDP Sciences] [Google Scholar]
- Hibbard, J. E., & van Gorkom, J. H. 1996, AJ, 111, 655 [NASA ADS] [CrossRef] [Google Scholar]
- Hodge, J. A., & da Cunha, E. 2020, R. Soc. Open Sci., 7, 200556 [NASA ADS] [CrossRef] [Google Scholar]
- Huertas-Company, M., Iyer, K. G., Angeloudi, E., et al. 2024, A&A, 685, A48 [NASA ADS] [CrossRef] [EDP Sciences] [Google Scholar]
- Ikeda, R., Tadaki, K.-I., Mitsuhashi, I., et al. 2025, A&A, 693, A237 [NASA ADS] [CrossRef] [EDP Sciences] [Google Scholar]
- Ilbert, O., Arnouts, S., McCracken, H. J., et al. 2006, A&A, 457, 841 [NASA ADS] [CrossRef] [EDP Sciences] [Google Scholar]
- Inami, H., Algera, H. S. B., Schouws, S., et al. 2022, MNRAS, 515, 3126 [NASA ADS] [CrossRef] [Google Scholar]
- Iono, D., Yun, M. S., Elvis, M., et al. 2006, ApJ, 645, L97 [CrossRef] [Google Scholar]
- Israel, F. P., & Maloney, P. R. 2011, A&A, 531, A19 [NASA ADS] [CrossRef] [EDP Sciences] [Google Scholar]
- Jiménez-Andrade, E. F., Cantalupo, S., Magnelli, B., et al. 2023, MNRAS, 521, 2326 [CrossRef] [Google Scholar]
- Jones, G. C., Vergani, D., Romano, M., et al. 2021, MNRAS, 507, 3540 [NASA ADS] [CrossRef] [Google Scholar]
- Jones, G. C., Bunker, A. J., Telikova, K., et al. 2024, MNRAS, submitted [arXiv:2405.12955] [Google Scholar]
- Jorsater, S., & van Moorsel, G. A. 1995, AJ, 110, 2037 [Google Scholar]
- Katz, H., Kimm, T., Sijacki, D., & Haehnelt, M. G. 2017, MNRAS, 468, 4831 [Google Scholar]
- Kennicutt, R. C., Calzetti, D., Aniano, G., et al. 2011, PASP, 123, 1347 [Google Scholar]
- Khusanova, Y., Bethermin, M., Le Fèvre, O., et al. 2021, A&A, 649, A152 [NASA ADS] [CrossRef] [EDP Sciences] [Google Scholar]
- Kohandel, M., Pallottini, A., Ferrara, A., et al. 2019, MNRAS, 487, 3007 [NASA ADS] [CrossRef] [Google Scholar]
- Krumholz, M. R., Burkhart, B., Forbes, J. C., & Crocker, R. M. 2018, MNRAS, 477, 2716 [CrossRef] [Google Scholar]
- Lambert, T. S., Posses, A., Aravena, M., et al. 2023, MNRAS, 518, 3183 [Google Scholar]
- Le Fèvre, O., Tasca, L. A. M., Cassata, P., et al. 2015, A&A, 576, A79 [Google Scholar]
- Le Fèvre, O., Béthermin, M., Faisst, A., et al. 2020, A&A, 643, A1 [Google Scholar]
- Lee, L. L., Förster Schreiber, N., Herrera-Camus, R., et al. 2025, A&A, submitted [Google Scholar]
- Li, J., Da Cunha, E., González-López, J., et al. 2024, ApJ, 976, 70 [NASA ADS] [CrossRef] [Google Scholar]
- Lines, N. E. P., Bowler, R. A. A., Adams, N. J., et al. 2025, MNRAS, 539, 2685 [Google Scholar]
- Luhman, M. L., Satyapal, S., Fischer, J., et al. 1998, ApJ, 504, L11 [Google Scholar]
- Luhman, M. L., Satyapal, S., Fischer, J., et al. 2003, ApJ, 594, 758 [Google Scholar]
- Lutz, D., Berta, S., Contursi, A., et al. 2016, A&A, 591, A136 [NASA ADS] [CrossRef] [EDP Sciences] [Google Scholar]
- Maiolino, R., Cox, P., Caselli, P., et al. 2005, A&A, 440, L51 [NASA ADS] [CrossRef] [EDP Sciences] [Google Scholar]
- Maiolino, R., Caselli, P., Nagao, T., et al. 2009, A&A, 500, L1 [NASA ADS] [CrossRef] [EDP Sciences] [Google Scholar]
- Malhotra, S., Helou, G., Stacey, G., et al. 1997, ApJ, 491, L27 [NASA ADS] [CrossRef] [Google Scholar]
- Malhotra, S., Kaufman, M. J., Hollenbach, D., et al. 2001, ApJ, 561, 766 [Google Scholar]
- Merlin, E., Castellano, M., Santini, P., et al. 2021, A&A, 649, A22 [NASA ADS] [CrossRef] [EDP Sciences] [Google Scholar]
- Mitsuhashi, I., Tadaki, K.-I., Ikeda, R., et al. 2024, A&A, 690, A197 [NASA ADS] [CrossRef] [EDP Sciences] [Google Scholar]
- Mowla, L. A., van Dokkum, P., Brammer, G. B., et al. 2019, ApJ, 880, 57 [NASA ADS] [CrossRef] [Google Scholar]
- Nakajima, K., Ouchi, M., Isobe, Y., et al. 2023, ApJS, 269, 33 [NASA ADS] [CrossRef] [Google Scholar]
- Narayanan, D., & Krumholz, M. R. 2017, MNRAS, 467, 50 [NASA ADS] [CrossRef] [Google Scholar]
- Neeleman, M., Bañados, E., Walter, F., et al. 2019, ApJ, 882, 10 [Google Scholar]
- Neeleman, M., Prochaska, J. X., Kanekar, N., & Rafelski, M. 2020, Nature, 581, 269 [Google Scholar]
- Okada, Y., Güsten, R., Requena-Torres, M. A., et al. 2019, A&A, 621, A62 [NASA ADS] [CrossRef] [EDP Sciences] [Google Scholar]
- Pabst, C. H. M., Hacar, A., Goicoechea, J. R., et al. 2021, A&A, 651, A111 [NASA ADS] [CrossRef] [EDP Sciences] [Google Scholar]
- Parlanti, E., Carniani, S., Venturi, G., et al. 2025, A&A, 695, A6 [NASA ADS] [CrossRef] [EDP Sciences] [Google Scholar]
- Pavesi, R., Riechers, D. A., Sharon, C. E., et al. 2018, ApJ, 861, 43 [Google Scholar]
- Pellegrini, E. W., Baldwin, J. A., Brogan, C. L., et al. 2007, ApJ, 658, 1119 [NASA ADS] [CrossRef] [Google Scholar]
- Perna, M., Arribas, S., Lamperti, I., et al. 2024, A&A, 690, A171 [NASA ADS] [CrossRef] [EDP Sciences] [Google Scholar]
- Peterson, B. W., Appleton, P. N., Bitsakis, T., et al. 2018, ApJ, 855, 141 [NASA ADS] [Google Scholar]
- Pilbratt, G. L., Riedinger, J. R., Passvogel, T., et al. 2010, A&A, 518, L1 [NASA ADS] [CrossRef] [EDP Sciences] [Google Scholar]
- Pineda, J. L., Langer, W. D., Velusamy, T., & Goldsmith, P. F. 2013, A&A, 554, A103 [CrossRef] [EDP Sciences] [Google Scholar]
- Pineda, J. L., Langer, W. D., & Goldsmith, P. F. 2014, A&A, 570, A121 [NASA ADS] [CrossRef] [EDP Sciences] [Google Scholar]
- Pizzati, E., Ferrara, A., Pallottini, A., et al. 2020, MNRAS, 495, 160 [Google Scholar]
- Pizzati, E., Ferrara, A., Pallottini, A., et al. 2023, MNRAS, 519, 4608 [NASA ADS] [CrossRef] [Google Scholar]
- Poglitsch, A., Waelkens, C., Geis, N., et al. 2010, A&A, 518, L2 [NASA ADS] [CrossRef] [EDP Sciences] [Google Scholar]
- Popping, G., Pillepich, A., Calistro Rivera, G., et al. 2022, MNRAS, 510, 3321 [CrossRef] [Google Scholar]
- Posses, A., Aravena, M., González-López, J., et al. 2025, A&A, in press, https://doi.org/10.1051/0004-6361/202449843 [Google Scholar]
- Rangwala, N., Maloney, P. R., Glenn, J., et al. 2011, ApJ, 743, 94 [NASA ADS] [CrossRef] [Google Scholar]
- Riechers, D. A., Bradford, C. M., Clements, D. L., et al. 2013, Nature, 496, 329 [Google Scholar]
- Riechers, D. A., Carilli, C. L., Capak, P. L., et al. 2014, ApJ, 796, 84 [Google Scholar]
- Rieke, M. J., Kelly, D. M., Misselt, K., et al. 2023, PASP, 135, 028001 [CrossRef] [Google Scholar]
- Rinaldi, P., Navarro-Carrera, R., Caputi, K. I., et al. 2025, ApJ, 981, 161 [Google Scholar]
- Rizzo, F., Vegetti, S., Fraternali, F., Stacey, H. R., & Powell, D. 2021, MNRAS, 507, 3952 [NASA ADS] [CrossRef] [Google Scholar]
- Rizzo, F., Kohandel, M., Pallottini, A., et al. 2022, A&A, 667, A5 [NASA ADS] [CrossRef] [EDP Sciences] [Google Scholar]
- Robertson, B. E. 2022, ARA&A, 60, 121 [NASA ADS] [CrossRef] [Google Scholar]
- Rodighiero, G., Daddi, E., Baronchelli, I., et al. 2011, ApJ, 739, L40 [Google Scholar]
- Rosenberg, M. J. F., van der Werf, P. P., Aalto, S., et al. 2015, ApJ, 801, 72 [Google Scholar]
- Rubin, D., Hony, S., Madden, S. C., et al. 2009, A&A, 494, 647 [NASA ADS] [CrossRef] [EDP Sciences] [Google Scholar]
- Rybak, M., Calistro Rivera, G., Hodge, J. A., et al. 2019, ApJ, 876, 112 [Google Scholar]
- Sargsyan, L., Lebouteiller, V., Weedman, D., et al. 2012, ApJ, 755, 171 [Google Scholar]
- Schaerer, D., Ginolfi, M., Béthermin, M., et al. 2020, A&A, 643, A3 [NASA ADS] [CrossRef] [EDP Sciences] [Google Scholar]
- Schreiber, C., Pannella, M., Elbaz, D., et al. 2015, A&A, 575, A74 [NASA ADS] [CrossRef] [EDP Sciences] [Google Scholar]
- Scoville, N., Aussel, H., Brusa, M., et al. 2007, ApJS, 172, 1 [Google Scholar]
- Smith, J. D. T., Croxall, K., Draine, B., et al. 2017, ApJ, 834, 5 [Google Scholar]
- Solimano, M., González-López, J., Aravena, M., et al. 2024, A&A, 689, A145 [NASA ADS] [CrossRef] [EDP Sciences] [Google Scholar]
- Solimano, M., González-López, J., Aravena, M., et al. 2025, A&A, 693, A70 [NASA ADS] [CrossRef] [EDP Sciences] [Google Scholar]
- Speagle, J. S., Steinhardt, C. L., Capak, P. L., & Silverman, J. D. 2014, ApJS, 214, 15 [Google Scholar]
- Spilker, J. S., Marrone, D. P., Aravena, M., et al. 2016, ApJ, 826, 112 [NASA ADS] [CrossRef] [Google Scholar]
- Spilker, J. S., Hayward, C. C., Marrone, D. P., et al. 2022, ApJ, 929, L3 [NASA ADS] [CrossRef] [Google Scholar]
- Spoon, H. W. W., Moorwood, A. F. M., Lutz, D., et al. 2004, A&A, 414, 873 [NASA ADS] [CrossRef] [EDP Sciences] [Google Scholar]
- Stacey, G. J., Hailey-Dunsheath, S., Ferkinhoff, C., et al. 2010, ApJ, 724, 957 [NASA ADS] [CrossRef] [Google Scholar]
- Stark, D. P. 2016, ARA&A, 54, 761 [Google Scholar]
- Tacconi, L. J., Genzel, R., & Sternberg, A. 2020, ARA&A, 58, 157 [NASA ADS] [CrossRef] [Google Scholar]
- Telikova, K., González-López, J., Aravena, M., et al. 2025, A&A, 699, A5 [NASA ADS] [CrossRef] [EDP Sciences] [Google Scholar]
- Tumlinson, J., Peeples, M. S., & Werk, J. K. 2017, ARA&A, 55, 389 [Google Scholar]
- Vallini, L., Ferrara, A., Pallottini, A., & Gallerani, S. 2017, MNRAS, 467, 1300 [NASA ADS] [Google Scholar]
- Veilleux, S., Maiolino, R., Bolatto, A. D., & Aalto, S. 2020, A&ARv, 28, 2 [NASA ADS] [CrossRef] [Google Scholar]
- Venemans, B. P., McMahon, R. G., Walter, F., et al. 2012, ApJ, 751, L25 [NASA ADS] [CrossRef] [Google Scholar]
- Vieira, J. D., Marrone, D. P., Chapman, S. C., et al. 2013, Nature, 495, 344 [Google Scholar]
- Villanueva, V., Herrera-Camus, R., González-López, J., et al. 2024, A&A, 691, A133 [NASA ADS] [CrossRef] [EDP Sciences] [Google Scholar]
- Wagg, J., Carilli, C. L., Wilner, D. J., et al. 2010, A&A, 519, L1 [NASA ADS] [CrossRef] [EDP Sciences] [Google Scholar]
- Walter, F., Decarli, R., Carilli, C., et al. 2012, Nature, 486, 233 [Google Scholar]
- Weaver, J. R., Kauffmann, O. B., Ilbert, O., et al. 2022, ApJS, 258, 11 [NASA ADS] [CrossRef] [Google Scholar]
- Wisnioski, E., Förster Schreiber, N. M., Wuyts, S., et al. 2015, ApJ, 799, 209 [Google Scholar]
- Wolfire, M. G., Vallini, L., & Chevance, M. 2022, ARA&A, 60, 247 [NASA ADS] [CrossRef] [Google Scholar]
- Zanella, A., Daddi, E., Magdis, G., et al. 2018, MNRAS, 481, 1976 [Google Scholar]
- Zhang, Y., Ouchi, M., Nakajima, K., et al. 2024, ApJ, 970, 19 [NASA ADS] [CrossRef] [Google Scholar]
Appendix A: Main properties of the CRISTAL galaxy sample
Table A.1 summarizes the main properties of the CRISTAL galaxies, including names, coordinates, [C II]-based redshift, and stellar masses and SFRs derived by Mitsuhashi et al. (2024).
The ALMA-CRISTAL Sample
Appendix B: Summary of ALMA observations
Table B.1 provides a summary of the ALMA-CRISTAL observations, detailing the array configuration, number of antennas, flux calibrator, synthesized beam size, as well as the cube and continuum noise levels achieved with both Natural and Briggs weighting.
ALMA observations
Appendix C: ALMA observing programs combined in the data processing
Table C1 lists the IDs of the ALMA observing programs that were combined to produce the final CRISTAL data products.
IDs of ALMA program used to produce final CRISTAL products
Appendix D: HST and JWST data available for CRISTAL galaxies
Table D1 provides a summary of the HST/WFC3 and JWST/NIRCam observations available for the CRISTAL survey. All CRISTAL galaxies have HST/WFC3 F160W observations available, and at least ∼75% of them have JWST/NIRCam simultaneous observations in the F115W, F150W, F277W and F444W filters.
HST/WFC3 and JWST/NIRCam data available for CRISTAL galaxies
Appendix E: ALMA, HST, and JWST View of the CRISTAL Galaxies
Figure 11 in the main text, along with Figs. E.1, E.2, E.3, E.4, and E.5, presents a multiwavelength view of the CRISTAL galaxies. From left to right, each panel shows maps of: [C II] integrated intensity (moment 0), [C II] velocity field (moment 1), ALMA Band 7 dust continuum, composite HST/WFC3 imaging, and composite JWST/NIRCam imaging of the stellar light. The filters used in the composite images are listed at the bottom of each panel.
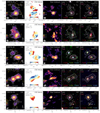 |
Fig. E.1. Multiwavelength view of the CRISTAL galaxies including from left to right: integrated [C II] line emission, [C II]-based velocity field, dust continuum emission, [C II] and dust continuum emission overlaid on a composite image based on HST/WFC3 and JWST/NIRCam observations. The redshift, stellar mass, and SFR are listed in the top left corner of the second panel. S/N contours correspond to 3, 4, and 5σ and then increase in steps of 2σ. |
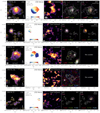 |
Fig. E.2. Multiwavelength view of the CRISTAL galaxies including from left to right: integrated [C II] line emission, [C II]-based velocity field, dust continuum emission, [C II] and dust continuum emission overlaid on a composite image based on HST/WFC3 and JWST/NIRCam observations. The redshift, stellar mass, and SFR are listed in the top left corner of the second panel. S/N contours correspond to 3, 4, and 5σ and then increase in steps of 2σ. |
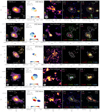 |
Fig. E.3. Multiwavelength view of the CRISTAL galaxies including from left to right: integrated [C II] line emission, [C II]-based velocity field, dust continuum emission, [C II] and dust continuum emission overlaid on a composite image based on HST/WFC3 and JWST/NIRCam observations. The redshift, stellar mass, and SFR are listed in the top left corner of the second panel. S/N contours correspond to 3, 4, and 5σ and then increase in steps of 2σ. |
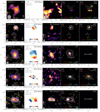 |
Fig. E.4. Multiwavelength view of the CRISTAL galaxies including from left to right: integrated [C II] line emission, [C II]-based velocity field, dust continuum emission, [C II] and dust continuum emission overlaid on a composite image based on HST/WFC3 and JWST/NIRCam observations. The redshift, stellar mass, and SFR are listed in the top left corner of the second panel. S/N contours correspond to 3, 4, and 5σ and then increase in steps of 2σ. |
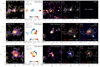 |
Fig. E.5. Multiwavelength view of the CRISTAL galaxies including from left to right: integrated [C II] line emission, [C II]-based velocity field, dust continuum emission, [C II] and dust continuum emission overlaid on a composite image based on HST/WFC3 and JWST/NIRCam observations. The redshift, stellar mass, and SFR are listed in the top left corner of the second panel. S/N contours correspond to 3, 4, and 5σ and then increase in steps of 2σ. |
All Tables
All Figures
|
Fig. 1. Histograms showing the distribution of redshift (left), stellar mass (center), and SFR (right) for the CRISTAL (green), ALPINE (gray; Le Fèvre et al. 2020; Béthermin et al. 2020; Faisst et al. 2020a), and REBELS samples (gold; Bouwens et al. 2022). |
| In the text | |
|
Fig. 2. Stellar mass-SFR plane for galaxies between 4 ≲ z ≲ 6. The CRISTAL sample consists of 39 star-forming galaxies between 4 ≲ z ≲ 6 that are representative of the population of massive (M⋆ ≳ 109 M⊙) galaxies at this redshift range. CRISTAL galaxies are shown as green circles, color-coded according to their redshift. The main sequence of star-forming galaxies at z = 5 is shown following the calibrations by Speagle et al. (2014) (with ±0.5 dex width represented by the shaded orange region), Schreiber et al. (2015), and Khusanova et al. (2021). Galaxies from the pilot programs and drawn from the archive are shown as squares. SMGs in the CRISTAL fields are shown as stars. Star-forming galaxies detected in [C II] line emission observed as part of the ALPINE survey (Le Fèvre et al. 2020; Béthermin et al. 2020; Faisst et al. 2020a) are shown as gray circles. |
| In the text | |
|
Fig. 3. Histogram showing the distribution of observing time (first panel), synthesized beam size (second panel), noise measured in the cubes for 20 km s−1 channels (third panel), and Band 7 continuum (fourth panel). The average values for ALPINE galaxies (Le Fèvre et al. 2020; Béthermin et al. 2020; Faisst et al. 2020a) are indicated by a gray line. |
| In the text | |
|
Fig. 4. Comparison between the ALPINE and CRISTAL [C II] observations of the CRISTAL-05 galaxy at z = 5.5 (Posses et al. 2025). Top: [C II] integrated intensity map based on the ALPINE Natural weighting observations (left), and the CRISTAL higher-angular observations using the Natural (without applying a uv-taper; center) and Briggs (right) weighting. Bottom: Similar to the top panels, but this time showing the [C II] velocity field. |
| In the text | |
|
Fig. 5. [C II] 158 μm line surveys of typical or main-sequence star-forming galaxies as a function of redshift. The surveys included are: Herschel Space Observatory-based KINGFISH (Kennicutt et al. 2011) and SHINING (Graciá-Carpio et al. 2011; Herrera-Camus et al. 2018a,b), as well as ALMA-based ALPINE (Le Fèvre et al. 2020; Béthermin et al. 2020; Faisst et al. 2020a), REBELS (Bouwens et al. 2022), and CRISTAL (Zanella et al. 2018). The circles represent the average redshift and physical angular resolution (in kiloparsecs) achieved by each survey. The circle sizes indicate the number of galaxies detected in [C II] line emission in these surveys (also listed inside each circle). The gray boxes indicate the full range of redshift and angular resolution covered by each survey. The color bar illustrates the sensitivity achieved in 200 km s−1 channels, except for the Herschel-based surveys. |
| In the text | |
|
Fig. 6. [C II] 158 μm line spectra for all the star-forming galaxies in the CRISTAL sample listed in Table A.1, except for CRISTAL-18 which is undetected. [C II] line intensities are arbitrary. |
| In the text | |
|
Fig. 7. [C II] integrated flux measured from the CRISTAL and ALPINE data. The colorscale represents the S/N of the integrated line detection in the ALPINE data (Béthermin et al. 2020). In general there is good agreement between the CRISTAL and ALPINE fluxes, except for four systems that were detected with S/N ≲5 in the ALPINE data. |
| In the text | |
|
Fig. 8. Position in the sky of the CRISTAL galaxies including the JWST pointings footprints from programs COSMOS-Web, PRIMER, JADES, and FRESCO, and HST pointings footprints from programs COSMOS-DASH, CANDELS, and 3D-HST. CRISTAL galaxies from the original sample, pilot programs, and extracted from the ALMA archive are shown as red circles, blue squares, and magenta diamonds, respectively. SMGs in the field of CRISTAL galaxies are shown as orange triangles. CRISTAL galaxies that are not part of large HST surveys are covered by individual HST programs. |
| In the text | |
|
Fig. 9. [C II] integrated line emission maps for the CRISTAL galaxies, constructed from the naturally weighted cubes. All maps have been scaled to the same physical size, indicated by a white line on the left side representing 6 kpc. The colorscale represents the integrated flux emission, and the contours correspond to [3, 4, 5, 7, 9, 11, 13, 15]σ, except for CRISTAL-01, where the emission intensity is shown in logarithmic scale and the contours represent the [4, 6, 8, 10, 50, 150]σ levels (the last two in red). The beam is shown in the lower left corner of each panel. |
| In the text | |
|
Fig. 10. JWST composite images of CRISTAL galaxies, overlaid with [C II] line emission (white contours) and dust continuum emission (pink contours). Contour levels correspond to [3, 5, 10]σ, except for CRISTAL-01, where the emission intensity is shown on a logarithmic scale, and contours represent [4, 6, 8, 20, 60, 100]σ levels. All maps are scaled to the same physical size, with a 6 kpc scale bar shown as a white line on the left side of each panel. For galaxies CRISTAL-10, -20, -22, and -23 we show the HST composite images as there are no JWST/NIRCam observations available. |
| In the text | |
|
Fig. 11. Multiwavelength view of the CRISTAL galaxies including from left to right: integrated [C II] line emission, [C II]-based velocity field, dust continuum emission, [C II] and dust continuum emission overlaid on a composite image based on HST/WFC3 and JWST/NIRCam observations. The redshift, stellar mass, and SFR are listed in the top left corner of the second panel. S/N contours correspond to 3, 4, and 5σ and then increase in steps of 2σ, except for CRISTAL-01, where the emission intensity is shown in logarithmic scale and the contours represent the [4, 6, 8, 10, 50, 150]σ levels (the last two in red). Additional figures showing the multiwavelength view of the remaining CRISTAL galaxies are included in Appendix E. |
| In the text | |
|
Fig. 12. Left: Multiwavelength view of CRISTAL-10, a main-sequence star-forming galaxy at z = 5.67. The background image is a composite of three HST/WFC3 filters, highlighting the rest-frame UV stellar light emitted by young, massive stars. Overlaid on this image are white contours showing the integrated [C II] line emission (3, 4, 5, 7 and 10σ levels), and orange contours showing the dust continuum emission at rest-frame 158 μm (2.5, 3, 4 and 5σ levels). The dust continuum reveals two distinct peaks, designated as Region 1 and Region 2. In Region 1, the dust continuum emission lacks a corresponding rest-frame UV light counterpart, and the [C II] line emission is faint. Region 2, on the other hand, correspond to a star-forming region where the rest-frame UV, dust, and [C II] line emission peak. Right: [C II]/FIR luminosity ratio as a function of the FIR luminosity observed in nearby star-forming galaxies and starbursts (beige points; Lutz et al. 2016; Herrera-Camus et al. 2018b) and high-z star-forming galaxies (gray points; Spilker et al. 2016, and references therein). The [C II]/FIR luminosity ratio measured in the star-forming Region 2 (light blue circle) is comparable to that measured in the dense PDR of the Orion complex, while the [C II]/FIR luminosity ratio of Region 1 (yellow) is significantly low, comparable only to extreme local systems such as Arp 220 (e.g., Luhman et al. 1998, 2003), characterized by deeply embedded star formation. The FIR luminosities where measured based on the Band 7 continuum using the conversion factor by Béthermin et al. (2020) and assuming a dust temperature of 50 K. The diagonal line represents how much the measurements of Regions 1 and 2 change if we assume a dust temperature of 40 K and 60 K. We also show the global value (orange circle) measured using the LFIR in Mitsuhashi et al. (2024) and the integrated [C II] flux from Table 1. |
| In the text | |
|
Fig. 13. Left: Composite image based on three JWST/NIRCam blue filters (F090W, F115W, F150W) that show the stellar light from multiple young stellar clumps in CRISTAL-13, a main-sequence star-forming galaxy at z = 4.58. Overlaid are the integrated [C II] line emission (white contours; ) and the dust continuum (orange; ). The ALMA beam is shown in the lower right corner. Right: Cartoon representation of the distribution of the stellar clumps traced by JWST (blue and green), the cold gas traced by the [C II] line (red), and the dust continuum (orange). The properties of the stellar clumps are based on the SED modeling presented in Lines et al. (2025). |
| In the text | |
|
Fig. 14. Left: [C II]/FIR luminosity ratio as a function of the FIR luminosity observed in nearby star-forming galaxies and starbursts (beige points; Lutz et al. 2016; Herrera-Camus et al. 2018b) and high-z star-forming galaxies (gray points; Spilker et al. 2016, and references therein). CRISTAL galaxies are shown as gray points with green borders. As a reference, the y axis on the right shows the [C II]/FIR luminosity ratio normalized to the value measured in the dense PDR of the Orion Nebula (L[CII]/LFIR = 1.1 × 10⁻³; Goicoechea et al. 2015). The predictions from the models by Narayanan & Krumholz (2017) of how the relation between L[CII]/LFIR and LFIR changes if the molecular gas content increase by a factor of ×10 are shown as light-blue lines. The solid golden line represents the running median for z ≈ 0 galaxies, while the dashed lines indicate the 10th and 90th percentiles. Right: Similar to the left panel, but this time we plot the [C II]/FIR luminosity ratio as a function of the FIR surface brightness (ΣFIR). The best fit to the data at z ≈ 0 (Lutz et al. 2016; Herrera-Camus et al. 2018b) and z ≈ 3 − 6 (this work; Eq. (2)) are shown as beige and gray lines, respectively. |
| In the text | |
|
Fig. E.1. Multiwavelength view of the CRISTAL galaxies including from left to right: integrated [C II] line emission, [C II]-based velocity field, dust continuum emission, [C II] and dust continuum emission overlaid on a composite image based on HST/WFC3 and JWST/NIRCam observations. The redshift, stellar mass, and SFR are listed in the top left corner of the second panel. S/N contours correspond to 3, 4, and 5σ and then increase in steps of 2σ. |
| In the text | |
|
Fig. E.2. Multiwavelength view of the CRISTAL galaxies including from left to right: integrated [C II] line emission, [C II]-based velocity field, dust continuum emission, [C II] and dust continuum emission overlaid on a composite image based on HST/WFC3 and JWST/NIRCam observations. The redshift, stellar mass, and SFR are listed in the top left corner of the second panel. S/N contours correspond to 3, 4, and 5σ and then increase in steps of 2σ. |
| In the text | |
|
Fig. E.3. Multiwavelength view of the CRISTAL galaxies including from left to right: integrated [C II] line emission, [C II]-based velocity field, dust continuum emission, [C II] and dust continuum emission overlaid on a composite image based on HST/WFC3 and JWST/NIRCam observations. The redshift, stellar mass, and SFR are listed in the top left corner of the second panel. S/N contours correspond to 3, 4, and 5σ and then increase in steps of 2σ. |
| In the text | |
|
Fig. E.4. Multiwavelength view of the CRISTAL galaxies including from left to right: integrated [C II] line emission, [C II]-based velocity field, dust continuum emission, [C II] and dust continuum emission overlaid on a composite image based on HST/WFC3 and JWST/NIRCam observations. The redshift, stellar mass, and SFR are listed in the top left corner of the second panel. S/N contours correspond to 3, 4, and 5σ and then increase in steps of 2σ. |
| In the text | |
|
Fig. E.5. Multiwavelength view of the CRISTAL galaxies including from left to right: integrated [C II] line emission, [C II]-based velocity field, dust continuum emission, [C II] and dust continuum emission overlaid on a composite image based on HST/WFC3 and JWST/NIRCam observations. The redshift, stellar mass, and SFR are listed in the top left corner of the second panel. S/N contours correspond to 3, 4, and 5σ and then increase in steps of 2σ. |
| In the text | |
Current usage metrics show cumulative count of Article Views (full-text article views including HTML views, PDF and ePub downloads, according to the available data) and Abstracts Views on Vision4Press platform.
Data correspond to usage on the plateform after 2015. The current usage metrics is available 48-96 hours after online publication and is updated daily on week days.
Initial download of the metrics may take a while.