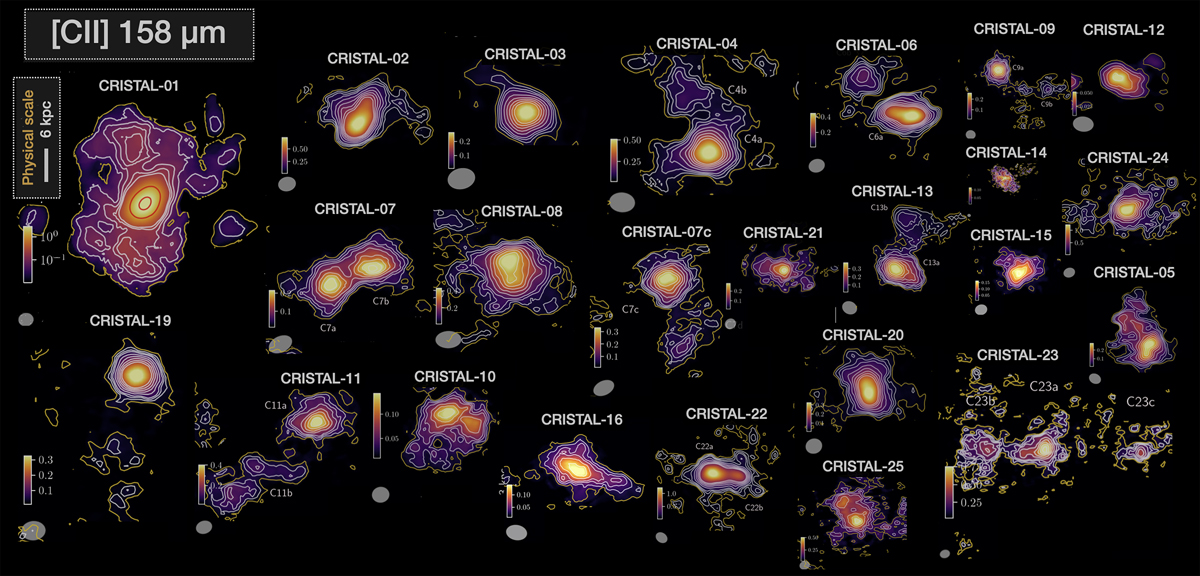
Fig. 9.
Download original image
[C II] integrated line emission maps for the CRISTAL galaxies, constructed from the naturally weighted cubes. All maps have been scaled to the same physical size, indicated by a white line on the left side representing 6 kpc. The colorscale represents the integrated flux emission, and the contours correspond to [3, 4, 5, 7, 9, 11, 13, 15]σ, except for CRISTAL-01, where the emission intensity is shown in logarithmic scale and the contours represent the [4, 6, 8, 10, 50, 150]σ levels (the last two in red). The beam is shown in the lower left corner of each panel.
Current usage metrics show cumulative count of Article Views (full-text article views including HTML views, PDF and ePub downloads, according to the available data) and Abstracts Views on Vision4Press platform.
Data correspond to usage on the plateform after 2015. The current usage metrics is available 48-96 hours after online publication and is updated daily on week days.
Initial download of the metrics may take a while.