| Issue |
A&A
Volume 699, July 2025
|
|
|---|---|---|
| Article Number | A256 | |
| Number of page(s) | 25 | |
| Section | Extragalactic astronomy | |
| DOI | https://doi.org/10.1051/0004-6361/202449843 | |
| Published online | 17 July 2025 | |
The ALMA-CRISTAL survey: Extended [CII] emission in an interacting galaxy system at z ∼ 5.5
1
Instituto de Estudios Astrofísicos, Facultad de Ingeniería y Ciencias, Universidad Diego Portales, Av. Ejército Libertador 441, Santiago 8370191, Chile
2
Instituto de Astrofísica, Facultad de Física, Pontifícia Universidad Católica de Chile, Santiago 7820436, Chile
3
Las Campanas Observatory, Carnegie Institution of Washington, Casilla 601, La Serena, Chile
4
Max-Planck-Institut für Extraterrestiche Physik (MPE), Giessen-bachstr., 85748, Garching, Germany
5
Institute of Astrophysics, Foundation for Research and Technology-Hellas (FORTH), Heraklion, GR-70013, Greece
6
School of Sciences, European University Cyprus, Diogenes street, Engomi, 1516 Nicosia, Cyprus
7
National Radio Astronomy Observatory, 520 Edgemont Road, Charlottesville, VA 22903, USA
8
Department of Astronomy, University of Virginia, 530 McCormick Road, Charlottesville, VA 22903, USA
9
Departamento de Astronomía, Facultad Ciencias Físicas y Matemáticas, Universidad de Concepción, Av. Esteban Iturra s/n Barrio Universitario, Casilla 160, Concepción, Chile
10
INAF, Istituto di Radioastronomia – Italian node of the ALMA Regional Centre (It-ARC), Via Gobetti 101, 40129 Bologna, Italy
11
Dipartimento di Chimica, Università degli Studi di Roma “La Sapienza”, P.le Aldo Moro 5, 00185 Roma, Italy
12
Jodrell Bank Centre for Astrophysics, Department of Physics and Astronomy, School of Natural Sciences, The University of Manchester, Manchester, M13 9PL, UK
13
European Southern Observatory, Karl-Schwarzschild-Str. 2, D-85748, Garching, Germany
14
International Centre for Radio Astronomy Research, University of Western Australia, 35 Stirling Hwy, Crawley 26WA 6009, Australia
15
ARC Centre of Excellence for All Sky Astrophysics in 3 Dimensions (ASTRO 3D), Australia
16
Sterrenkundig Observatorium, Ghent University, Krijgslaan 281-S9, B-9000 Ghent, Belgium
17
Scuola Normale Superiore, Piazza dei Cavalieri 7, 50126 Pisa, Italy
18
Centre for Astrophysics and Supercomputing, Swinburne Univ. of Technology, PO Box 218, Hawthorn, VIC, 3122, Australia
19
Department of Astronomical Science, SOKENDAI (The Graduate University for Advanced Studies), Mitaka, Tokyo 181-8588, Japan
20
National Astronomical Observatory of Japan, 2-21-1 Osawa, Mitaka, Tokyo 181-8588, Japan
21
Department of Astronomy, The University of Tokyo, 7-3-1 Hongo, Bunkyo, Tokyo 113-0033, Japan
22
Dept. Fisica Teorica y del Cosmos, Universidad de Granada, Granada, Spain
23
Instituto Universitario Carlos I de Física Teórica y Computacional, Universidad de Granada, E-18071 Granada, Spain
24
Department of Physics and Astronomy and George P. and Cynthia Woods Mitchell Institute for Fundamental Physics and Astronomy, Texas A&M University, College Station, TX, USA
25
Max-Planck Institute for Astrophysics, Karl Schwarzschildstrasse 1, 85748, Garching, Germany
26
Faculty of Engineering, Hokkai-Gakuen University, Toyohira-ku, Sapporo 062-8605, Japan
27
Ioffe Institute, 26 Politekhnicheskaya, St. Petersburg, 194021, Russia
28
Cavendish Laboratory, University of Cambridge, 19 J.J. Thomson Avenue, Cambridge, CB3 0HE, UK
29
Kavli Institute for Cosmology, University of Cambridge, Madingley Road, Cambridge, CB3 0HA, UK
⋆ Corresponding author: This email address is being protected from spambots. You need JavaScript enabled to view it.
Received:
4
March
2024
Accepted:
9
May
2025
Abstract
The ALMA [C II] Resolved Ism in STar-forming gALaxies (CRISTAL) survey is a Cycle 8 ALMA Large Program that studies the cold- gas component of high-redshift galaxies. Its subarcsecond-resolution observations are key to distinguishing physical mechanisms that shaped galaxies during cosmic dawn. In this paper, we explore the morphology and kinematics of the cold gas, star-forming, and stellar components in the star-forming main-sequence galaxy CRISTAL-05/HZ3, at z = 5.54. Our analysis includes ALMA observations at a spatial resolution of 0.3″ (∼2 kpc) of the [C II] line. While CRISTAL-05 was previously classified as a single source, our observations reveal that the system is a close interacting pair that is surrounded by an extended component of carbon-enriched gas. This is imprinted in the disturbed elongated [C II] morphology and in the separation of the two components in the position-velocity diagram (∼100 km s−1 ). The central region is composed of two components, named C05-NW and C05-SE, and the former is the dominant component. A significant fraction of [C II] arises beyond the close pair up to 10 kpc, while the regions forming new massive stars and the stellar component seem compact (r[C II] ∼4 × rUV), as traced by rest-frame UV and optical imaging obtained with the Hubble Space Telescope and the James Webb Space Telescope. Our kinematic model, constructed using the DYSMALpy software, yields a minor contribution of dark matter of C05-NW within a radius of ∼2 × Reff. Finally, we explore the resolved [C II] /far-IR ratios as a proxy for shock-heating produced by this merger. We argue that the extended [C II] emission is mainly caused by the merger of the galaxies, which could not be discerned with lower-resolution observations. Our work emphasizes the need for high-resolution observations to fully characterize the dynamic stages of infant galaxies and the physical mechanisms that drive the metal enrichment of the circumgalactic medium.
Key words: galaxies: evolution / galaxies: high-redshift / galaxies: interactions / galaxies: ISM / galaxies: kinematics and dynamics / galaxies: structure
© The Authors 2025
 Open Access article, published by EDP Sciences, under the terms of the Creative Commons Attribution License (https://creativecommons.org/licenses/by/4.0), which permits unrestricted use, distribution, and reproduction in any medium, provided the original work is properly cited.
This article is published in open access under the Subscribe to Open model. This email address is being protected from spambots. You need JavaScript enabled to view it. to support open access publication.
1. Introduction
Galaxy growth is governed by an interplay of several physical processes that transform the internal galactic properties across cosmic time (Somerville & Davé 2015; Tumlinson et al. 2017; Naab & Ostriker 2017). The current paradigm of galaxy evolution suggests that gas accretion from the intergalactic medium and intense merger activity provides cold gas to fuel star formation in a galaxy, while active galactic nuclei (AGN) and stellar feedback can deplete and expel the internal gas from the interstellar medium (ISM), which eventually halts star formation (Berry 2015; Barnes & Hernquist 1991; Sanders & Mirabel 1996; Lambas et al. 2012; Sánchez Almeida et al. 2014; Hayward & Hopkins 2016; Harrison 2017). We currently take the first steps of detecting and characterizing the full baryonic cycle in the early stages of galaxy formation.
Since these intricate physical mechanisms shape the spatial distribution of the baryonic matter, the morphology becomes the primary indicator of the evolutionary history of these systems. For example, when dynamical events occur, such as mergers and outflows, they can become disrupted and distorted (Somerville & Davé 2015; Nelson et al. 2019; Pillepich et al. 2019). Furthermore, the diversity of shapes of low-redshift galaxies correlates with several physical properties, such as the stellar mass, the star formation histories, and the environment (Baldry et al. 2004; De Lucia et al. 2006; Poggianti et al. 2010; Tojeiro et al. 2013; Villanueva et al. 2021). For instance, elliptical and lenticular galaxies preferentially reside in high-density environments and populate especially the cores of clusters and groups, while spiral galaxies inhabit field regions (Dressler 1980; Postman et al. 2005). High-redshift galaxies (i.e., distant galaxies) are fainter, have a smaller angular size, and are subject to cosmological dimming, however. This means that subtle features are hard to detect, and thus, it is hard to determine the physical mechanisms that shaped them.
Most spatially resolved studies of high-redshift galaxies rely on rest-UV imaging from the Hubble Space Telescope (HST) because it was the only instrument that provided a sufficiently high spatial resolution and depth to reveal the inner structures of small galaxies at these wavelengths. These observations might suggest that galaxies at z>4 are clumpy and irregular, which would indicate a high merger activity in the first billion years of the Universe (Conselice & Arnold 2009; Duncan et al. 2019; Shibuya et al. 2022). The HST imaging may not provide a full answer, however, because the rest-UV emission is strongly affected by dust obscuration and biased toward the most intense ongoing star-forming sites. Recent rest-frame near-infrared imaging with the James Webb Space Telescope (JWST) has revealed that many of these clumps are just the compact star-forming regions of disk galaxies that surprisingly became a common population (∼50%) at z = 3–6 (Ferreira et al. 2022; Guo et al. 2023; Kartaltepe et al. 2023; Huertas-Company et al. 2024).
A complete picture of the evolutionary path of galaxies inevitably requires information on the cold-gas supply necessary to form stars. The start of operation of the Atacama Large Millimeter/submillimeter Array (ALMA) in the past decade was the pivotal point for a new era in which the gas at high redshift could be assessed on subarcsecond scales. The cornerstone of these groundbreaking studies was the [C II] emission line, which arises from the fine-structure transition 2P3/2⇒2P1/2 of the singly ionized carbon atom (hereafter just [C II] , centered at 158 μm). This is one of the strongest far-infrared (FIR) lines and reaches up to 1% of the total bolometric luminosity (Stacey et al. 2010; Díaz-Santos et al. 2013; Cormier et al. 2015; Herrera-Camus et al. 2018; Rybak et al. 2019; Schaerer et al. 2020). Due to its low ionization potential of 11.2 eV, it is a dominant gas coolant in the neutral ISM that comes from photodissociation regions (PDR), cold molecular, ionized, and atomic gas phases (Wolfire et al. 2003; Vallini et al. 2015; Clark et al. 2019).
A remarkable outcome of recent studies of the spatial distribution of the gas- and star-forming components of galaxies at z = 4−6 is the existence of extended [C II] line emission that reaches out to a radius of ∼10 kpc, or about 5× beyond the extent of the star-forming areas traced by rest-UV and dust continua (Fujimoto et al. 2019). These so-called [C II] halos were first identified by Fujimoto et al. (2019) through the radial profiles of stacked [C II] emission of 18 normal (LUV>0.6 L*) star-forming galaxies at z>4 that were selected as single systems without obvious AGN signatures. Several studies have found similar [C II] structures in individual star-forming galaxies at z>4 (Fujimoto et al. 2020; Herrera-Camus et al. 2021; Akins et al. 2022; Lambert et al. 2023; Ikeda et al. 2025) and massive quasar host galaxies at z>6 (Maiolino et al. 2012; Cicone et al. 2015; Meyer et al. 2022). [C II] halos appear to be ubiquitous in the most massive galaxies, but are less relevant in lower-mass systems (M*≲1010 M⊙) (Fujimoto et al. 2020; Posses et al. 2023; Pizzati et al. 2023).
The presence of emitted carbon-rich gas beyond galactic sizes raises the question of how the enriched gas was transported to larger distances while remaining in a singly ionized state. Mock observations based on the most recent cosmological simulations failed to reproduce the [C II] surface brightness of observed galaxies (Fujimoto et al. 2019; Pallottini et al. 2019; Arata et al. 2020). Several physical mechanisms for the origin of these halos have been proposed in the literature, including unresolved satellite galaxies around the central source, extended photodissociation, or H II regions, cold streams, and outflows (Fujimoto et al. 2019; Di Cesare et al. 2024). Several studies have detected broad components in the [C II] spectrum of stacked and individual galaxies, which suggests that the [C II] halos are the result of past and/or ongoing episodes of outflowing gas driven by powerful stellar feedback (Gallerani et al. 2018; Ginolfi et al. 2020a; Herrera-Camus et al. 2021). This is supported by recent semianalytical models of catastrophically cooling outflows (T≈102−4 K), which can reproduce the observed [C II] surface brightness profiles (Pizzati et al. 2020, 2023).
An additional scenario was proposed by Ginolfi et al. (2020b), who identified a luminous envelope of [C II] emission surrounding a dense merging system at z ∼ 4.5. This phenomenon leads to tidal stripping, where the gas is removed from the ISM and enriches the circumgalactic medium (CGM) with chemically enhanced material. Similarly, Lambert et al. (2023) reported a [C II] extended emission in a typical galaxy at z = 5.25, showing indications of a late-stage merger rather than outflow signatures. Most studies relied on observations with a resolution of ∼1″ (∼5 kpc), which can resolve the current 10 kpc halos in fewer than two resolution units. The understanding of the dynamic state of these systems that can support or rule out the last scenario is also constrained by the resolution and depth of the observation because they impact the determination of the nature of single/multiple sources (Rizzo et al. 2022; Förster Schreiber & Wuyts 2020).
In this context, the ALMA large program CRISTAL ( [C II] Resolved Ism in STar-forming gALaxies) survey provides the resolution and depth needed to constrain the critical conditions to solve these open questions (2021.1.00280.L; Herrera-Camus et al. in prep.). CRISTAL aims to dissect the [C II] and dust continuum in 25 main-sequence star-forming galaxies at z = 4 – 6 with available ALMA lower-resolution observations and UV continuum detections. The CRISTAL observations are more sensitive and have a higher spatial resolution than previous observations. They resolve these galaxies at 1–2 kpc scales, which is crucial to confirm the detection and identify the physical mechanisms powering the emission at these distances. This paper, as part of the following series of CRISTAL results (Mitsuhashi et al. 2024; Solimano et al. 2024), reports our analysis of the compelling case of the main-sequence star-forming galaxy HZ3, identified in the survey as CRISTAL-05, at z = 5.54 (Capak et al. 2015). This was one of the galaxies reported by Fujimoto et al. (2020) to host a [C II] halo, but still had an uncertain description of the spatial and dynamical internal structure. We took advantage of the deepest ALMA integration in the CRISTAL sample (8.8 μJy/beam), owing to previous deep pilot observations, to study the nature of the system and the origin of the puzzling [C II] halo. Throughout the paper, we refer to a [C II] halo as extended [C II] emission. As discussed by Lambert et al. (2023), this nomenclature has become ubiquitous throughout the literature. At the same time, this is an unusual use of the term halo, however, because the well-establish halo component (dark matter halos, stellar halos, and galactic halos) refers to a spheroidal shape about which we cannot conclude based on the current resolution.
This paper is laid out as follows. First, we describe the general properties of the galaxy as well as the ALMA observations and ancillary data in Section 2. In Section 3 we detail the main results: We characterize the morphology of the [C II] emission and compare it to the rest-frame UV and dust continuum. We also quantify the multiwavelength morphology and sizes. The gas motions are then determined by the moment-1 and moment-2 maps and with a position-velocity diagram. After this, we dissect the substructure of the system into different components with a clump-finding algorithm. We finally perform a kinematical disk modeling of one of the components of CRISTAL-05. Section 4 presents a discussion of the results of the previous section. The paper finally ends in Section 5 with a summary and the main conclusions of the work. We assume a standard flat ΛCDM model with ΩΛ = 0.7, ΩM = 0.3, and H0 = 70 km s−1 Mpc−1, which implies a physical factor of 5.961 kpc/″at the redshift of the source.
2. Observations and data reduction
2.1. Target: CRISTAL-05
CRISTAL-05 (also known as HZ3 and COSMOS2015 683613, Capak et al. 2015; Laigle et al. 2016) was identified as a Lyman-break galaxy candidate at z ∼ 5 in the Cosmic Evolution Survey (COSMOS, Laigle et al. 2016), and it was spectroscopically confirmed based on UV absorption lines (Ilbert et al. 2013). An ALMA follow-up revealed bright [C II] emission at z[C II] = 5.546±0.004 (Capak et al. 2015). Its UV-optical derived stellar mass and star formation rate (SFR) place CRISTAL-05 on the main-sequence relation at z ∼ 5.5 (e.g., Speagle et al. 2014) and with LUV ∼ L*. As a typical star-forming galaxy at its redshift, it was thus included as part of the ALMA Large Program to Investigate C+ at Early Times survey (ALPINE, Le Fèvre et al. 2020; Béthermin et al. 2020; Faisst et al. 2020). Le Fèvre et al. (2020) classified it as an extended dispersion-dominated system, based on a morpho-kinematic analysis, but a more detailed analysis by Jones et al. (2021) updated it to an uncertain classification as it revealed a potential blue compact source in the south portion of the galaxy. Carniani et al. (2018) found that while the galaxy deviates positively from the local L[C II] -SFR relation, it presents a [C II] deficiency in the Σ[C II] – ΣSFR parameter space. Finally, Fujimoto et al. (2020) found that the [C II] emission extends up to 10 kpc, with an effective radius exceeding the rest-frame UV effective radius by a factor of 2, being thus identified as one of the individual detections of [C II] halos.
In summary, the galaxy is a typical star-forming galaxy in the first billion years of the Universe with a complex morpho-kinematical structure and [C II] extended emission. CRISTAL-05 is an ideal target to study mechanisms leading to [C II] emission at large distances. The full description of the sample selection, science goals, and data products of the CRISTAL survey will be described in Herrera-Camus et al. (in prep.).
2.2. ALMA observations
We combined the available Band 7 ALMA observations of CRISTAL-05: ALPINE survey in configuration C43-2 (PI: Le Fèvre, ID: 2017.1.00428.L), CRISTAL pilot program in configuration C43-5 (PI: Manuel Aravena, ID: 2018.1.01359.S) and CRISTAL observations in the configurations C43-2 and C43-5 (PI: Rodrigo Herrera-Camus, ID:2021.1.00280.L). The observations have total on-source times of 22, 136, 92, and 24 minutes, respectively. All observations aimed at detecting the [C II] emission line (νobs = 290.6 GHz) and FIR dust continuum in four spectral windows. The different programs use slightly different spectral setups and array configurations but with the frequency range for the [C II] line emission well covered. In all cases, four spectral windows were used with an individual usable bandwidth of 1875 MHz.
2.2.1. Data reduction and JvM correction
Data calibration and a combination of the different observations were performed using the CASA software (Bean 2022). We processed the datasets from the different programs using the corresponding pipeline versions: 5.6.1 for the ALPINE program, 5.6.1 for the CRISTAL pilot program, and finally, version 6.5.2 for the CRISTAL program. No extra manual flagging was needed beyond what was already identified by the observatory and automatically flagged by each pipeline. We combined the calibrated datasets into a single measurement set (ms) used to create the images and data cubes, using the task CONCAT. This task and the following procedure are performed using version 6.5.2 of CASA software. We identified the emission lines and continuum emission in the initial multifrequency synthesis (mfs) images and data cubes of all the available spectral windows (SPWs) to then create the line-free continuum images and subtract the continuum emission using UVCONTSUB with FITORDER = 0.
We created the final product using task TCLEAN and the auto-multithresh algorithm. This mode automatically masks regions based on the signal-to-noise of the emission in the image. How these regions are created depends on the following parameters: SIDELOBETHRESHOLD = 2, NOISETHRESHOLD = 4.5, LOWNOISETHRESHOLD = 2, and MINBEAMFRAC = 0.0. This value choice is intended to match similar results when using manual cleaning. In all the cases, the cleaning was performed down to 1σ by selecting NSIGMA = 1 where σ is estimated automatically by TCLEAN using robust statistics (σ = 1.4826×MAD, with MAD being the median absolute deviation). We mainly worked on the products created using a Briggs weighting scheme (Briggs 1995) with ROBUST = 2, but some auxiliary inspections were carried out on the products with ROBUST = 0.5 (Section 3.2). All the products have a pixel size of 0.0245″ pix−1, and the reference frequency of the [C II] emission is the same as defined to the source in the ALPINE catalog, that is, ν[C II] = 290.541 GHz (Le Fèvre et al. 2020).
The primary motivation for cleaning down to such a low threshold of NSIGMA = 1 was to minimize the JvM effect (Jorsater & van Moorsel 1995; Czekala et al. 2021). This effect occurs when combining multiple array configurations of an interferometer, which can produce a nonideal baseline distribution and a synthesized beam that will depart from an ideal Gaussian beam. In these cases, the TCLEAN algorithm can produce final images that mix dirty and clean beam units and incorrect recovered fluxes. To correct for the JvM effect, we applied in all the products the correction suggested by Czekala et al. (2021) that compares the volumes of the clean and dirty beams to determine an ϵ correction parameter to apply to the residuals. In the case of the data cubes, the correction was estimated at the channel closer to the peak of the [C II] line and applied to all channels. The correction factors for all the products we have used in this article lie within the range of ϵ = 0.3−0.4. To assess the influence of this effect on our measurements, the total flux density of CRISTAL-05 is approximately 2.5× larger in the non-JvM-corrected cube compared to the corrected one when extracted within a circular aperture of 1.5″ centered on the source. Czekala et al. (2021) suggested that the ideal cleaning depth for balancing the number of spurious CLEAN components with the flux retained in the residual map is 4-σ. They also noted that using a threshold of 1σ can introduce pure noise components into the final clean image. In our analysis, we compared the two cleaning approaches and found no evidence of over-cleaning or any significant differences in the results presented in this paper. A more detailed description of the data reduction and JvM correction is covered in Gonzalez-Lopez et al, in prep. We summarize the noise level and the synthesized beam sizes of the products used along the following sections in Table 1.
Properties of the main ALMA products.
Finally, one downside of using this correction is that it also affects the background of the images and cubes. The root mean square (rms) of the JvM-corrected background is reduced by a factor of ϵ, no longer accurately reflecting the sensitivity for point-like sources. Consequently, for visualization purposes, we display the non-JvM-corrected products with contour levels representing the true sensitivity to point-like sources. While some images may exhibit emissions overestimated due to the JvM effect, all corresponding analyses were conducted using the JvM-corrected products.
2.3. HST observations
We use the available HST/WFC3 NIR imaging of CRISTAL-05 as part of the Cosmic Assembly Near-IR Deep Extragalactic Legacy Survey (CANDELS, PI: Sandra Faber, ID: 12440). Observations were performed in 2015 in 1 orbit per filter for the F105W (1.05 μm), F125W (1.25 μm), F140W (1.4 μm), and F160w (1.54 μm) filters. For a galaxy at z ∼ 5.5, these filters correspond to the rest-frame UV emission centered at 1605 Å, 1911 Å, 2150 Å and 2450 Å, respectively. Raw images were re-calibrated using the latest versions of the GRIZLI pipeline and the astrometry was corrected using PAN-STARSS and GAIA stars, leading to an uncertainty of about 0.1″. All images have a point spread function (PSF) with a full-width half maximum of FWHM = 0.2″ and a pixel scale of 0.06″ pixel−1. The unobscured SFRUV is derived by the luminosity measured in the HST/F105W filter, using the calibration provided by Kennicutt & Evans (2012), and assuming a Kroupa IMF (Kroupa & Weidner 2003).
2.4. JWST observations
JWST observed CRISTAL-05 as part of the PRIMER program (GO 1837, Dunlop et al. 2021) using the Mid-Infrared Instrument (MIRI) camera, and it was observed for 29.6 minutes. The filter used was F770W, corresponding to the rest-frame near-infrared emission at 1.2 μm. The image has a point spread function (PSF) with a full-width half maximum of FWHM = 0.269″ and a pixel scale of 0.049″ pixel−1.
We also used data from the instrument JWST Near Infrared Camera (NIRCam) as part of the COSMOSWebb program (GO 1727; Casey et al. 2023). The filters F150W, F277W, and F444W were used, which correspond to rest-frame wavelengths of 0.23 μm (near-ultraviolet), 0.42 μm (optical), and 0.68 μm (optical) at the source's redshift. Each image has a total exposure time of 17.2 minutes. The F150W filter has a pixel size of 0.03″ and a point spread function (PSF) of 0.05″, while the F277W and F444W filters have a pixel size of 0.06″, with PSFs of 0.092″ and 0.145″, respectively.
The data from both programs were calibrated using the latest version of the JWST pipeline and astrometrically corrected by referencing both GAIA stars and sources detected by HST within the same field.
3. Results
3.1. [C II] line and dust emission
We measured the spatially integrated [C II] line profile using a 1.5″ aperture centered at the emission centroid (shown in Table 2). [C II] is detected and best fit by a single-gaussian distribution with FWHM = 238 ± 25 km s−1 and line flux of 1.00 ± 0.07 Jy km s−1, corresponding to a signal-to-noise of S/N = 14. This is consistent with the total flux measured by the ALPINE survey (Le Fèvre et al. 2020), and about 45% higher than the total flux of observations of Capak et al. (2015). The JvM-corrected [C II] spectrum is shown in Figure 1 top panel (solid black line), and the best-fit single Gaussian as the green line. The moderate goodness of the fit (χ2 = 6.5) is explained by the heavy-tail shape of the [C II] distribution, with a blue wing around v < –100 km s−1 . A combination of two Gaussian components better fits the wing and the peak of the emission (χ2 = 5.2), as shown in the bottom panel of Figure 1.
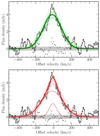 |
Fig. 1. JvM-corrected [C II] spectrum of CRISTAL-05 extracted within a circular aperture with a radius of 1.5″ and centered in the [C II] observed frequency νobs = 292.48 GHz. We display the continuum-subtracted spectrum from the JvM-corrected data cube with a channel resolution of 10 km s−1 (solid black lines in both panels). (a) Top: 1D Gaussian fitting (solid green line) and the residuals (black dots). (b) Spectrum fit with two Gaussian components (solid red line). As in the panel above, the residuals are plotted as black dots. |
Observational and physical properties of CRISTAL-05.
The dust emission was measured by Mitsuhashi et al. (2024), yielding a flux density of S158 μm = 0.118 ± 0.021 mJy. This is a detection with a significance of S/N = 6.7. The global properties of CRISTAL-05, such as spatial centroid, line width, and integrated flux, are summarized in Table 2.
3.2. Gas motion
We show in Figure 2 the non-JvM-corrected [C II] moment-0 map, derived by collapsing the cube over the full-width tenth maximum of the [C II] line. We aim to resolve the internal structure of CRISTAL-05, and therefore, we display the cube generated by a Briggs weighting (ROBUST = 0.5), yielding a final beam size of 0.21″ × 0.18″ (1.2 × 1.0 kpc). Previous ALMA observations (Capak et al. 2015; Le Fèvre et al. 2020) yielded a significant yet mostly unresolved detection (0.9″∼ 5 kpc) of the [C II] emission line in CRISTAL-05. The current spatial distribution of the [C II] emission differs significantly from these former observations, as CRISTAL-05 now exhibits a double-peaked emission, originating from two components aligned at 25 degrees clockwise from the north axis. The locations of these peaks are denoted by black crosses in Figure 2. In the following sections, we refer to the northern emission distribution as the C05-NW component and the southern emission as the C05-SE component. The C05-NW peak is slightly brighter than the southern one, and their separation is approximately 0.4″ (∼2.4 kpc), at least two times smaller than the resolution of the previous observation.
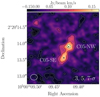 |
Fig. 2. ALMA [C II] moment-0 map (non-JvM corrected). The overlaid black contours correspond to the 3, 5, 7-σ[C II] levels, where σ[C II] = 0.02 Jy/beam km s−1 is the rms noise level. The white ellipse indicates the beam size of 0.21″×0.18″. |
The double-peak shape, revealed by our deeper and more resolved observations, suggests that we are observing a multicomponent system, potentially arising from a close approach of two galaxies or the presence of internal clumps within a single galaxy. We investigate these scenarios by examining the kinematic properties of the gas. High-resolution observations are susceptible to surface brightness dimming. This dimming effect can impact the detection of faint features, such as diffuse gas. To mitigate this possibility, we employ data products generated through natural weighting in the next analyses. This corresponds to a typical beam size of 0.3″, equivalent to 1.8 kpc at the redshift of CRISTAL-05.
We created intensity-weighted velocity maps (moment-1) and intensity-weighted dispersion velocity maps (moment-2) of the [C II] emission, as depicted in the top left and bottom panels of Figure 3. These moments were computed along the channels within the velocity range of [–280,+280] km s−1, encompassing all the emission of the [C II] line (see Figure 1). The averaging only includes pixels in a given channel with an intensity greater than 3 × the rms of the channel. We additionally generated a position-velocity diagram to illustrate how gas motions vary with the position along a predefined slit, as shown in the right panel of Figure 3. The slit is positioned along the major axis of the CRISTAL-05 system (the region between the dashed black lines in the left panels of Figure 3), with a width of 10 pixels, approximately 0.245″.
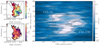 |
Fig. 3. Kinematics of the [C II] emission for CRISTAL-05. (a) Top and (b) bottom left panels: Velocity (moment-1) and dispersion (moment-2) with respect to the observed frequency of [C II] at redshift z = 5.54. The black contours correspond to the 3-, 6-, 9-, 12-σ levels of the [C II] moment-0 map (non-JvM corrected). The dashed black line shows the slit in which we created the position-velocity diagram in the right panel, with the center of the slit as a black cross. The solid black line (black polygon) represents the slit used to generate the pv diagram (spectrum) of Figure 4. (c) Right panel: Position-velocity diagram (non-JvM corrected) along the major axis of CRISTAL-05 with a width of 0.245″. The black contours represent the 3, 5, and 7σpv. |
Examining the moment-1 emission map (left top panel in Figure 3), it is evident that the line-of-sight velocity of the gaseous component is not uniformly distributed across the main system, primarily ranging from –50 to 50 km/s. Along the minor axis of the system, the gas component on the east side of the galaxy appears redshifted from the central velocity of the line (>20 km s−1 ), while the west side presents negative velocities. Similarly, focusing on the central region encompassing both sources (within the black contour exceeding 6σ), a velocity gradient is observed along the major axis for each source. The moment-2 map (bottom left panel of Figure 3) reveals a relatively uniform dispersion velocity but with a notably high average value of 79±21 km s−1 .
An inspection of the position-velocity diagram (right panel of Figure 3) reveals that CRISTAL-05 exhibits a complex kinematic structure comprising at least two components, surrounded by disturbed carbon-rich gas. The position-velocity diagram has been extracted along the major axis of the system (area within the dashed black line in the left panels of Figure 3, centered at (α, δ) = (10:00:09.4252, +2:20:13.771), and PA = 24 deg (zero at the north axis). The overall [C II] emission spreads over a projected angular size of 1″ and, in contrast to the moment-1 map, spans a total line-of-sight velocity from –150 to 100 km s−1 . We can easily pinpoint the two components C05-NW and C05-SE. The C05-NW component extends over 0.7″, equivalent to a physical size of approximately 4 kpc, and over a velocity range from nearly –150 km s−1 to 30 km s−1. This component is the most extended and broad, suggesting that this is the dominant object in the system. It also exhibits a disturbed shape, likely caused by the proximity to C05-SE. Interestingly, the peak of the emission of C05-NW rises in velocity at different positions along the slit. This velocity gradient is commonly interpreted as a signature of rotation or, alternatively, the presence of two unresolved interacting objects (Förster Schreiber & Wuyts 2020). The nature of C05-NW will be further investigated in the next sections. The second subdominant component, C05-SE, is more compact and narrower in the velocity axis, extending for 0.275″ with Δ v ∼ 60 km s−1 . A velocity gradient is not noted in this component, which means that this feature in the south part of the moment-1 map is just a projection effect.
The narrow velocity range in the moment-1 map (–50 to 50 km/s) and the high average dispersion velocity in the moment-2 map can be attributed to beam smearing and the spatial overlap of two components along the line of sight (from –0.25 to 0″), each with distinct velocity distributions. Beam smearing artificially reduces the observed rotational velocity and increases the dispersion (Rizzo et al. 2022). The emission of CRISTAL-05 is resolved across approximately 10 beams, suggesting that the beam may partially affect the velocity distribution. Furthermore, in the pv diagram (right panel of Figure 3), C05-NW dominates the negative velocity range, while C05-SE is confined to positive velocities. The intensity-weighted velocity averages between those of the two components, resulting in a narrower velocity range in the moment-1 map. In the moment-2 map, the distinct velocity distributions produce broader intensity-weighted line widths along the line of sight across the system.
Last, we investigate the kinematic properties of the northeast emission of CRISTAL-05, which encompass the black polygon in the top left panel of Figure 3. In the moment-1 map, the area exhibits mostly emission redshifted to velocities of >50 km s−1. Figure 4 shows the spectra (top) calculated within the area of the polygon and the pv diagram (bottom) across the slit as a solid black line in the top left panel of Figure 3. The black contours pf the pv diagram represent the 3, 5, 7σpv significance levels. The [C II] spectrum shows a double-peak emission centered at –25 km s−1 and +120 km s−1, both detectable in the top and bottom panels. A Gaussian fitting reveals that the blueshifted and redshift emission have flux densities of 3.1 ± 0.5 mJy km s−1 and 1.88 ± 0.004 mJy km s−1, which corresponds to a significance level of 6-σ and 4-σ, respectively. This feature is an indication of the disturbed nature of the system.
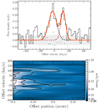 |
Fig. 4. Kinematical properties of the northeast emission of CRISTAL-05. (a) Top panel: [C II] spectrum within the black polygon in the top left panel of Figure 3. The orange solid line corresponds to the spectrum fitting with two Gaussian components, and the residuals are plotted as black dots. (b) Position-velocity diagram along the slit, shown as the solid black line in Figure 3, with a width of 10 pixels. |
3.3. Multicomponent morphologies
In this section, we characterize how star formation (as traced by FIR and rest-frame UV), stellar content (rest-frame optical and near-infrared), and cold gas are distributed across the CRISTAL-05 system. Figure 5 shows the [C II] moment-0 map collapsed over the full-width tenth maximum of the [C II] line (top left panel), the rest-frame UV at 0.2 μm (traced by the HST F140W-band image; bottom left), the rest-frame FIR dust continuum emission at 160 μm (traced by the observed 850 μm continuum; top right), and the rest-frame near-infrared at 1.2 μm (traced by the JWST F770W image; bottom right). The central main panel gathers the information on all the different wavelengths.
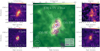 |
Fig. 5. Multiwavelength cutout postage stamps toward CRISTAL-05. (a) Left top panel: ALMA [C II] moment-0 map (non-JvM corrected). The overlaid black contours correspond to the 3, 5, 7, 9, and 11-σ[C II] levels. The white ellipse indicates the beam size of 0.33″×0.27″. (b) Left bottom panel: HST F140W rest-frame UV (0.2μm) continuum image. The overlaid contours correspond to the 3, 10, 17, and 24-σUV levels. The white circle indicates the 0.2″ point spread function. The peak emission is marked as a blue star. (c) Right top panel: non-JvM-corrected ALMA rest-frame 160 μm dust continuum image. The overlaid contours correspond to the 2, 3, 4-σ160. The white ellipse indicates the beam size of 0.33″×0.27″, the same as the [C II] moment-0 resolution. (d) Right lower panel: JWST F770W (1.2 μm) rest-frame near-infrared image. The black contours correspond to 3, 5, 7, and 9σ1.2. The peak emission is marked as a red circle. (e) Central panel: Non-JvM-corrected ALMA [C II] moment-0 map in the background, similar to the left top panel. We display the [C II] peak emission of C05-NW and C05-SE components as black crosses (based on Figure 2). The overlaid green contours correspond to the 3, 6, and 9 σ[C II] levels. The blue dashed lines represent the HST/F140W map, for the 7 and 20σ significance levels. The filled areas correspond to the 160 μm dust continuum emission for the 2, 3, and 4 σ significance levels. |
The [C II] emission is spatially extended across ∼10 resolution elements (top left panel). Although this image has a lower resolution than the Briggs image (ROBUST = 0.5, Figure 2), we can still recover the double-peak shape, with the peak emission of the whole system coinciding with the location of component C05-NW. The major axis of the source extends over 1.2″ (∼7 kpc), which corresponds to be resolved in 8 resolution elements. The emission is elongated from the southeast to the northwest, and now it shows an asymmetric, disturbed shape. As we noted in the previous section, we find emission with significance greater than 3σ extending from the main source toward the northeast, and there is also an emission (>3σ) distant 1″northeast of the galaxy.
Contrary to the [C II] emission, the rest-frame UV image (bottom left panel in Figure 5) shows a compact single source, slightly elongated in the northwest-southeast direction. The peak of the rest-UV emission, shown as a blue star in the left-bottom and central panels of Figure 5, is closer to the peak of C05-NW (0.1″∼ 0.6 kpc, upper black cross in the central panel) than the C05-SE component (0.3″∼ 1.8 kpc). Some rest-UV emission extends into the region between the two [C II] source peaks (dashed blue line in the central panel of Figure 5), however.
We also show in Figure 5 the JWST 1.2 μm image, which traces the rest-frame NIR close to the peak of the stellar emission at z = 5.5 (rest-frame 1.8 μm). This stellar emission is clearly detected and, as with the rest-frame UV, is found to be compact, elongated along the direction of the [C II] emission, and peak (red circle in the central panel) located also close to the C05-NW component (0.07″∼ 0.4 kpc).
The dust continuum emission is detected with a lower significance than [C II] (peak S/N ∼ 3σ) throughout the system. Two components are detected and aligned in the north-south axis, similar to the [C II] emission. As shown in the central panel of Figure 5, the rest-UV emission peaks right in between the two dust components or clumps, which closely follow the location of the [C II] C05-NW and C05-SE components. This suggests that dust obscuration can be one of the causes for the compactness of the rest-frame UV emission and/or that C05-SE is a dust-obscured source. We also detect an emission greater than 3-σ in the south part of the top right and central panels, with no counterpart of UV or [C II] emissions, possibly from a source in a different redshift.
Last, the COSMOSWebb program (Casey et al. 2023) recently released NIRCAM photometry of CRISTAL-05, capturing the rest-frame and near-ultraviolet and optical emission at z = 5.54. In Figure 6, we present an F277W-band image of the galaxy. Overlaid in green contours is the [C II] emission, while the significance contours of the F277W band are shown as dashed lines. In contrast to the shallower MIRI F770W image, the optical emission is not compact; instead, it exhibits an elongated structure stretching from the northwest to the southeast, closely following the central [C II] distribution. The peak of the optical emission aligns with the northern component of the galaxy (C05-NW), as observed in the [C II] map, while the southern region exhibits a weaker emission. As the dust continuum peaks at the same position 5, this may be explained by dust obscuration.
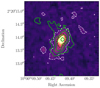 |
Fig. 6. F277W-band image of CRISTAL-05 that captures the rest-frame optical emission at z = 5.54. The black contours denote the 3, 4, 5, and 6σ levels of the F277W band, while the white contours represent the 3, 4, 5, and 6σ contours from the [CII] moment-0 map. |
4. Analysis
4.1. Radial profiles
CRISTAL-05 has compact star-forming and stellar components compared to the gaseous [C II] emission. To quantify these extensions, we compare the effective radii and surface brightness radial profiles of all structural elements. Due to the proximity of the components and following Fujimoto et al. (2020) analysis, we evaluate how the emission is distributed along the system considering it as a single source. The [C II] , rest-frame UV and near-infrared images have different resolutions, and we therefore degraded the PSF of the HST and JWST maps to the ALMA beam size, which is the lowest resolution among the data sets. It yields a final beam size of 0.33×0.27″ (2.0×1.6 kpc2).
We first compare the spatial distribution of the different components in the top panel of Figure 7. Highlighted as solid-filled regions, we show the areas containing half of the total flux density for the [C II] (violet), HST/F125W (yellow), and MIRI/F770W (dark-red) images. The dashed (violet), dash-dotted (yellow), and dotted (dark red) lines represent the 3-σ flux contours in each band. We find that the half-light [C II] emission is more extended than the rest-frame UV and near-infrared emission traced by the HST and JWST bands, consistent with the results of Fujimoto et al. (2020). Based on visibility modeling, a Sérsic profile with an index of n = 1 (Ikeda et al. 2025) results in a circularized effective radius of ![Mathematical equation: $ r_{{{\mathrm {[C{\,}{II}]{\,}}}}}^{\mathrm {cir}} = 1.6 \pm 0.3 $](/articles/aa/full_html/2025/07/aa49843-24/aa49843-24-eq1.gif) kpc. Similar modeling of the rest-frame UV emission yields
kpc. Similar modeling of the rest-frame UV emission yields  kpc (Mitsuhashi et al. 2024) for the HST/F160W, making the [C II] emission ∼4× larger than the rest-frame UV. Although the 3-σ flux contours of the [C II] and rest-UV extend to similar radii, where no detection of rest-NIR emission is observed, this can be just a direct consequence of the depth of the observations.
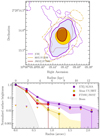 |
Fig. 7. Comparison of the multiwavelength radial profiles. (a) Top: Resolution-matched (0.33″× 0.27″) moment-0 maps. The [C II] , HST, and JWST are color-coded purple, yellow, and dark red, respectively. The solid lines correspond to the significance levels, which contain half of the total flux density of the galaxy. The dashed, dot-dashed, and dotted lines correspond to the 3-σ edge of the source in [C II] , rest-frame UV, and rest-frame NIR, respectively. (b) Bottom: Surface brightness profiles of [C II] and (average F105W + F125W + F140W + F160W) UV emission, in 0.3″ width elliptical apertures all centered in the [C II] centroid. The purple and yellow arrows show 1σ upper limits. |
We also computed surface brightness radial profiles of the [C II] , UV, and NIR emissions as shown in Figure 7 (bottom), shown as violet squares, yellow hexagons, and red circles, respectively. We calculate the flux in elliptical annuli, with 0.3″widths and the axial ratio of q = 0.6, based on the deconvolved axis of a spatial Gaussian fitting of the [C II] emission in the moment-0 map. The profiles are a function of distance to the [C II] centroid of the whole system, which is close to (but not exactly at) the peak of emission for the dominant C05-NW component, and less than 1 kpc (∼0.1″) from the centroid of the rest-UV and rest-1.2 μm emission. The surface brightness and uncertainties are normalized by the value of the first aperture of each band. The shaded area for each radial profile represents the 1-σ uncertainty in these measurements. We find that the [C II] emission has a more gradual decline with radii compared to the steeper decrement of the emission in the rest frame UV and NIR bands. The [C II] emission extends significantly up to 10 kpc, beyond where the emission is dominated by noise, and is undetected at further than 12 kpc. The radial profiles of both the HST and JWST bands are consistently similar out to 4 kpc, thereafter the JWST/F770W flux falls below the noise level. This noteworthy distinct extension confirms the measurements based on the visibility modeling of the emission distribution (Ikeda et al. 2025) and is consistent with recent findings of extended [C II] emission in massive star-forming galaxies at these redshifts (Fujimoto et al. 2020; Herrera-Camus et al. 2021; Akins et al. 2022).
Due to the moderate spatial S/N, we cannot perform a direct comparison of the radial profile of the dust distribution. As an attempt, we convolve in the image plane all the images to a resolution of 0.5″ to increase the significance of the emission, but the dust surface brightness profile is dominated by noise at r > 3 kpc. Based on a visibility modeling of the 0.5″ tapered data, Mitsuhashi et al. (2024) directly measured the extension of the dust continuum emission, which led to an effective radius of reff = 1.4±0.6 kpc, similar to the [C II] extension. Therefore, the dust-obscuration may play a role in the compact UV distribution observed.
4.2. Clumpiness
The [C II] moment-0 map and position-velocity diagram reveal that CRISTAL-05 is an interacting system, consisting of at least two galaxies projected along the same line-of-sight. Based on the visual inspection of the position-velocity diagram (Figure 3), C05-NW shows hints of hosting a rotating gaseous disk. At this point, we cannot distinguish it from a scenario in which C05-NW consists of two components in a close approach, however, which mimics the kinematics of a single rotating galaxy. In this section, we aim to determine how many components form CRISTAL-05.
We used the Fellwalker algorithm (Berry 2015) to search for structures based on a gradient-tracing scheme. In brief, the algorithm walks around pixels in the 3D cube that exceeds a specific threshold (determined by the NOISE parameter). It searches for paths with the steepest ascents, that is, it continually jumps from a given pixel to a neighboring pixel with the highest flux value heading to the peak flux value of the path. All paths reaching the same peak pixel are associated with the same clump. To define the starting point of each path, the algorithm considers only the section with an average gradient over four pixels greater than a threshold (determined by the FLATSLOPE parameter). Once a peak is found, the code expands its search to a broader neighborhood (defined by the MAXJUMP parameter) to check if there are pixels with higher values, avoiding noise spikes that may create local maxima. Adjacent peaks with pixel values below a certain threshold (defined by MINDIP) are thus considered part of the same clump.
The root mean square (rms) of the JvM-corrected background is reduced by a factor of ϵ, which results in a less accurate representation of the sensitivity for point-like sources. Therefore, all runs were performed in the version of the non-Jvm-corrected data cubes with a channel resolution of 10 km s−1 and 20 km s−1 (see Table 1). We start the clump search with the hypothesis that only two or three clumps are present. We note that the final results are significantly influenced by the choice of key parameters and the ones that primarily affect clump detection are MINDIP, MAXJUMP, and MINPIX (the minimum number of pixels a clump must contain). To minimize the influence of these parameters, and to eliminate obvious noise spikes, we set MINPIX to 16 pixels. We chose FLATSLOPE to be 2× rms after several tests showed that no significant differences in the final number of components and the determination of the edges of the components were observed. To mitigate the impact of MINDIP and MAXJUMP, we performed several runs while varying the parameters: [1, 2, 3]-σrms and [4, 6, 8] pixels, respectively. For all runs, the algorithm found a total number of 2 components, which were previously identified as C05-NW and C05-SE. Three components, two of which located in the C05-NW region, can only be found if the smallest dip in height allowed (MINDIP) is below 1-σ. This means that the difference between the flux of the two peaks of C05-NW is not significant enough to be considered as two independent components. In conclusion, our analysis favors the scenario that CRISTAL-05 is composed of two components, namely C05-NW and C05-SE.
The Fellwalker algorithm yields a final cube mirroring the size and spectral dimensions of the original, where pixels are assigned positive values as identifiers of each component. In contrast, those not associated with any structure are assigned negative values. We isolate the emission of a given component by masking out the pixels not assigned to that source, in the JvM-corrected cubes. For each channel, we apply to the masked pixels a Gaussian distribution with the same rms of the channel. In Figure 8, we display integrated maps and spectra of after the clump extraction, in a area encompassing the emission above 3σ in the moment-0 map. From left to right, the first panel shows the non-JvM-corrected [C II] moment-0 map integrated over the full velocity range covered by the CRISTAL-05 system (same as Figure 5). Green and dashed navy blue contours show the integrated emission of C05-NW and C05-SE extracted by the algorithm, where the major axes of each component are resolved along about two and three beam sizes, respectively. In the second panel, we present the JvM-corrected spectra of the whole system and each individually identified component. There is significant additional emission not accounted for by C05-NW and C05-SE, especially for velocities greater than 100 km s−1.
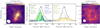 |
Fig. 8. Morphologies and spectra of the individual galaxies and extended emission. [From left to right,] (a) the first panel shows the non-JvM-corrected [C II] moment-0 map of CRISTAL-05, similar to the central panel of Figure 5, with C05-NW and C05-SE maps overlaid as solid green and dashed navy lines, respectively (3, 9, and 15 σrms). (b) Second panel: JvM-corrected spectra of CRISTAL-05 (black line), C05-NW (green line), and C05-SE (navy line), for apertures that enclose all the emissions of each component. The Gaussian distribution represents the best fit for the spectra of C05-NW and C05-SE, with a FWHM of 141 ± 7 and 64 ± 6 km s−1 , respectively. (c) Third panel: JvM-corrected spectra of CRISTAL-05 (black line) and the subtraction of components C05-NW and C05-SE (yellow line). The Gaussian distribution represents the best fit for the spectra of the residual, with a FWHM of 420 ± 40. (d) Non-JvM-corrected [C II] moment-0 map of CRISTAL-05, with the residual emission of the cube after subtracting components C05-NW and C05-SE (as 3-, 9-, 15-σrms) |
To pinpoint its location and emission distribution, we mask the emission from the two components (C05-NW and C05-SE) out of the original cube and compute the spectrum of the residuals, which is shown in the third panel. In the fourth panel, we see the non-JvM-corrected moment-0 map of the residuals. Most of the compact emission in the central region is removed, and only extended emission is left in the surroundings of the galaxy.
The clump extraction yields a flux of the C05-NW, C05-SE, and the extended components corresponding to 46%, 13%, and 41% of the total emission of the system, respectively. The components segmentation shows that a substantial fraction of the total [C II] line emission comes from the residual emission after subtracting the C05-NW and C05-SE. By default, the clump identification is sensitive to what we set as a noise and segmentation threshold, however, that leaves some extended wings behind. The definition of where the central emission ends and the extended third component starts depends on the resolution and sensitivity of the observations. It could be, for instance, that the two compact components have extended tails on their gas distribution and, because of the lower signal-to-noise, they are not associated with the central regions by the Fellwalker algorithm. Regardless, the emission in the radial profiles of the surface brightness at a distance exceeding a few kpc from the UV effective radius makes clear that there is an extended [C II] emission with two bright and compact central components. Considering the points discussed above, we define the fraction of [C II] emission in the extended emission as an upper limit, meaning that it contributes no greater than 41% to the total flux emission of CRISTAL-05.
4.3. Kinematic modeling of C05-NW
In Figure 9, we display the moment-1 and moment-2 maps of component C05-NW, extracted from the clump-finding algorithm. C05-NW exhibits signatures of disk rotation, according to criteria commonly used in the literature (Förster Schreiber & Wuyts 2020): (i) a smooth monotonic velocity gradient across the galaxy; (ii) nearly co-location of the kinematical and morphological centers; (iii) co-alignment of the morphological and kinematic major axes; and (iv) velocity dispersion peaks around the region of the steepest velocity gradient (which is mainly driven by beam smearing), excluding the high dispersion portion northeast and southwest of the galaxy. Therefore, we treat C05-NW as a disk in what follows.
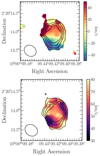 |
Fig. 9. Moment-1 (top) and moment-2 (bottom) maps of C05-NW component for the frequency with a spectral difference of −30 km s−1 from the [C II] frequency at z = 5.54. The black contours correspond to the 3-, 6-, 9-, 12-σ levels of the [C II] moment-0 map. |
We kinematically model the C05-NW emission using the parametric 3D software DYSMALpy (Cresci et al. 2009; Davies et al. 2011; Wuyts et al. 2016; Price et al. 2021). This code employs a multicomponent 1D, 2D, or 3D model to compare with the observed cube via Markov Chain Monte Carlo (MCMC) sampling, accounting for observational effects such as beam smearing and instrumental line broadening. We choose the 1D approach to simultaneously model the radial and dispersion velocity curves along the major axis of the galaxy since it contains most information of the intrinsic rotation curve (Genzel et al. 2020; Price et al. 2021).
In the left panel of Figure 10, we show the position-velocity diagram in the cube masking out the C05-SE and extended emission, with a spectral resolution of 20 km s−1. We created the rotation curves by fitting a Gaussian distribution in each column of the position-velocity diagram. The C05-NW component has features caused by the gravitational instabilities of the interaction: in the negative side of the PV diagram, we see some emission that deviates from the symmetric S-shape around ∼–50 km s−1, while in the positive velocity side, an extra emission extends from 40 to 80 km s−1. These regions require either masking or adopting two Gaussian fittings in a given column. The peaks from the Gaussian fitting, which correspond to the velocity of the rotating curve, are plotted as navy circles, and the error bars correspond to the dispersion of each column.
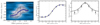 |
Fig. 10. Radial rotation curves of C05-NW as the input for DYSMALpy. (a) Left panel: Position-velocity diagram in an extracted-C05-NW cube, with a slit along the major axis with a width of 0.245″. The navy circles are the peak velocity of the Gaussian distribution in each position, and the black error bars are the dispersion of the distribution. These curves were symmetrized and are presented in the central and right panels. (b) Central panel: Symmetrized rotation radial profile of C05-NW as navy circles. The background gray circles are the curve that was not symmetrized, which is shown as navy circles in the left panel. (c) Right panel: Symmetrized dispersion velocity radial profile of C05-NW as black circles. The background gray circles are the error bars in the left panel before they were symmetrized. |
In the central and right panels of Figure 10, we show the line-of-sight and dispersion velocity curves (navy and black points, respectively), used as an input to DYSMALpy. Both curves were symmetrized by averaging the velocity values as a function of the distance from the galaxy's center. This was motivated by the observed asymmetries beyond 0.2″ in both curves (see PV diagram Figure 10, left panel). The zero point of both offset position and velocity were shifted to correspond to the symmetry point of the curve and better represent the kinematical center of the component. As a final step, we reduce the sampling to 3 points within the beam FWHM. The velocity peaks at 0.2″ and C05-NW is very compact, with an effective radius of ∼700 pc (∼0.12″), meaning that the curves extend up to 2.5×Reff.
To perform the kinematical fitting, the mass model consists of a thick disk, a bulge, and a dark matter halo. The parameter selection is summarized as follows:
(a) Dark matter mass distribution: It follows a Navarro-Frenk-White profile (Navarro et al. 1996), with a fixed concentration as c = 3, which is expected at this redshift (Dutton & Macciò 2014). We let the dark matter fraction (fdm) within the effective radius be a free parameter, with an initial guess of 0.5 and a flat prior. The virial mass is tied to the fdm, centered at log MDM,vir/M⊙ = 12.1, sigma of 0.5 and bounded at log MDM,vir/M⊙=[9,13]. We do not assume an adiabatic contraction of the halo.
(b) Baryon mass distribution (disk+bulge component):
We set the total baryonic mass as a free parameter with an initial guess of log Mbar/M⊙ = 10.2, by the sum of the stellar mass log M*/M⊙ = 10.0 obtained by Li et al. (2024), and the assume a gas-mass ratio of log Mgas/M* = 0.75 (Dessauges-Zavadsky et al. 2020). We choose a truncated Gaussian prior, centered at log Mbar/M⊙ = 10.2, with a standard deviation of 0.5 and varying in a wide range Mbar/M* ∈ [9.5,11]. This choice of bounds is based on the fact that the stellar mass estimation assumes CRISTAL-05 is a single source since it is unresolved in the HST imaging (Capak et al. 2015).
Our choice of a disk+bulge mass modeling is motivated by the failure of initial tests in fitting just a disk component, which cannot fit the central peak dispersion velocity of the galaxy, and thus requires a central concentrated mass component. The disk component follows a Sersic profile with a fixed Sersic index n = 1 and the effective radius is left free with a truncated Gaussian prior varying in [0.5,3] kpc, centered at 1.32 kpc and standard deviation of 1 kpc. For the bulge component, we fixed the Sersic index and effective radius as n = 4, We treat the bulge's effective radius r and the bulge-to-light ratio B/T as free parameters, with initial values set at 0.35 kpc and 0.5, respectively. Both are assigned Gaussian priors: r
 is constrained within the range [0.05, 2] kpc, and B/T is constrained within [0, 1], with standard deviations of 0.3 kpc and 0.2, respectively.. We fix the intrinsic thickness of this component to q0 = 1. The thick disk requires an asymmetric drift correction following Burkert et al. (2010). Finally, we assume that the dispersion velocity is isotropic and constant along the galaxy, so we add an initial guess of 40 km s−1 with a flat prior varying [5,100] km s−1 .
(c) Geometry: We fixed the kinematic center and position angle based on the moment-0 [C II] emission map. The inclination was set to 60°, according to the axial ratio of a spatial Gaussian fitting in the moment-0 map.
We ran the algorithm using 60 walkers, a burning phase of 100 steps, a running phase of 500 steps, and a final average acceptance fraction of 0.3. This led to the following maximum a posteriori estimates of our observations (by jointly analyzing the posteriors of all free parameters, Appendix B): log M M⊙, r
M⊙, r kpc, r
 kpc,
kpc,  M⊙, B/T = 0.6
 , dark matter fraction within the effective radius fdm (Re) = 0.04
 and σ0= 31
 km s−1 , indicating the range within which we have 68% confidence that the true value lies. If we run a model considering just a disk and fixing the stellar size extracted from the F277W-band image, the total baryonic mass and fdm are in agrees within uncertainties. The dispersion velocity in this case is lower by a factor of 1.2, as expected since adding a bulge component increases the central and intrinsic velocity dispersion (Appendix B).
In Figure 11, we display the intrinsic circular velocity curves of the total, baryon, and dark matter components. The intrinsic circular velocity peaks at 100 pc, with a velocity of 155 km s−1 , and it remains flat at r > 0.6 kpc for a value of 100 km s−1 . The dark matter contribution remains small at all radii probed by the [C II] observations (r < 2 kpc). This is a good fit for the velocity curve (χ2 = 0.78) but moderate for the dispersion velocity curve (χ2 = 2.0). The kinematical modeling retrieves a rotating gaseous disk mainly baryon-dominated on galactic scales, where most of the light emission arises from this concentrated mass component (∼60%). At distances greater than the beam size, the rotation-to-dispersion is V/σ0∼3, which implies dominant rotational support. The main axis of the galaxy is resolved over ∼3 beam sizes, however, and we therefore cannot completely rule out that C05-NW is a compact merger whose nuclei are closer than 2 kpc.
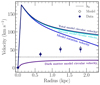 |
Fig. 11. Intrinsic circular velocity and rotation velocity profiles of C05-NW for the best-fit model of DYSMALpy. From top to bottom, we show as solid lines the intrinsic circular velocity of total mass distribution (baryon + dark matter component; navy), the intrinsic circular velocity of the baryons (gas + stars, cyan), the rotation velocity curve of the total mass distribution (baryon + dark matter; blue), and the intrinsic circular velocity of the dark matter mass distribution (dark violet). All the curves are corrected for inclination. As a reference, the intrinsic velocity dispersion is plotted as dotted black lines. The symmetrized rotation curve, the same as Figure 10, is plotted as navy circles, and the white diamonds show the best-fit model. None of rotation curves is corrected for inclination. |
5. Discussion
5.1. Nature of CRISTAL-05
Our observations of CRISTAL-05 can provide insights into the physical mechanisms that have affected the mass assembly of galaxies. While it has a compact rest-UV and -NIR emission, CRISTAL-05 has a gaseous disk component with features of disturbance. The multicomponent spectra and morphology indicate either that C05-NW and C05-SE are internal clumps of a single galaxy or two independent galaxies in a close approach. The nature of these structures will be discussed in this section.
The first scenario states that the complex morphology and kinematics of CRISTAL-05 reassemble a single galaxy hosting massive star-forming clumps. This clumpiness can be formed in situ from gravitational fragmentation in gas-rich disks with relatively high turbulent speeds (Bournaud et al. 2008; Genzel et al. 2008; Elmegreen et al. 2008; Ceverino et al. 2010; Dekel & Burkert 2014). Galaxies at this redshift are gas-rich and constantly fed by cold gas coming from the intergalactic medium, which is the main driver of the turbulence (Dekel et al. 2009; Ceverino et al. 2010; Dekel & Burkert 2014; Rodriguez-Gomez et al. 2016). An alternative origin is an ex-situ formation, where they are remnants of merging satellite galaxies (Ribeiro et al. 2017; Nakazato et al. 2024).
Indeed, bright substructures can imprint emission bumps in the [C II] spectrum of a galaxy (Kohandel et al. 2019, 2020), explaining the heavy-tail emission in Figure 1. In addition, the spatial proximity of the peak of the rest-UV and rest-NIR emissions with the [C II] centroid shows that, in this scenario, they trace the nucleus of CRISTAL-05 galaxy, with the star-forming regions being slightly more extended than the older stellar component (Figure 7, top panel).
To date, direct detections of giant clumps within normal galaxies have primarily been observed in massive rotating disks during the cosmic noon period (1 < z < 3). These clumps exhibit sizes reaching up to 1 kpc and typically possess stellar masses no greater than M*∼109 (Genzel et al. 2008). Beyond redshift z > 4, the identification of clumps like this is scarce, primarily found within massive starburst systems (Spilker et al. 2022) and lensed star-forming galaxies (Meštrić et al. 2022; Vanzella et al. 2022; Messa et al. 2024). Our understanding of the clumps in typical galaxies also relies on simulated observations of star-forming regions within galaxies at redshifts 5 < z < 7, such as those provided by the SERRA and FIRE hydrodynamical simulations (Pallottini et al. 2022; Wetzel et al. 2023). Some examples of galaxies in the SERRA simulation show typical clump sizes of ≲0.5 kpc (Kohandel et al. 2020; Zanella et al. 2021; Pallottini et al. 2022). The spatial Gaussian fitting of the [C II] in C05-NW and C05-SE yields deconvolved sizes of 0.4×0.2″(2.4×1.5 kpc) and 0.22×0.16″(1.3×0.9 kpc), respectively. Although these values may represent lower limits for the true sizes, they still exceed what would typically be expected for clumps at this redshift and in the cosmic noon. When we additionally consider that the UV contribution of C05-SE is negligible, the effective radius of C05-NW (0.3 kpc) is at least an order of magnitude large compared to stellar clumps recently identified in lensed galaxies (Meštrić et al. 2022; Vanzella et al. 2022; Messa et al. 2024). We cannot perform the same exercise for C05-SE, so deeper UV observations are required. Last, we note that the clumpy scenario struggles to account for the distinct velocity distributions observed in the position-velocity (pv) diagram. Notably, no observable emission stream connects the components, and a substantial difference of 150 km s−1 and 100 km s−1 exists between the negative components of C05-NW and C05-SE and the central portion of C05-NW and C05-SE.
According to mock observations the [C II] , rest-UV, and rest-NIR emission of the typical galaxy Althaea at z ∼ 6 simulated by the SERRA suite, it is required a resolution of about θ∼0.05″ to detect substructures within the galaxy (Zanella et al. 2021). Therefore, our limited resolution to detect internal clumps and the difficulty of this scenario to explain the disturbed features in the shape and dynamics of the gas point to CRISTAL-05 being a merging system. We hence presume that C05-NW and C05-SE are two galaxies, originally formed apart, in a close approach (∼2 kpc) and thus undergoing a merging event. The spatial projected proximity (∼2 kpc) and velocity difference of ∼100 km s−1 show that the system is gravitationally bound. The gravitational interactions distort and cause the gas stripping to the outskirts of the galaxies, as we can see in the disturbed gas imprinted in the [C II] moment-0 map and pv diagram (Figure 4). The higher brightness and size of C05-NW points it as the dominant, most massive galaxy of the system. The compactness of the UV and NIR emission is most likely attributed to the sensitivity of the current observations that fail to detect faint UV and NIR emission of satellite galaxies (Zanella et al. 2021). Another possibility is that the C05-SE galaxy is heavily dust-obscured, as the dust emission peak coincide with this region.
Finally, we followed a simple approach to calculate the dynamical mass of C05-NW and C05-SE by Mdyn = γRv2/G in units of M⊙ (Spilker et al. 2015, 2022), where G is the gravitational constant G = 4.32×10⁻⁶ km s−1 kpc M⊙, R is the radius (in units of kpc), v is the velocity of the system in km s−1 and γ is the pre-factor that accounts for the geometry of the system. The radius R was assumed to be the circularized radius from a beam-corrected Gaussian fitting on the moment-0 map of each component. For C05-NW, we assumed the velocity v = 120 km s−1 at R = 1.5 kpc, where the rotation curve, retrieved by the kinematical modeling, is flat (Figure 11). We also assumed γ = 1 for a rotating disk. For C05-SE, the pv diagram in Fig. 3 indicates that it is a dispersion-dominated system, but the current resolution does not allow us to completely rule out that the high dispersion of the source is solely caused by beam smearing. Keeping this limitation in mind, when we assumed a dispersion-dominated scenario, γ = 5 (Spilker et al. 2022) and v ∼σ of the system, it resulted in a dynamical mass of M M⊙ and M
 M⊙. These masses are consistent with the value estimated for C05-NW in section 4.3 and with the dynamical mass of typical galaxies at z = 5.5 (Spilker et al. 2022). It leads to a mass fraction of M
 /M
/M = 0.2, which is consistent with a minor merger. Deeper and more highly resolved observations are key to completely accessing the velocity distribution at smaller scales and to ultimately confirming the nature of the sources.
5.2. [C II] extended emission
Several studies in the literature referred to [C II] halos in early galaxies as the existence of carbon-enriched gas surrounding the galactic disk where most of the star-forming activity takes place. The typical sizes of 6–12 kpc (Fujimoto et al. 2020; Herrera-Camus et al. 2021; Akins et al. 2022) of these gaseous components exceed the effective radius of UV emission (1–3 kpc, Fujimoto et al. 2020), reaching the circumgalactic medium, loosely defined as the gas beyond 1–2 × the effective radius of the galactic disk out to the virial radius. It suggests that the circumgalactic medium is also composed of a cold-gas phase, in addition to the usual hot and warm gas (Tumlinson et al. 2017, and references in), as a result of galactic-scale processes such as nuclear, and stellar outflows and intergalactic gas accretion.
It is well known that the [C II] emission is associated with the star formation activity of local and distant galaxies (De Looze et al. 2014; Herrera-Camus et al. 2015; Carniani et al. 2018) since this is the major cooling line of stellar heating, in different gas phases (Stacey et al. 2010). The lack of heating sources to generate this emission at far distances requires some physical mechanism to transport the carbon produced by the stellar nucleosynthesis to the outskirts and to constantly excite the singly ionized phase.
Currently, there are different approaches to identifying a [C II] halo: (i) the first one was adopted by Fujimoto et al. (2020), where a galaxy contains a [C II] halo when R![Mathematical equation: $ {}^{\mathrm {eff}}_{\mathrm {[CII]}} > $](/articles/aa/full_html/2025/07/aa49843-24/aa49843-24-eq16.gif) R
R and it has a [C II] intensity in the outskirts of the galaxy greater than 4-σ for [C II] , but below 3-σ for the UV continuum. This extended area is delimited by an aperture radius of 10 kpc, masking out the emission within a beam area centered at the source peak emission. The outer radius is motivated by the spatial scale found via the visibility-based stacking of 18 star-forming galaxies at z = 5–7 by Fujimoto et al. (2019). (ii) The second one, adopted by kpc-resolved studies (Herrera-Camus et al. 2021; Akins et al. 2022) and also quantified by Fujimoto et al. (2020), claims a [C II] halo when R
![Mathematical equation: $ {}^{\mathrm {eff}}_{\mathrm {[CII]}} > $](/articles/aa/full_html/2025/07/aa49843-24/aa49843-24-eq18.gif) R
R and there is a significant intensity gap between the normalized surface brightness radial profiles of [C II] and UV emission, beyond the noise level. (iii) The third approach, performed by Ginolfi et al. (2020a) and Di Cesare et al. (2024), applies to major mergers (velocity separation of Δv≤500 kms−1) with a clear projected separation (rp≥4 kpc). The identification of the halo occurs when the emission is detected within the region enclosed by the 2-σ contour of the [C II] moment-0 map after subtracting the emissions from each interacting galaxy. The emission of each component is accounted for within the region defined by the FWHM of the Gaussian fit to the [C II] spatial emission. These studies not only detect the emission but also attribute at least 50% of the total emission to these [C II] envelopes.
According to definitions (i) and (ii), Fujimoto et al. (2020) defined CRISTAL-05 as having a [C II] halo. Since the first approach depends on the relative sizes of the galaxy and the beam, and the third one can be not applied to CRISTAL-05 (blended emission with a projected separation of rp∼2 kpc), we stick to the second one which evaluates the relative morphologies and extension of the different emissions. The higher resolution and depth of our observations confirm the extended nature of [C II] emission compared to both the rest-UV, at least up to 10 kpc. The detection of an extended [C II] emission so far assumes that the rest-UV emission from HST observations is a good tracer of the galactic disk because this is where most of the star formation takes place. Rest-frame UV observations can be affected by dust obscuration, however, and they therefore do not necessarily trace the star formation distribution in the galaxy (Meurer et al. 1999; Burgarella et al. 2005). Moreover, the star-forming regions tend to be more compact and it does not necessarily trace the mass distribution of a galaxy (Pallottini et al. 2022; Ferreira et al. 2022). Thus, the rest-UV emission is not enough to specify the galactic disk extent, and therefore, information on the stellar spatial distribution is also required. Hence, we also added the available JWST/F770W-band imaging of CRISTAL-05, which at z = 5.54 traces the emission close to the peak of the continuum of older stellar populations at z = 5.54 (rest-frame 1.2 μm). Similarly to the UV-continuum, the stellar emission is compact, reinforcing the extended nature of [C II] emission in CRISTAL-05.
We thus describe the main physical mechanisms proposed in the literature to explain the origin of the extended [C II] emission (Fujimoto et al. 2019; Ginolfi et al. 2020a; Akins et al. 2022):
-
Satellite galaxies – a non-negligible number of low-mass galaxies reside spatially around the massive galaxy and the [C II] emission arising from stellar heating in these smaller systems is smeared by the current resolution of observations, which mimicks an extended emission.
-
Cold streams – intergalactic gas streams flow toward the potential well of the central massive galaxy. [C II] emission is the product of gravitational energy and/or shock heating.
-
Outflows – high-speed interstellar gas flows outward the potential well of the massive galaxies as a product of AGN and/or stellar feedback.
-
Bridges and tidal tails associated with mergers - the cooling of [C II] release emission via kinematic energy dissipation in a turbulent cascade from large to small scales.
Our high-resolution observations provide evidence of the merger nature of CRISTAL-05, supporting scenario (4) as the main driver for the presence of [C II] emission beyond ∼ R . Simulations point out that satellites in minor mergers can disrupt the gas in low-mass galaxies (Kohandel et al. 2020; Akins et al. 2022). This result impacts the detection and analysis of the current properties of galaxies with [C II] halos. In the ALPINE survey, Fujimoto et al. (2020) considered only galaxies classified as nonmergers to avoid the obvious [C II] emission caused by shock heating in tidal stripping gas. Following this criterion, they concluded that 30% of the single ALPINE sources are classified as containing a [C II] halo (>4-σ[CII] and >3-σUV in the outskirts of the galaxies). Comparing both samples, galaxies with halos are more massive and starbursting, and have most likely past/ongoing star-driven outflow episodes to form this type of halo (Ginolfi et al. 2020b). A similar analysis by Fujimoto et al. (2019) could not reproduce the [C II] excess in surface brightness radial profiles of the stacked observations of the ALPINE survey in state-of-art cosmological simulations (Pallottini et al. 2017; Yajima et al. 2017). Our results suggest that at least a fraction of the galaxies with a [C II] halo that are located in the bright end of the SFR-M* relation could be multicomponent systems misclassified as individual galaxies. In these cases, the spectral energy distribution (SED) fitting on the unresolved sources took into account the summed photometry of the system that can mimic a more massive system. For these sources, the tension between observational and cosmological simulation breaks since we are analyzing objects with different dynamical natures.
This outcome highlights the need for high-resolution observations to ultimately distinguish isolated galaxies from mergers, which requires at least three beams along the major axis and an S/N > 10 (Rizzo et al. 2022). A close encounter, such as CRISTAL-05, imprints a low-velocity gradient in moment-1 and position-velocity diagrams, and a higher spatial and spectral resolution is required to efficiently separate two or more components.
Other examples in the literature also support merger activity as the cause of [C II] extended emission. The typical star-forming galaxy HZ7 at z = 5.25 contains an extended [C II] emission (Lambert et al. 2023) with no evidence of a broad secondary component in the [C II] spectrum across the galaxy, that could point to outflows. Instead, the disturbed integrated gas and dust emission and velocity field points to a late-state merger. Similarly, the strongly lensed sub-L* galaxy A1689-zD1 at z = 7.13 also has a [C II] halo, with signs of being a multicomponent system (Akins et al. 2022).
As previously mentioned in the third definition, Di Cesare et al. (2024) analyzed carbon-rich envelopes of 6 major mergers of the ALPINE survey and simulated galaxies at z = 4–5. The study concludes that the gas between and beyond the individual galaxies constitutes more than 50% of the total [C II] emission. These extend across distances exceeding 20 kpc (average 27 kpc), while isolated systems with extended emission from ALPINE survey go up to 10 kpc. They also found that the fraction of [C II] in the envelope correlates with the projected separation of the systems and the mass ratios, meaning that more mergers in advanced stages and with masses ratios close to unity host stronger gravitational interactions that can more intensively disrupt the gas of the galaxies. The low fraction (<40%) and extension of CRISTAL-05 point that the galaxy is a faint analog of these systems.
5.3. Shock heating that excites the extended [C II] emission
The [C II] arises mostly from the gas in photodissociation regions via photoelectric heating from polycyclic aromatic hydrocarbons (PAHs) and small dust grains (Watson 1972; Draine 1978; Tielens & Hollenbach 1985; Bakes & Tielens 1994; Stacey et al. 2010; Croxall et al. 2012). When considering thermal equilibrium, a clear correlation between [C II] emission and star formation activity emerges, applicable to both local and high-redshift galaxies (De Looze et al. 2014; Herrera-Camus et al. 2015; Carniani et al. 2018; Schaerer et al. 2020). Nonetheless, other mechanisms can also contribute to [C II] emission. For instance, an excess in the [C II] /FIR (>1%) and [C II] -to-PAH ratios have been indicative of low-velocity shocks Appleton et al. (2013), Lesaffre et al. (2013), observed in galaxy mergers (Peterson et al. 2018), compact groups (Alatalo et al. 2014; Appleton et al. 2017; Fadda et al. 2023) and infalling cluster galaxies (Minchin et al. 2022). Since the dust continuum emission predominantly arises from star formation activity, an upward deviation from these ratios may indicate that PDR heating is not enough to explain an enhanced [C II] emission.
We explore this scenario by evaluating how the [C II] emission varies relative to the far-infrared emission (FIR) across the galaxy. We define apertures with the same width of the beam size (d∼0.33″∼ 2 kpc), shown in the left panel of Figure 12. As we can see in the [C II] moment-0 map, the apertures isolate the different features of the galaxy: Regions 0 to 7 comprise the area around the central sources, with region 0 tracking the UV-dark emission in the northeast arm. Regions 8 to 10, on the other hand, sample the area in and between the two galaxies. Emissions from regions 8 and 10 arise mostly from C05-NW and C05-SE, respectively, although contamination from disturbed gas in the same line of sight cannot be excluded.
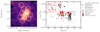 |
Fig. 12. (a) Left panel: [C II] moment-0 map, same as Figure 5, with 0.17″ apertures across the galaxy (white circles). The emission we extracted is analyzed in the right panel and in Figure 13. (b) Right panel: [C II] -to-FIR luminosity ratio as a function of the FIR luminosity. The global measurement (aperture of 1.5″) is shown as a red hexagon, and subregions 8, 9, and 10 are shown as red circles. The uncertainties reflect the possible dust temperature range between 40 and 60 K. The red area locates the upper limits of the mean of the ratios, where the dust emission is undetected. As a comparison, we also reference to z ∼ 0 LIRGS of the GOALS sample (gray circles; Díaz-Santos et al. 2013), z ∼ 0 normal galaxies (darkgray triangles; Malhotra et al. 2001), a purely shock-gas region in the Stephan's Quintet compact group (navy pentagons; Appleton et al. 2013), shock-gas in the bridge of the merging pair UGC12914/12915 (cyan squares; Peterson et al. 2018), and 4 < z < 6 typical galaxies from the ALPINE galaxies (IR detected sources as x-shape marker and IR upper limits as plus-shape markers; Béthermin et al. 2020). |
For the FIR luminosity estimation, we convert the dust continuum fluxes at the rest-frame 158 μm using the scaling factor derived by Béthermin et al. (2020). It describes the average SED for typical galaxies at z > 4, assuming a dust temperature of Td = 45 K and an emissivity index of βdust = 1.5. For the FIR, which accounts for the emission in a wavelength coverage between 42 μm and 122 μm, the conversion factor is νLν(158 μm)/LFIR = 0.185 (Solimano et al. 2024). The uncertainties reflect the possible dust temperature range between 40 and 60 K, also obtained by the available conversion factor in Béthermin et al. (2020). The global emission (circular aperture of r = 1.5″) is displayed as a red hexagon in Figure 12, and the FIR emission is detected in regions 4, 5, 7, 8, 9, and 10 (red circles). For the nondetection regions, the red area corresponds to the mean of upper limits ratios, also assuming Td = 45 K.
We compare our results with other galaxies in the literature: z ∼ 0 LIRGS of the GOALS sample (gray circles; Díaz-Santos et al. 2013), z ∼ 0 normal galaxies (darkgray triangles; Malhotra et al. 2001), and 4 < z < 6 typical galaxies from the ALPINE sample (we also apply the conversion factor of νLν(158 μm)/LFIR = 0.185, Béthermin et al. 2020). These galaxies have typical [C II] /FIR ratios of normal star-forming galaxies (0.1–1%, Cormier et al. 2015; Smith et al. 2017; Herrera-Camus et al. 2018) and starburst galaxies (0.1-0.01%, Malhotra et al. 2001; Díaz-Santos et al. 2013; Herrera-Camus et al. 2018).
We also add to Figure 12 (right panel) two cases of atypical [C II] /FIR ratios. Appleton et al. (2013) found an excess in the and [C II] -to-FIR ratio in a pure-shock region of Stefan's Quintet (SQ), arguing against purely photoelectric-heated gas in photodissociation regions. The second case is identified in the bridge between the local merging Taffy galaxies (UGC 12914/12915 Peterson et al. 2018). For both systems, the [C II] luminosity reaches 2–10% of the total FIR emission, which contrasts with the fraction in normal galaxies and local LIRG nuclei (dark green triangles and gray circles, Malhotra et al. 2001; Díaz-Santos et al. 2013).
The global measurement of CRISTAL-05 places it around the upper envelope of the location of local LIRGs. Regions 4, 7, 8, 9, and 10, which comprise the regions in and between C05-NW and C05-SE, have a luminosity ratio of ≲1%, similar to normal galaxies (gray triangles). In contrast, we note that the upper and lower limits on the LFIR and L[C II] /LFIR values, corresponding to the regions around the two main galaxy components of CRISTAL-05 (0, 1, 2, 3, and 6), are consistent with those found in the overlap/shocked regions of the SQ and Taffy systems.
We thus investigate if we can identify in the system a positive deviation in the ΣL[CII]−ΣSFR relation which may point to an enhancement of the [C II] emission caused by an additional mechanism rather than photoelectric heating. Although high-z galaxies follow the local L[C II] -SFR relation, they show a [C II] deficiency in the ΣL[C II] −ΣSFR relation compared to local ones (Carniani et al. 2018), due to their starburst nature, low metallicity or hardness of the UV radiation field (Ferrara et al. 2019). This discrepancy is shown in the dot-dashed cyan lines in Figure 13 (galaxies at 4.5 < z < 7, Carniani et al. 2018), compared to the local relation (solid navy color line). We also add the relation for the ALPINE survey obtained by Schaerer et al. (2020). To make this comparison, we converted the L[C II] −SFR relation (Figure 2 of Schaerer et al. 2020) to the surface density one assuming an area of 8 kpc2, comparable to the effective radius of the [C II] and FIR emission. The shock regions in the Taffy galaxies and SQ, derived by Peterson et al. (2018) and Appleton et al. (2013) respectively, clearly lie above the local relation. We see that the [C II] emission in both the global and most subregions (0, 1, 2, 3, 6, 7) is enhanced compared to galaxies at z > 5 both derived by Carniani et al. (2018) and Schaerer et al. (2020), that is, we detect no [C II] deficiency.
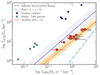 |
Fig. 13. [C II] surface density of CRISTAL-05 and its subregions as a function of the SFR surface density. The global measurement (aperture of 1.5″) is represented as a red hexagon, and the subregions as red circles, labeled as shown in the left panel Figure 12. We also display relations of local (navy dashed line, De Looze et al. 2014) and high-redshift galaxies (z > 4), as cyan dot-dashed (Carniani et al. 2018) and navy dashed (Schaerer et al. 2020) lines. For the latter, we convert the L[CII] – SFR correlation to the surface density, assuming an average area of 8 kpc−2. |
The boosted [C II] emission in the regions around the galaxy when compared to galaxies at the same epoch, and the excess in the [C II] /FIR ratio are tentatively consistent with a scenario where the [C II] emission is a consequence of heating produced in shock-only regions of mergers, like what is seen in the Taffy and SQ systems. In fact, Zhang et al. (2020) showed that galaxy interactions can increase some emission line ratios which are consistent with the shock produced by mergers. Moreover, studies of local galaxies and simulations have also revealed that mergers of galaxies can produce extended gas components without extended stellar distributions as a consequence of gas accretion or collisional processes, such as ram pressure stripping and shocks (Sparre et al. 2022). In the particular case of CRISTAL-05, the heating produced in the merger may not be as powerful as it happens in the local analogous, possibly due to the low mass of the companion satellite galaxy.
We cannot ultimately rule out that other physical mechanisms contribute to the enhanced [C II] emission, however. For instance, past/ongoing stellar feedback can contribute to the construction of the extended [C II] emission and metal enrichment of the circumgalactic medium of z ∼ 5 galaxies. Recent semianalytical models reproduce the extended [C II] radial profiles by including starburst-driven, catastrophically cooling outflows (Pizzati et al. 2020, 2023). In this scenario, supernova explosions expand in velocity ranges of 200–500 km s−1 outward of the galaxy, and the gas undergoes a catastrophic cooling in the first kpc. It is slowly heated up by the cosmic UV background, and its expansion is stopped around 10–15 kpc by the gravitational field of the host halo gravitational field. Stacking data in the ALPINE sample have hints of a broad Gaussian feature in the [C II] spectrum, most likely caused by starburst-driven outflows (Ginolfi et al. 2020b). For CRISTAL-05, the merger can enhance the star formation activity, indicating that more frequent supernova events can still be in place. Observations of lines tracing the ionized gas are necessary to identify the contribution of stellar feedback to the circumgalactic medium of interacting galaxies with extended [C II] emission.
We conclude that deeper studies are needed to detect the faint dust emission in the outskirts of CRISTAL-05 and to constrain dust temperature. More detailed additional spectroscopy of optical lines is necessary to ultimately define the role of shocks in producing the extended [C II] emission of merging galaxies in the early universe, as well as to investigate the contributions of metallicity and other gas phases to the production of [C II] .
6. Conclusions
We presented sensitive observations resolved on the kiloparsec scale of the [C II] line emission in the massive main-sequence star-forming galaxy CRISTAL-05 at z ∼ 5.54. Based on these [C II] observations from the ALMA CRISTAL large program (plus previous archival and pilot observations), HST/WFC3 rest-frame UV, and JWST MIRI rest-frame optical imaging, we conduct eda detailed morphological and kinematic analysis of this system. Previous studies showed that this is a typical star-forming galaxy in which the [C II] emission extends beyond the galactic disk. It was therefore classified as a [C II] halo (Fujimoto et al. 2020). We summarize our main findings below.
-
Morpho-kinematic classification based on high-resolution data: The [C II] emission shape is elongated (southeast to northwest) as a result of a double-peak distribution with a project separation of 2 kpc and a velocity difference of ∼100 km s−1 . The full-system velocity field is irregular, and the velocity dispersion is roughly constant around ∼80 km s−1 . All these features indicate that CRISTAL-05 is a multicomponent system that previous low-resolution observations were unable to identify clearly. The proximity and low-velocity range of [–50,+50] km s−1 requires high-resolution observations to properly perform a morpho-kinematical classification.
-
Complex kinematical structure: A more detailed examination showed that the CRISTAL-05 system consists of a brighter NW component with disk-like kinematics that is strongly baryon-dominated within ∼1 Reff and a more compact barely resolved component that is about five times less massive than the northwest component. The two components are surrounded by an extended carbon-rich gas component out to ∼10 kpc.
-
Extended [C II] emission: In contrast to the [C II] emission, the rest-UV and near-infrared continuum is compact and slightly elongated in the north-south direction. The
![Mathematical equation: $ r_{\mathrm {[CII]}}^{\mathrm {cir}} = 1.6 \pm 0.3 $](/articles/aa/full_html/2025/07/aa49843-24/aa49843-24-eq21.gif) kpc is about four times greater than the effective UV extension. It extends up to 10 kpc compared to the average UV surface brightness radial profiles. It contributes up to ∼40% of the [C II] light.
kpc is about four times greater than the effective UV extension. It extends up to 10 kpc compared to the average UV surface brightness radial profiles. It contributes up to ∼40% of the [C II] light. -
[C II] extended emission in a merging system: The upper and lower limits on the LFIR and L[C II] /LFIR values of the regions around the C05-NW and C05-SE component of CRISTAL-05 are consistent with those found in the overlap/shocked regions of the local merging systems, in which the [C II] emission is higher. Although we cannot exclude the contribution of other mechanisms, the current kinematical status of the system indicates that the turbulence and shocks of interacting galaxies are the main drivers of the boost in the [C II] emission in CRISTAL-05.
Our results strongly exemplify the necessity of kiloparsec-scale and parsec-scales observations to completely dissect the internal dynamical state of galaxies and to understand how this state contributes to the metal enrichment in the circumgalactic medium of infant galaxies. Future observations with JWST and ALMA can help us to determine the contribution of outflows in CRISTAL-05 by analyzing the hot ionized outflows and to define the role of different physical mechanisms in boosting the [C II] emission.
Acknowledgments
A. P. and M. A. acknowledge support from FONDECYT grant 1211951, “ANID+PCI+INSTITUTO MAX PLANCK DE ASTRONO- MIA MPG 190030”, “ANID+PCI+REDES 190194”, “ANID scholarship 21221137”. RJA was supported by FONDECYT grant number 123171 and by the ANID BASAL project FB210003. RB acknowledges support from an STFC Ernest Rutherford Fellowship [grant number ST/T003596/1]. AF acknowledges support from the ERC Advanced Grant INTERSTELLAR H2020/740120. IDL, MP, and SvdG acknowledge funding support from ERC starting grant 851622 DustOrigin. I.D.L and S.v.d.G acknowledges the support from the Flemish Fund for Scientific Research (FWO-Vlaanderen, projects G023821N and G0A1523N). R.I. is supported by Grants-in-Aid for Japan Society for the Promotion of Science (JSPS) Fellows (KAKENHI Grant Number 23KJ1006). E.d.C. gratefully acknowledges support from the Australian Research Council: Future Fellowship FT150100079, Discovery Project DP240100589, and the ARC Centre of Excellence for All Sky Astrophysics in 3 Dimensions (ASTRO 3D; project CE170100013). TDS was supported by the Hellenic Foundation for Research and Innovation (HFRI) under the “2nd Call for HFRI Research Projects to support Faculty Members & Researchers” (Project Number: 3382). K.T acknowledges support from JSPS KAKENHI Grant Number 23K03466. M. S. was financially supported by Becas-ANID scolarship #21221511, and also acknowledges ANID BASAL project FB210003. TDS: The research project was supported by the Hellenic Foundation for Research and Innovation (HFRI) under the “2nd Call for HFRI Research Projects to support Faculty Members & Researchers” (Project Number: 3382). HÜ gratefully acknowledges support by the Isaac Newton Trust and by the Kavli Foundation through a Newton-Kavli Junior Fellowship. RLD is supported by the Australian Research Council through the Discovery Early Career Researcher Award (DECRA) Fellowship DE240100136 funded by the Australian Government. M.K. was supported by the ANID BASAL project FB210003. MR acknowledges support from project PID2020-114414GB-100, financed by MCIN/AEI/10.13039/501100011033. This paper makes use of the following ALMA data: ADS/JAO.ALMA#2017.1.00428.L, ADS/JAO.ALMA#2021.1.00280.L, ADS/JAO.ALMA#2018.1.01359.S. ALMA is a partnership of ESO (representing its member states), NSF (USA) and NINS (Japan), together with NRC (Canada), MOST and ASIAA (Taiwan), and KASI (Republic of Korea), in cooperation with the Republic of Chile. The Joint ALMA Observatory is operated by ESO, AUI/NRAO and NAOJ.
References
- Akins, H. B., Fujimoto, S., Finlator, K., et al. 2022, ApJ, 934, 64 [NASA ADS] [CrossRef] [Google Scholar]
- Alatalo, K., Appleton, P. N., Lisenfeld, U., et al. 2014, ApJ, 795, 159 [Google Scholar]
- Appleton, P. N., Guillard, P., Boulanger, F., et al. 2013, ApJ, 777, 66 [CrossRef] [Google Scholar]
- Appleton, P. N., Guillard, P., Togi, A., et al. 2017, ApJ, 836, 76 [Google Scholar]
- Arata, S., Yajima, H., Nagamine, K., Abe, M., & Khochfar, S. 2020, MNRAS, 498, 5541 [NASA ADS] [CrossRef] [Google Scholar]
- Bakes, E. L. O., & Tielens, A. G. G. M. 1994, ApJ, 427, 822 [NASA ADS] [CrossRef] [Google Scholar]
- Baldry, I. K., Glazebrook, K., Brinkmann, J., et al. 2004, ApJ, 600, 681 [Google Scholar]
- Barnes, J. E., & Hernquist, L. E. 1991, ApJ, 370, L65 [Google Scholar]
- Berry, D. 2015, Astron. Comput., 10, 22 [NASA ADS] [CrossRef] [Google Scholar]
- Béthermin, M., Fudamoto, Y., Ginolfi, M., et al. 2020, A&A, 643, A2 [Google Scholar]
- Bournaud, F., Daddi, E., Elmegreen, B. G., et al. 2008, A&A, 486, 741 [NASA ADS] [CrossRef] [EDP Sciences] [Google Scholar]
- Briggs, D. S. 1995, Am. Astron. Soc. Meeting Abstr., 187, 112.02 [NASA ADS] [Google Scholar]
- Burgarella, D., Buat, V., & Iglesias-Páramo, J. 2005, MNRAS, 360, 1413 [NASA ADS] [CrossRef] [Google Scholar]
- Burkert, A., Genzel, R., Bouché, N., et al. 2010, ApJ, 725, 2324 [Google Scholar]
- Capak, P. L., Carilli, C., Jones, G., et al. 2015, Nature, 522, 455 [NASA ADS] [CrossRef] [Google Scholar]
- Carniani, S., Maiolino, R., Amorin, R., et al. 2018, MNRAS, 478, 1170 [NASA ADS] [CrossRef] [Google Scholar]
- CASA Team (Bean, B., et al.) 2022, PASP, 134, 114501 [NASA ADS] [CrossRef] [Google Scholar]
- Casey, C. M., Kartaltepe, J. S., Drakos, N. E., et al. 2023, ApJ, 954, 31 [NASA ADS] [CrossRef] [Google Scholar]
- Ceverino, D., Dekel, A., & Bournaud, F. 2010, MNRAS, 404, 2151 [NASA ADS] [Google Scholar]
- Cicone, C., Maiolino, R., Gallerani, S., et al. 2015, A&A, 574, A14 [NASA ADS] [CrossRef] [EDP Sciences] [Google Scholar]
- Clark, P. C., Glover, S. C. O., Ragan, S. E., & Duarte-Cabral, A. 2019, MNRAS, 486, 4622 [Google Scholar]
- Conselice, C. J., & Arnold, J. 2009, MNRAS, 397, 208 [NASA ADS] [CrossRef] [Google Scholar]
- Cormier, D., Madden, S. C., Lebouteiller, V., et al. 2015, A&A, 578, A53 [CrossRef] [EDP Sciences] [Google Scholar]
- Cresci, G., Hicks, E. K. S., Genzel, R., et al. 2009, ApJ, 697, 115 [Google Scholar]
- Croxall, K. V., Smith, J. D., Wolfire, M. G., et al. 2012, ApJ, 747, 81 [NASA ADS] [CrossRef] [Google Scholar]
- Czekala, I., Loomis, R. A., Teague, R., et al. 2021, ApJS, 257, 2 [NASA ADS] [CrossRef] [Google Scholar]
- Davies, R., Förster Schreiber, N. M., Cresci, G., et al. 2011, ApJ, 741, 69 [NASA ADS] [CrossRef] [Google Scholar]
- De Looze, I., Cormier, D., Lebouteiller, V., et al. 2014, A&A, 568, A62 [NASA ADS] [CrossRef] [EDP Sciences] [Google Scholar]
- De Lucia, G., Springel, V., White, S. D. M., Croton, D., & Kauffmann, G. 2006, MNRAS, 366, 499 [NASA ADS] [CrossRef] [Google Scholar]
- Dekel, A., & Burkert, A. 2014, MNRAS, 438, 1870 [Google Scholar]
- Dekel, A., Sari, R., & Ceverino, D. 2009, ApJ, 703, 785 [Google Scholar]
- Dessauges-Zavadsky, M., Ginolfi, M., Pozzi, F., et al. 2020, A&A, 643, A5 [NASA ADS] [CrossRef] [EDP Sciences] [Google Scholar]
- Di Cesare, C., Ginolfi, M., Graziani, L., et al. 2024, A&A, 690, A255 [NASA ADS] [CrossRef] [EDP Sciences] [Google Scholar]
- Díaz-Santos, T., Armus, L., Charmandaris, V., et al. 2013, ApJ, 774, 68 [Google Scholar]
- Draine, B. T. 1978, ApJS, 36, 595 [Google Scholar]
- Dressler, A. 1980, ApJ, 236, 351 [Google Scholar]
- Duncan, K., Conselice, C. J., Mundy, C., et al. 2019, ApJ, 876, 110 [NASA ADS] [CrossRef] [Google Scholar]
- Dunlop, J. S., Abraham, R. G., Ashby, M. L. N., et al. 2021, PRIMER: Public Release IMaging for Extragalactic Research, JWST Proposal. Cycle 1, ID. 1837 [Google Scholar]
- Dutton, A. A., & Macciò, A. V. 2014, MNRAS, 441, 3359 [Google Scholar]
- Elmegreen, B. G., Bournaud, F., & Elmegreen, D. M. 2008, ApJ, 688, 67 [NASA ADS] [CrossRef] [Google Scholar]
- Fadda, D., Sutter, J. S., Minchin, R., & Polles, F. 2023, ApJ, 957, 83 [CrossRef] [Google Scholar]
- Faisst, A. L., Schaerer, D., Lemaux, B. C., et al. 2020, ApJS, 247, 61 [NASA ADS] [CrossRef] [Google Scholar]
- Ferrara, A., Vallini, L., Pallottini, A., et al. 2019, MNRAS, 489, 1 [Google Scholar]
- Ferreira, L., Adams, N., Conselice, C. J., et al. 2022, ApJ, 938, L2 [NASA ADS] [CrossRef] [Google Scholar]
- Förster Schreiber, N. M., & Wuyts, S. 2020, ARA&A, 58, 661 [Google Scholar]
- Fujimoto, S., Ouchi, M., Ferrara, A., et al. 2019, ApJ, 887, 107 [Google Scholar]
- Fujimoto, S., Silverman, J. D., Bethermin, M., et al. 2020, ApJ, 900, 1 [Google Scholar]
- Gallerani, S., Pallottini, A., Feruglio, C., et al. 2018, MNRAS, 473, 1909 [Google Scholar]
- Genzel, R., Burkert, A., Bouché, N., et al. 2008, ApJ, 687, 59 [Google Scholar]
- Genzel, R., Price, S. H., Übler, H., et al. 2020, ApJ, 902, 98 [NASA ADS] [CrossRef] [Google Scholar]
- Ginolfi, M., Jones, G. C., Béthermin, M., et al. 2020a, A&A, 633, A90 [NASA ADS] [CrossRef] [EDP Sciences] [Google Scholar]
- Ginolfi, M., Jones, G. C., Béthermin, M., et al. 2020b, A&A, 643, A7 [NASA ADS] [CrossRef] [EDP Sciences] [Google Scholar]
- Guo, Y., Jogee, S., Finkelstein, S. L., et al. 2023, ApJ, 945, L10 [NASA ADS] [CrossRef] [Google Scholar]
- Harrison, C. M. 2017, Nat. Astron., 1, 0165 [NASA ADS] [CrossRef] [Google Scholar]
- Hayward, C. C., & Hopkins, P. F. 2016, MNRAS, 465, 1682 [Google Scholar]
- Herrera-Camus, R., Bolatto, A. D., Wolfire, M. G., et al. 2015, ApJ, 800, 1 [Google Scholar]
- Herrera-Camus, R., Sturm, E., Graciá-Carpio, J., et al. 2018, ApJ, 861, 95 [Google Scholar]
- Herrera-Camus, R., Förster Schreiber, N., Genzel, R., et al. 2021, A&A, 649, A31 [NASA ADS] [CrossRef] [EDP Sciences] [Google Scholar]
- Huertas-Company, M., Iyer, K. G., Angeloudi, E., et al. 2024, A&A, 685, A48 [NASA ADS] [CrossRef] [EDP Sciences] [Google Scholar]
- Ikeda, R., Tadaki, K. -I., Mitsuhashi, I., et al. 2025, A&A, 693, A237 [NASA ADS] [CrossRef] [EDP Sciences] [Google Scholar]
- Ilbert, O., McCracken, H. J., Le Fèvre, O., et al. 2013, A&A, 556, A55 [NASA ADS] [CrossRef] [EDP Sciences] [Google Scholar]
- Jones, G. C., Vergani, D., Romano, M., et al. 2021, MNRAS, 507, 3540 [NASA ADS] [CrossRef] [Google Scholar]
- Jorsater, S., & van Moorsel, G. A. 1995, AJ, 110, 2037 [Google Scholar]
- Kartaltepe, J. S., Rose, C., Vanderhoof, B. N., et al. 2023, ApJ, 946, L15 [NASA ADS] [CrossRef] [Google Scholar]
- Kennicutt, R. C., & Evans, N. J. 2012, ARA&A, 50, 531 [NASA ADS] [CrossRef] [Google Scholar]
- Kohandel, M., Pallottini, A., Ferrara, A., et al. 2019, MNRAS, 487, 3007 [NASA ADS] [CrossRef] [Google Scholar]
- Kohandel, M., Pallottini, A., Ferrara, A., et al. 2020, MNRAS, 499, 1250 [Google Scholar]
- Kroupa, P., & Weidner, C. 2003, ApJ, 598, 1076 [NASA ADS] [CrossRef] [Google Scholar]
- Laigle, C., McCracken, H. J., Ilbert, O., et al. 2016, ApJS, 224, 24 [Google Scholar]
- Lambas, D. G., Alonso, S., Mesa, V., O’Mill, A. L. 2012, A&A, 539, A45 [NASA ADS] [CrossRef] [EDP Sciences] [Google Scholar]
- Lambert, T. S., Posses, A., Aravena, M., et al. 2023, MNRAS, 518, 3183 [Google Scholar]
- Le Fèvre, O., Béthermin, M., Faisst, A., et al. 2020, A&A, 643, A1 [Google Scholar]
- Lesaffre, P., Pineau des Forêts, G., Godard, B., et al. 2013, A&A, 550, A106 [NASA ADS] [CrossRef] [EDP Sciences] [Google Scholar]
- Li, J., Da Cunha, E., González-López, J., et al. 2024, ApJ, 976, 70 [NASA ADS] [CrossRef] [Google Scholar]
- Maiolino, R., Gallerani, S., Neri, R., et al. 2012, MNRAS, 425, L66 [Google Scholar]
- Malhotra, S., Kaufman, M. J., Hollenbach, D., et al. 2001, ApJ, 561, 766 [Google Scholar]
- Messa, M., Dessauges-Zavadsky, M., Adamo, A., Richard, J., & Claeyssens, A. 2024, MNRAS, 529, 2162 [CrossRef] [Google Scholar]
- Meštrić, U., Vanzella, E., Zanella, A., et al. 2022, MNRAS, 516, 3532 [CrossRef] [Google Scholar]
- Meurer, G. R., Heckman, T. M., & Calzetti, D. 1999, ApJ, 521, 64 [Google Scholar]
- Meyer, R. A., Walter, F., Cicone, C., et al. 2022, ApJ, 927, 152 [NASA ADS] [CrossRef] [Google Scholar]
- Minchin, R., Fadda, D., Taylor, R., Deshev, B., & Davies, J. 2022, AJ, 164, 44 [Google Scholar]
- Mitsuhashi, I., Tadaki, K. -I., Ikeda, R., et al. 2024, A&A, 690, A197 [NASA ADS] [CrossRef] [EDP Sciences] [Google Scholar]
- Naab, T., & Ostriker, J. P. 2017, ARA&A, 55, 59 [Google Scholar]
- Nakazato, Y., Ceverino, D., & Yoshida, N. 2024, ApJ, 975, 238 [NASA ADS] [CrossRef] [Google Scholar]
- Navarro, J. F., Frenk, C. S., & White, S. D. M. 1996, ApJ, 462, 563 [Google Scholar]
- Nelson, D., Pillepich, A., Springel, V., et al. 2019, MNRAS, 490, 3234 [Google Scholar]
- Nightingale, J., Amvrosiadis, A., Hayes, R., et al. 2023, J. Open Source Software, 8, 4475 [NASA ADS] [CrossRef] [Google Scholar]
- Pallottini, A., Ferrara, A., Gallerani, S., et al. 2017, MNRAS, 465, 2540 [CrossRef] [Google Scholar]
- Pallottini, A., Ferrara, A., Decataldo, D., et al. 2019, MNRAS, 487, 1689 [Google Scholar]
- Pallottini, A., Ferrara, A., Gallerani, S., et al. 2022, MNRAS, 513, 5621 [NASA ADS] [Google Scholar]
- Peterson, B. W., Appleton, P. N., Bitsakis, T., et al. 2018, ApJ, 855, 141 [NASA ADS] [Google Scholar]
- Pillepich, A., Nelson, D., Springel, V., et al. 2019, MNRAS, 490, 3196 [Google Scholar]
- Pizzati, E., Ferrara, A., Pallottini, A., et al. 2020, MNRAS, 495, 160 [Google Scholar]
- Pizzati, E., Ferrara, A., Pallottini, A., et al. 2023, MNRAS, 519, 4608 [NASA ADS] [CrossRef] [Google Scholar]
- Poggianti, B. M., De Lucia, G., Varela, J., et al. 2010, MNRAS, 405, 995 [NASA ADS] [Google Scholar]
- Posses, A. C., Aravena, M., González-López, J., et al. 2023, A&A, 669, A46 [NASA ADS] [CrossRef] [EDP Sciences] [Google Scholar]
- Postman, M., Franx, M., Cross, N. J. G., et al. 2005, ApJ, 623, 721 [Google Scholar]
- Price, S. H., Shimizu, T. T., Genzel, R., et al. 2021, ApJ, 922, 143 [NASA ADS] [CrossRef] [Google Scholar]
- Ribeiro, B., Le Fèvre, O., Cassata, P., et al. 2017, A&A, 608, A16 [NASA ADS] [CrossRef] [EDP Sciences] [Google Scholar]
- Rizzo, F., Kohandel, M., Pallottini, A., et al. 2022, A&A, 667, A5 [NASA ADS] [CrossRef] [EDP Sciences] [Google Scholar]
- Rodriguez-Gomez, V., Pillepich, A., Sales, L. V., et al. 2016, MNRAS, 458, 2371 [Google Scholar]
- Rybak, M., Calistro Rivera, G., Hodge, J. A., et al. 2019, ApJ, 876, 112 [Google Scholar]
- Sánchez Almeida, J., Elmegreen, B. G., Muñoz-Tuñón, C., & Elmegreen, D. M. 2014, A&ARv, 22, 71 [Google Scholar]
- Sanders, D. B., & Mirabel, I. F. 1996, ARA&A, 34, 749 [Google Scholar]
- Schaerer, D., Ginolfi, M., Béthermin, M., et al. 2020, A&A, 643, A3 [NASA ADS] [CrossRef] [EDP Sciences] [Google Scholar]
- Shibuya, T., Miura, N., Iwadate, K., et al. 2022, PASJ, 74, 73 [Google Scholar]
- Smith, M. W. L., Ibar, E., Maddox, S. J., et al. 2017, ApJS, 233, 26 [NASA ADS] [CrossRef] [Google Scholar]
- Solimano, M., González-López, J., Aravena, M., et al. 2024, A&A, 689, A145 [NASA ADS] [CrossRef] [EDP Sciences] [Google Scholar]
- Somerville, R. S., & Davé, R. 2015, ARA&A, 53, 51 [Google Scholar]
- Sparre, M., Whittingham, J., Damle, M., et al. 2022, MNRAS, 509, 2720 [Google Scholar]
- Speagle, J. S., Steinhardt, C. L., Capak, P. L., & Silverman, J. D. 2014, ApJS, 214, 15 [Google Scholar]
- Spilker, J. S., Aravena, M., Marrone, D. P., et al. 2015, ApJ, 811, 124 [NASA ADS] [CrossRef] [Google Scholar]
- Spilker, J. S., Hayward, C. C., Marrone, D. P., et al. 2022, ApJ, 929, L3 [NASA ADS] [CrossRef] [Google Scholar]
- Stacey, G. J., Hailey-Dunsheath, S., Ferkinhoff, C., et al. 2010, ApJ, 724, 957 [NASA ADS] [CrossRef] [Google Scholar]
- Tielens, A. G. G. M., & Hollenbach, D. 1985, ApJ, 291, 747 [NASA ADS] [CrossRef] [Google Scholar]
- Tojeiro, R., Masters, K. L., Richards, J., et al. 2013, MNRAS, 432, 359 [Google Scholar]
- Tumlinson, J., Peeples, M. S., & Werk, J. K. 2017, ARA&A, 55, 389 [Google Scholar]
- Vallini, L., Gallerani, S., Ferrara, A., Pallottini, A., & Yue, B. 2015, ApJ, 813, 36 [NASA ADS] [CrossRef] [Google Scholar]
- Vanzella, E., Castellano, M., Bergamini, P., et al. 2022, ApJ, 940, L53 [NASA ADS] [CrossRef] [Google Scholar]
- Villanueva, V., Bolatto, A., Vogel, S., et al. 2021, ApJ, 923, 60 [Google Scholar]
- Watson, W. D. 1972, ApJ, 176, 103 [Google Scholar]
- Wetzel, A., Hayward, C. C., Sanderson, R. E., et al. 2023, ApJS, 265, 44 [NASA ADS] [CrossRef] [Google Scholar]
- Wolfire, M. G., McKee, C. F., Hollenbach, D., & Tielens, A. G. G. M. 2003, ApJ, 587, 278 [Google Scholar]
- Wuyts, S., Förster Schreiber, N. M., Wisnioski, E., et al. 2016, ApJ, 831, 149 [Google Scholar]
- Yajima, H., Nagamine, K., Zhu, Q., Khochfar, S., & Dalla Vecchia, C. 2017, ApJ, 846, 30 [Google Scholar]
- Zanella, A., Pallottini, A., Ferrara, A., et al. 2021, MNRAS, 500, 118 [Google Scholar]
- Zhang, H., Fang, T., Zaritsky, D., et al. 2020, ApJ, 893, L3 [Google Scholar]
Appendix A: Impact of the JvM correction
The JvM effect corresponds to a flux overestimation in the aperture photometry of a source, in combined data sets of different multi-array configurations with suboptimal integration times (Jorsater & van Moorsel 1995; Czekala et al. 2021). In these cases, the combined dirty beam can no longer be represented by a Gaussian distribution. As a consequence, there is a difference between the dirty synthesized beam generated by the inverse Fourier transformation of the visibilities and the clean synthesized beam modeled by the tclean task.
To quantify how the final flux density of CRISTAL-05 is affected by this effect, we display the 1.5″aperture spectra of the galaxy from the non-JvM-corrected and JvM-corrected data cubes in Fig. A.1. We compare it with the spectrum of the galaxy obtained by the ALPINE survey (Le Fèvre et al. 2020), where the source was singly observed in a compact array configuration. The JvM effect affects the shape of the spectrum (FWHMnon−JvM ∼ 1.3 × FWHMJvM), and the line amplitude is overestimated by a factor of ∼ 2.5, compared to the JvM-corrected data. The JvM-corrected and the non-JvM corrected density fluxes are 1.04 ± 0.1 mJy km s−1 and 3.0 ± 0.2 mJy km s−1, respectively. On the other hand, the JvM-corrected flux and shape are in line with ALPINE measurements (flux density = 0.95 ± 0.06 mJy km s−1) that used compact configurations.
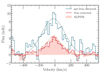 |
Fig. A.1. [C II] spectra of CRISTAL-05 from the non-Jvm corrected cube (blue solid line), the JvM-corrected cube with (red solid line), and low-resolution cube from ALPINE survey (red-filled area). The dashed, dot-dashed, and dotted lines represent the best fit for the 1D Gaussian distribution, respectively. |
Figures A.2, A.3 and A.4 show the impacts of the JvM correction in the moment-0, -1 and -2 maps.
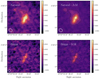 |
Fig. A.2. Non-JvM corrected (left panels) and JvM corrected (right panels) moment-0 maps generated with the clean parameter ROBUST = 2 (top panels) and ROBUST = 0.5. (bottom panels). The overlaid black contours correspond to the 3, 5, 7, 9, and 11-σ[C II] levels in each moment-0 maps. The white ellipse indicates the beam size. |
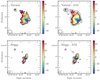 |
Fig. A.3. Non-JvM corrected (left panels) and JvM corrected (right panels) moment-1 maps generated with the clean parameter ROBUST = 2 (top panels) and ROBUST = 0.5. (bottom panels). The overlaid black contours correspond to the 3, 5, 7, 9, and 11-σ[C II] levels in each moment-0 maps. The white ellipse indicates the beam size. |
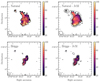 |
Fig. A.4. Non-JvM corrected (left panels) and JvM corrected (right panels) moment-2 maps generated with the clean parameter ROBUST = 2 (top panels) and ROBUST = 0.5. (bottom panels). The overlaid black contours correspond to the 3, 5, 7, 9, and 11-σ[C II] levels in each moment-0 maps. The white ellipse indicates the beam size. |
Appendix B: Dynamical modeling
In Section 4.3, we introduced an extra concentrated mass component to model the dynamical profile of C05-NW. Here we compare the best-fit model adopt above (hereafter Model A) with alternative scenarios to assess their impact on the output parameters. We assume the same priors described in Section 4.3, except that: in Model B, we reduce the number of free parameters of the disk+bulge component by fixing B/T = 30% and the bulge effective radius reff,bulge = 0.15 kpc; and in Model C, we set a single-disk component and fix the effective radius and Sérsic index of the disk, adopting values obtained from a 2D Sérsic fit in the JWST/F277W observations using the PYAUTOGALAXY (Nightingale et al. 2023).
For the parametric fitting of the optical spatial distribution, we tested both an exponential profile (n = 1) and a Sersic profile where we let the Sersic index free, leading to a disk effective radius of 0.70 ± 0.03 kpc and 0.90 ± 0.02 kpc, respectively. The emission distribution is better represented by the disk component with a Sersic index n = 2.5 ± 0.1 rather than the exponential profile, especially in the central portion of the system (χ2 = 3.05 for a free n, while χ2 = 6.45 for n = 1, at r < 0.15″). Therefore, the JWST light profile requires a bulge-like component with n > 1, which we adopt as the fixed Sersic index and effective radius for the disk component in Model C.
After defining the input parameters for Models B and C, we perform a MCMC run using 60 walkers and 500 steps, with a burn-in phase of 100 steps, following the same MCMC inputs of Model A (Section 4.3). The top row of Figure B.1 compares the 1D velocity and dispersion curves of the observations with those of the three models. Model B retrieves a velocity curve similar to that of Model A, while Model C shows a shallower rise and reaches its peak at a larger radius, r ∼ 0.3″. The dispersion curves reveal more distinct differences between the models: Model A and B provide a better fit to the central region, whereas the disk-only Model C more accurately captures the outer regions. Moreover, we observe that Models A and B accurately reproduce the position-velocity diagrams (second to forth rows in Figure B.1). In contrast, the disk-only Model C fails to do so, particularly along the major axis. This model does not follow the rising trend of the observed PV diagram, instead introducing excess emission near r ∼ 0 and v ∼ 0 of the position-velocity diagram.
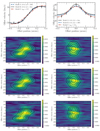 |
Fig. B.1. (First row): Velocity (left) and dispersion (right) 1D profiles of the observation and models. (Second to forth row): Position-velocity diagrams of C05-NW, extracted along the major (left) and minor (right) axes using a pseudo-slit with a width of 0.245″. The dashed lines represent the 3, 4, and 5σ levels of the observation. The solid black lines represent 0.3, 0.5, 0.7 and 0.9 times the emission peak of the main model A (second row), of Model B (third row), and of the disk-only Model C (forth row). |
Regardless of the model choice, the output parameters for the mass are in reasonable agreement (Table B.1). First, the total baryonic mass in all models is consistent within their mutual uncertainties, suggesting that Model A is accurately capturing the galaxy's potential well. Second, without exception, all scenarios point to a nearly dark matter-free core. It indicates that the galaxy is baryon-dominated on galactic scales, in alignment with other star forming galaxies in the literature (Wuyts et al. 2016; Genzel et al. 2020; Price et al. 2021; Herrera-Camus et al. 2021). Last, the primary parameter affected is the velocity dispersion. As expected, the addition of a bulge enhances the central velocity dispersion.
Comparison of model parameters.
In conclusion, despite the higher number of free parameters in Model A, the output parameters remain consistent across models, indicating that our MCMC approach provides a representative description of the galaxy's mass distribution. While Model C is a simpler alternative, it fails to reproduce the observed position-velocity diagram, particularly along the major axis, making it an unsuitable choice. In contrast, Models A and B successfully capture both the kinematics and spatial distribution of the system, reinforcing the validity of Model A as a physically motivated model.
Although DYSMALpy is optimized for modeling the bulge component of lower-redshift galaxies, given the resolution and complexity of our target system, we cannot confidently classify this structure as a ”classical” bulge with properties akin to those observed in nearby galaxies. Instead, we adopt a more general approach, describing it as a centrally concentrated mass component that deviates from a pure exponential profile.
Finally, in Figures B.3 we show the posterior distributions of the free parameters of the DYSMALpy routine. Additionally, Fig. B.2 shows the emission distribution channel-by-channel in the velocity range of [-200,140] km s−1 of the observation and DYSMAL model cube.
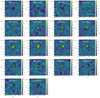 |
Fig. B.2. Channel maps of the cube within a velocity range of [-200,140] km s−1 (in bins of 20 km s−1), centered at the observed [C II] frequency. The overlaid black dashed contours show the 1, 2, and 3 σ levels of the maps. |
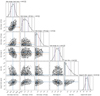 |
Fig. B.3. Posterior distributions for the kinematical modeling in C05-NW. |
Appendix C: CRISTAL-05 environment
Our observations cover a primary beam of rPB = 15″, which translates into a projected area of 25 Mpc2. We report the detection of 3 galaxies in the continuum maps, with no [C II] emission detected. Since the merger frequency is enhanced in overdensities, we explore the possibility that CRISTAL-05 is located close to the density peak of a protocluster environment. These galaxies are identified in the COSMOS2015 survey (Laigle et al. 2016) as 684856, 15086, and 686297, at distances of 51, 70, and 86 kpc, respectively. None of the sources have an available spectroscopic redshift, but COSMOS 2020 assigned a photometric redshift of z = 1.91 and z
 = 2.1. Target 684856 was not covered from COSMOS2020 but COSMOS 2015 found z
 = 5.13. At this redshift, we did not find a [C II] detection in the location of 684856. Therefore, we see no evidence that CRISTAL-05 is within a galaxy overdensity at z = 5.5 based on the existing data.
All Tables
All Figures
|
Fig. 1. JvM-corrected [C II] spectrum of CRISTAL-05 extracted within a circular aperture with a radius of 1.5″ and centered in the [C II] observed frequency νobs = 292.48 GHz. We display the continuum-subtracted spectrum from the JvM-corrected data cube with a channel resolution of 10 km s−1 (solid black lines in both panels). (a) Top: 1D Gaussian fitting (solid green line) and the residuals (black dots). (b) Spectrum fit with two Gaussian components (solid red line). As in the panel above, the residuals are plotted as black dots. |
| In the text | |
|
Fig. 2. ALMA [C II] moment-0 map (non-JvM corrected). The overlaid black contours correspond to the 3, 5, 7-σ[C II] levels, where σ[C II] = 0.02 Jy/beam km s−1 is the rms noise level. The white ellipse indicates the beam size of 0.21″×0.18″. |
| In the text | |
|
Fig. 3. Kinematics of the [C II] emission for CRISTAL-05. (a) Top and (b) bottom left panels: Velocity (moment-1) and dispersion (moment-2) with respect to the observed frequency of [C II] at redshift z = 5.54. The black contours correspond to the 3-, 6-, 9-, 12-σ levels of the [C II] moment-0 map (non-JvM corrected). The dashed black line shows the slit in which we created the position-velocity diagram in the right panel, with the center of the slit as a black cross. The solid black line (black polygon) represents the slit used to generate the pv diagram (spectrum) of Figure 4. (c) Right panel: Position-velocity diagram (non-JvM corrected) along the major axis of CRISTAL-05 with a width of 0.245″. The black contours represent the 3, 5, and 7σpv. |
| In the text | |
|
Fig. 4. Kinematical properties of the northeast emission of CRISTAL-05. (a) Top panel: [C II] spectrum within the black polygon in the top left panel of Figure 3. The orange solid line corresponds to the spectrum fitting with two Gaussian components, and the residuals are plotted as black dots. (b) Position-velocity diagram along the slit, shown as the solid black line in Figure 3, with a width of 10 pixels. |
| In the text | |
|
Fig. 5. Multiwavelength cutout postage stamps toward CRISTAL-05. (a) Left top panel: ALMA [C II] moment-0 map (non-JvM corrected). The overlaid black contours correspond to the 3, 5, 7, 9, and 11-σ[C II] levels. The white ellipse indicates the beam size of 0.33″×0.27″. (b) Left bottom panel: HST F140W rest-frame UV (0.2μm) continuum image. The overlaid contours correspond to the 3, 10, 17, and 24-σUV levels. The white circle indicates the 0.2″ point spread function. The peak emission is marked as a blue star. (c) Right top panel: non-JvM-corrected ALMA rest-frame 160 μm dust continuum image. The overlaid contours correspond to the 2, 3, 4-σ160. The white ellipse indicates the beam size of 0.33″×0.27″, the same as the [C II] moment-0 resolution. (d) Right lower panel: JWST F770W (1.2 μm) rest-frame near-infrared image. The black contours correspond to 3, 5, 7, and 9σ1.2. The peak emission is marked as a red circle. (e) Central panel: Non-JvM-corrected ALMA [C II] moment-0 map in the background, similar to the left top panel. We display the [C II] peak emission of C05-NW and C05-SE components as black crosses (based on Figure 2). The overlaid green contours correspond to the 3, 6, and 9 σ[C II] levels. The blue dashed lines represent the HST/F140W map, for the 7 and 20σ significance levels. The filled areas correspond to the 160 μm dust continuum emission for the 2, 3, and 4 σ significance levels. |
| In the text | |
|
Fig. 6. F277W-band image of CRISTAL-05 that captures the rest-frame optical emission at z = 5.54. The black contours denote the 3, 4, 5, and 6σ levels of the F277W band, while the white contours represent the 3, 4, 5, and 6σ contours from the [CII] moment-0 map. |
| In the text | |
|
Fig. 7. Comparison of the multiwavelength radial profiles. (a) Top: Resolution-matched (0.33″× 0.27″) moment-0 maps. The [C II] , HST, and JWST are color-coded purple, yellow, and dark red, respectively. The solid lines correspond to the significance levels, which contain half of the total flux density of the galaxy. The dashed, dot-dashed, and dotted lines correspond to the 3-σ edge of the source in [C II] , rest-frame UV, and rest-frame NIR, respectively. (b) Bottom: Surface brightness profiles of [C II] and (average F105W + F125W + F140W + F160W) UV emission, in 0.3″ width elliptical apertures all centered in the [C II] centroid. The purple and yellow arrows show 1σ upper limits. |
| In the text | |
|
Fig. 8. Morphologies and spectra of the individual galaxies and extended emission. [From left to right,] (a) the first panel shows the non-JvM-corrected [C II] moment-0 map of CRISTAL-05, similar to the central panel of Figure 5, with C05-NW and C05-SE maps overlaid as solid green and dashed navy lines, respectively (3, 9, and 15 σrms). (b) Second panel: JvM-corrected spectra of CRISTAL-05 (black line), C05-NW (green line), and C05-SE (navy line), for apertures that enclose all the emissions of each component. The Gaussian distribution represents the best fit for the spectra of C05-NW and C05-SE, with a FWHM of 141 ± 7 and 64 ± 6 km s−1 , respectively. (c) Third panel: JvM-corrected spectra of CRISTAL-05 (black line) and the subtraction of components C05-NW and C05-SE (yellow line). The Gaussian distribution represents the best fit for the spectra of the residual, with a FWHM of 420 ± 40. (d) Non-JvM-corrected [C II] moment-0 map of CRISTAL-05, with the residual emission of the cube after subtracting components C05-NW and C05-SE (as 3-, 9-, 15-σrms) |
| In the text | |
|
Fig. 9. Moment-1 (top) and moment-2 (bottom) maps of C05-NW component for the frequency with a spectral difference of −30 km s−1 from the [C II] frequency at z = 5.54. The black contours correspond to the 3-, 6-, 9-, 12-σ levels of the [C II] moment-0 map. |
| In the text | |
|
Fig. 10. Radial rotation curves of C05-NW as the input for DYSMALpy. (a) Left panel: Position-velocity diagram in an extracted-C05-NW cube, with a slit along the major axis with a width of 0.245″. The navy circles are the peak velocity of the Gaussian distribution in each position, and the black error bars are the dispersion of the distribution. These curves were symmetrized and are presented in the central and right panels. (b) Central panel: Symmetrized rotation radial profile of C05-NW as navy circles. The background gray circles are the curve that was not symmetrized, which is shown as navy circles in the left panel. (c) Right panel: Symmetrized dispersion velocity radial profile of C05-NW as black circles. The background gray circles are the error bars in the left panel before they were symmetrized. |
| In the text | |
|
Fig. 11. Intrinsic circular velocity and rotation velocity profiles of C05-NW for the best-fit model of DYSMALpy. From top to bottom, we show as solid lines the intrinsic circular velocity of total mass distribution (baryon + dark matter component; navy), the intrinsic circular velocity of the baryons (gas + stars, cyan), the rotation velocity curve of the total mass distribution (baryon + dark matter; blue), and the intrinsic circular velocity of the dark matter mass distribution (dark violet). All the curves are corrected for inclination. As a reference, the intrinsic velocity dispersion is plotted as dotted black lines. The symmetrized rotation curve, the same as Figure 10, is plotted as navy circles, and the white diamonds show the best-fit model. None of rotation curves is corrected for inclination. |
| In the text | |
|
Fig. 12. (a) Left panel: [C II] moment-0 map, same as Figure 5, with 0.17″ apertures across the galaxy (white circles). The emission we extracted is analyzed in the right panel and in Figure 13. (b) Right panel: [C II] -to-FIR luminosity ratio as a function of the FIR luminosity. The global measurement (aperture of 1.5″) is shown as a red hexagon, and subregions 8, 9, and 10 are shown as red circles. The uncertainties reflect the possible dust temperature range between 40 and 60 K. The red area locates the upper limits of the mean of the ratios, where the dust emission is undetected. As a comparison, we also reference to z ∼ 0 LIRGS of the GOALS sample (gray circles; Díaz-Santos et al. 2013), z ∼ 0 normal galaxies (darkgray triangles; Malhotra et al. 2001), a purely shock-gas region in the Stephan's Quintet compact group (navy pentagons; Appleton et al. 2013), shock-gas in the bridge of the merging pair UGC12914/12915 (cyan squares; Peterson et al. 2018), and 4 < z < 6 typical galaxies from the ALPINE galaxies (IR detected sources as x-shape marker and IR upper limits as plus-shape markers; Béthermin et al. 2020). |
| In the text | |
|
Fig. 13. [C II] surface density of CRISTAL-05 and its subregions as a function of the SFR surface density. The global measurement (aperture of 1.5″) is represented as a red hexagon, and the subregions as red circles, labeled as shown in the left panel Figure 12. We also display relations of local (navy dashed line, De Looze et al. 2014) and high-redshift galaxies (z > 4), as cyan dot-dashed (Carniani et al. 2018) and navy dashed (Schaerer et al. 2020) lines. For the latter, we convert the L[CII] – SFR correlation to the surface density, assuming an average area of 8 kpc−2. |
| In the text | |
|
Fig. A.1. [C II] spectra of CRISTAL-05 from the non-Jvm corrected cube (blue solid line), the JvM-corrected cube with (red solid line), and low-resolution cube from ALPINE survey (red-filled area). The dashed, dot-dashed, and dotted lines represent the best fit for the 1D Gaussian distribution, respectively. |
| In the text | |
|
Fig. A.2. Non-JvM corrected (left panels) and JvM corrected (right panels) moment-0 maps generated with the clean parameter ROBUST = 2 (top panels) and ROBUST = 0.5. (bottom panels). The overlaid black contours correspond to the 3, 5, 7, 9, and 11-σ[C II] levels in each moment-0 maps. The white ellipse indicates the beam size. |
| In the text | |
|
Fig. A.3. Non-JvM corrected (left panels) and JvM corrected (right panels) moment-1 maps generated with the clean parameter ROBUST = 2 (top panels) and ROBUST = 0.5. (bottom panels). The overlaid black contours correspond to the 3, 5, 7, 9, and 11-σ[C II] levels in each moment-0 maps. The white ellipse indicates the beam size. |
| In the text | |
|
Fig. A.4. Non-JvM corrected (left panels) and JvM corrected (right panels) moment-2 maps generated with the clean parameter ROBUST = 2 (top panels) and ROBUST = 0.5. (bottom panels). The overlaid black contours correspond to the 3, 5, 7, 9, and 11-σ[C II] levels in each moment-0 maps. The white ellipse indicates the beam size. |
| In the text | |
|
Fig. B.1. (First row): Velocity (left) and dispersion (right) 1D profiles of the observation and models. (Second to forth row): Position-velocity diagrams of C05-NW, extracted along the major (left) and minor (right) axes using a pseudo-slit with a width of 0.245″. The dashed lines represent the 3, 4, and 5σ levels of the observation. The solid black lines represent 0.3, 0.5, 0.7 and 0.9 times the emission peak of the main model A (second row), of Model B (third row), and of the disk-only Model C (forth row). |
| In the text | |
|
Fig. B.2. Channel maps of the cube within a velocity range of [-200,140] km s−1 (in bins of 20 km s−1), centered at the observed [C II] frequency. The overlaid black dashed contours show the 1, 2, and 3 σ levels of the maps. |
| In the text | |
|
Fig. B.3. Posterior distributions for the kinematical modeling in C05-NW. |
| In the text | |
Current usage metrics show cumulative count of Article Views (full-text article views including HTML views, PDF and ePub downloads, according to the available data) and Abstracts Views on Vision4Press platform.
Data correspond to usage on the plateform after 2015. The current usage metrics is available 48-96 hours after online publication and is updated daily on week days.
Initial download of the metrics may take a while.