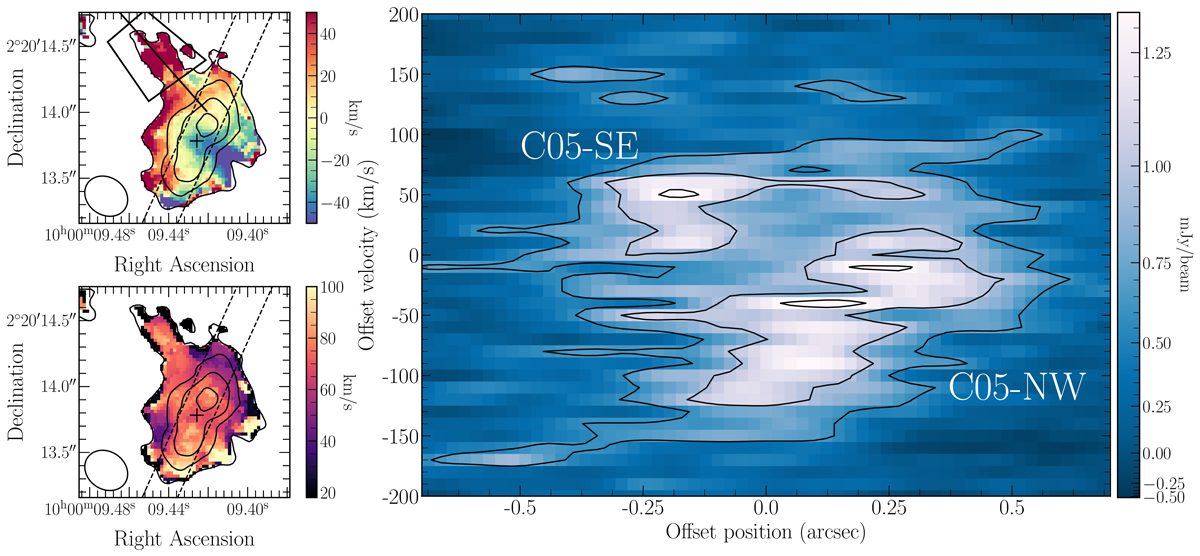
Fig. 3.
Download original image
Kinematics of the [C II] emission for CRISTAL-05. (a) Top and (b) bottom left panels: Velocity (moment-1) and dispersion (moment-2) with respect to the observed frequency of [C II] at redshift z = 5.54. The black contours correspond to the 3-, 6-, 9-, 12-σ levels of the [C II] moment-0 map (non-JvM corrected). The dashed black line shows the slit in which we created the position-velocity diagram in the right panel, with the center of the slit as a black cross. The solid black line (black polygon) represents the slit used to generate the pv diagram (spectrum) of Figure 4. (c) Right panel: Position-velocity diagram (non-JvM corrected) along the major axis of CRISTAL-05 with a width of 0.245″. The black contours represent the 3, 5, and 7σpv.
Current usage metrics show cumulative count of Article Views (full-text article views including HTML views, PDF and ePub downloads, according to the available data) and Abstracts Views on Vision4Press platform.
Data correspond to usage on the plateform after 2015. The current usage metrics is available 48-96 hours after online publication and is updated daily on week days.
Initial download of the metrics may take a while.