| Issue |
A&A
Volume 690, October 2024
|
|
|---|---|---|
| Article Number | A197 | |
| Number of page(s) | 22 | |
| Section | Extragalactic astronomy | |
| DOI | https://doi.org/10.1051/0004-6361/202348782 | |
| Published online | 10 October 2024 | |
The ALMA-CRISTAL survey
Widespread dust-obscured star formation in typical star-forming galaxies at z = 4–6
1
Department of Astronomy, The University of Tokyo, 7-3-1 Hongo, Bunkyo Tokyo 113-0033, Japan
2
National Astronomical Observatory of Japan, 2-21-1 Osawa, Mitaka Tokyo 181-8588, Japan
3
Faculty of Engineering, Hokkai-Gakuen University, Toyohira-ku, Sapporo 062-8605, Japan
4
Department of Astronomical Science, SOKENDAI (The Graduate University for Advanced Studies), Mitaka Tokyo 181-8588, Japan
5
Departamento de Astronomía, Universidad de Concepción, Barrio Universitario, Concepción, Chile
6
Instituto de Estudios Astrofísicos, Facultad de Ingeniería y Ciencias, Universidad Diego Portales, Av. Ejército 441 Santiago, Chile
7
Sterrenkundig Observatorium, Ghent University Krijgslaan 281 – S9, B-9000 Ghent, Belgium
8
Department of Physics & Astronomy, University College London, Gower Street, London WC1E 6BT, UK
9
Max-Planck-Institut für Extraterrestrische Physik (MPE), Giessenbachstr., 85748 Garching, Germany
10
Las Campanas Observatory, Carnegie Institution of Washington, Casilla 601, La Serena, Chile
11
Department of Physics and Astronomy and George P. and Cynthia Woods Mitchell Institute for Fundamental Physics and Astronomy, Texas A&M University, College Station, TX, USA
12
Leiden Observatory, Leiden University, NL-2300 RA Leiden, Netherlands
13
National Radio Astronomy Observatory, 520 Edgemont Road, Charlottesville, VA 22903, USA
14
Department of Astronomy, University of Virginia, 530 McCormick Road, Charlottesville, VA 22903, USA
15
Jodrell Bank Centre for Astrophysics, Department of Physics and Astronomy, School of Natural Sciences, The University of Manchester, Manchester M13 9PL, UK
16
European Southern Observatory (ESO), Karl-Schwarzschild-Straße 2, 85748 Garching bei München, Germany
17
Centre for Astrophysics and Supercomputing, Swinburne Univ. of Technology, PO Box 218, Hawthorn, VIC 3122, Australia
18
ARC Centre of Excellence for All Sky Astrophysics in 3 Dimensions (ASTRO 3D), Australia
19
International Centre for Radio Astronomy Research, University of Western Australia, 35 Stirling Hwy., Crawley, WA 6009, Australia
20
Institute of Astrophysics, Foundation for Research and Technology-Hellas (FORTH), Heraklion 70013, Greece
21
Chinese Academy of Sciences South America Center for Astronomy (CASSACA), National Astronomical Observatories, CAS, Beijing 100101, PR China
22
Scuola Normale Superiore, Piazza dei Cavalieri 7, I-50126 Pisa, Italy
23
International Centre for Radio Astronomy Research (ICRAR), The University of Western Australia, M468, 35 Stirling Highway, Crawley, WA 6009, Australia
24
Dept. Fisica Teorica y del Cosmos, Universidad de Granada, Granada, Spain
25
Instituto Universitario Carlos I de Física Teórica y Computacional, Universidad de Granada, E-18071 Granada, Spain
26
Max-Planck Institute for Astrophysics, Karl Schwarzschildstrasse 1, 85748 Garching, Germany
27
INAF – OAS, Osservatorio di Astrofisica e Scienza dello Spazio di Bologna, via Gobetti 93/3, 40129 Bologna, Italy
28
Cavendish Laboratory, University of Cambridge, 19 J.J. Thomson Avenue, Cambridge CB3 0HE, UK
29
Kavli Institute for Cosmology, University of Cambridge, Madingley Road, Cambridge CB3 0HA, UK
30
Department of Astronomy and Joint Space-Science Institute, University of Maryland, College Park, Maryland 20742, USA
Received:
29
November
2023
Accepted:
17
June
2024
We present the morphological parameters and global properties of dust-obscured star formation in typical star-forming galaxies at z = 4–6. Among 26 galaxies composed of 20 galaxies observed by the Cycle-8 ALMA Large Program, CRISTAL, and 6 galaxies from archival data, we individually detect rest-frame 158 μm dust continuum emission from 19 galaxies, 9 of which are reported for the first time. The derived far-infrared luminosities are in the range log10LIR [L⊙] = 10.9 − 12.4, an order of magnitude lower than previously detected massive dusty star-forming galaxies (DSFGs). We find the average relationship between the fraction of dust-obscured star formation (fobs) and the stellar mass to be consistent with previous results at z = 4–6 in a mass range of log10M* [M⊙]∼9.5 − 11.0 and to show potential evolution from z = 6 − 9. The individual fobs exhibits significant diversity, and we find a potential correlation with the spatial offset between the dust and UV continuum, suggesting that inhomogeneous dust reddening may cause the source-to-source scatter in fobs. The effective radii of the dust emission are on average ∼1.5 kpc and are about two times more extended than those seen in rest-frame UV. The infrared surface densities of these galaxies (ΣIR ∼ 2.0 × 10¹⁰ L⊙ kpc−2) are one order of magnitude lower than those of DSFGs that host compact central starbursts. On the basis of the comparable contribution of dust-obscured and dust-unobscured star formation along with their similar spatial extent, we suggest that typical star-forming galaxies at z = 4 − 6 form stars throughout the entirety of their disks.
Key words: Galaxy: evolution / Galaxy: formation / Galaxy: structure
© The Authors 2024
 Open Access article, published by EDP Sciences, under the terms of the Creative Commons Attribution License (https://creativecommons.org/licenses/by/4.0), which permits unrestricted use, distribution, and reproduction in any medium, provided the original work is properly cited.
This article is published in open access under the Subscribe to Open model. Subscribe to A&A to support open access publication.
1. Introduction
In recent decades, the star formation activity of galaxies at z ≳ 4 has been progressively studied using rest-frame ultraviolet (UV) emissions (e.g., Steidel et al. 1999; Daddi et al. 2004; Bouwens et al. 2004b, 2007). Because the rest-frame UV continuum emission traces massive young stars that have short (∼100 Myr) lifetimes, these are used to estimate star formation rates (SFRs) through empirical relations (e.g., Kennicutt 1998; Kennicutt & Evans 2012). The Hubble Space Telescope (HST) provides high-spatial-resolution images covering the rest-frame UV emissions of galaxies at z ≳ 4. The spatial extent of the star formation is a fundamental parameter for studying galaxy evolution (e.g., Shen et al. 2003), and has been actively explored since the advent of the HST (e.g., Lilly et al. 1998; Bouwens et al. 2004a; Ferguson et al. 2004; Daddi et al. 2005; Trujillo et al. 2006; Toft et al. 2007). One of the most surprising results from these studies is that the rest-frame UV effective radii of galaxies decrease with increasing redshift (e.g., Hathi et al. 2008; Oesch et al. 2010; van der Wel et al. 2014; Shibuya et al. 2016).
The UV emission is highly sensitive to absorption by interstellar dust, and the absorbed energy is re-emitted as thermal dust continuum radiation at far-infrared (FIR) wavelengths. Therefore, dust continuum emission is an important tracer of obscured star formation. In the past decade, Atacama Large Millimeter/Sub-Millimeter Array (ALMA) observations have provided valuable insights into the spatially resolved properties of high-redshift galaxies, helping us to understand the underlying physical mechanisms driving their morphological evolution. For instance, submillimeter morphologies of dusty star-forming galaxies (DSFGs) have been explored well thanks to the high spatial resolution achieved with ALMA (e.g., Ikarashi et al. 2015; Hodge et al. 2016; Fujimoto et al. 2017; Gullberg et al. 2019). DSFGs show intense dust-obscured star formation (Casey et al. 2014, for review). The observed compactness of the star-forming region compared to the stellar distribution (e.g., Chen et al. 2015; Tadaki et al. 2020a) suggests that they are in the process of forming a bulge (e.g., Simpson et al. 2015; Nelson et al. 2019; Ikeda et al. 2022) or are the progenitors of compact quiescent galaxies (Toft et al. 2014; Barro et al. 2016). The exploration of DSFGs at z < 3 is critical, as dust obscures the majority of star formation activity within the redshift range of 1 < z < 3 (Magnelli et al. 2009, 2011; Moutard et al. 2020).
At redshifts exceeding z > 3, dust-obscured star formation may also be significant (e.g., Rowan-Robinson et al. 2016; Gruppioni et al. 2020; Algera et al. 2023), although it has remained uncertain despite extensive efforts (e.g., Bouwens et al. 2012; Dudzevičiūtė et al. 2020; Zavala et al. 2021; Casey et al. 2021; Fujimoto et al. 2023). Recent ALMA deep observations have been used to study the dust-obscured star formation activity of galaxies at z ≳ 4, which are originally selected by their bright UV emissions (e.g., Watson et al. 2015; Laporte et al. 2017, 2021; Fujimoto et al. 2020; Bakx et al. 2021; Fudamoto et al. 2021; Schouws et al. 2022). Owing to a negative K-correction and the redshift evolution of the dust temperature (Tdust) and star formation activity (e.g., Schreiber et al. 2018; Speagle et al. 2014), it is possible to detect dust continuum emission from galaxies at higher redshifts in the frequency coverage of ALMA (see Blain et al. 2002; Casey et al. 2014). There has been an increase in dust continuum detections of relatively low-mass galaxies (of M* ∼ 1010 M⊙), especially at z ≳ 4 (e.g., Watson et al. 2015; Laporte et al. 2017, 2021; Bowler et al. 2018, 2022; Bakx et al. 2021; Fudamoto et al. 2021; Schouws et al. 2022; Inami et al. 2022; Bouwens et al. 2022; Ferrara et al. 2022; Sommovigo et al. 2022b). Inami et al. (2022) found that a significant fraction of the star formation activity in bright Lyman-break galaxies with stellar masses of M* ∼ 109.5 M⊙ at z ∼ 7 is obscured by dust (see also Bouwens et al. 2022; Ferrara et al. 2022; Sommovigo et al. 2022b; Algera et al. 2023), which is consistent with predictions from cosmological galaxy simulations (e.g., Cullen et al. 2017).
With the individual detection of the dust continuum from individual z ≳ 4 galaxies, there have been extensive efforts to understand the role of dust-obscured star formation in the internal structure of UV-bright galaxies. For instance, Bowler et al. (2022) revealed the spatial correlation between dust continuum detection and redder colors (see also, Bowler et al. 2018). However, spatially resolved observations of dust emission from the galaxies with M* ∼ 1010 M⊙ remain challenging even with ALMA (e.g., Fujimoto et al. 2020; Ginolfi et al. 2020a; Inami et al. 2022; Hygate et al. 2023) and are still limited (e.g., Herrera-Camus et al. 2021; Béthermin et al. 2023; Devereaux et al. 2024; Posses et al. 2024).
In this paper, we investigate the dust-obscured star formation activity and the spatial extent of dust emission in 26 normal, representative star-forming galaxies at z = 4 − 6 using data from the ALMA large program [C II] Resolved ISM in STar-forming galaxies with ALMA (CRISTAL) and some archival data. With the ancillary data set, including deep HST images, we examine the distributions of dust-obscured and unobscured star-forming regions in the early Universe. The paper is organized as follows: Section 2 provides an overview of the CRISTAL survey sample and data products. Section 3 describes the method of size measurements for the ALMA and HST data, and reports the results of the size measurements and associated physical properties. In Section 4, we discuss the physical origin of the dust distribution and the morphological evolution of the CRISTAL galaxies. A summary of this study is presented in Section 5. Throughout this paper, we assume a flat universe with the cosmological parameters of ΩM = 0.3, ΩΛ = 0.7, σ8 = 0.8, and H0 = 70 km s−1 Mpc−1.
2. Observation and data
2.1. The ALMA CRISTAL survey
CRISTAL is an ALMA Cycle-8 large program (2021.1.00280.L; PI: Rodrigo Herrera-Camus, see Herrera-Camus et al. in prep.). The aim of CRISTAL is to spatially resolve the [C II] line and rest-frame 158 μm dust continuum emissions of typical star-forming galaxies at z ∼ 4 − 6. The parent sample of CRISTAL is composed of 75 galaxies whose [C II] emission is detected in the ALPINE survey (ALMA Large Program to Investigate C+ at Early Times; 2017.1.00428.L; PI: O. Le Fèvre; Le Fèvre et al. 2020) with a spatial resolution of ∼1″. For the CRISTAL program, we selected targets based on spectral energy distribution (SED) modeling with LEPHARE (Faisst et al. 2020b; Béthermin et al. 2020), with the following criteria: (1) the specific star formation rate (sSFR) is within a factor of 3 of the star formation main-sequence at each redshift (Speagle et al. 2014; 2) HST images are available; and (3) stellar mass is larger than log10M*[M⊙]≥9.5. All galaxies are located in the COSMOS or GOODS-S field and ∼80% of the galaxies are covered by the ongoing (or planned) JWST observations, such as the COSMOS-Web treasury program (Casey et al. 2022), the PRIMER program (Dunlop et al. 2021), and a GTO program (ID1286). The mass-selected UV-bright galaxies provide a census of the gas, dust, and stars of typical star-forming galaxies on a kiloparsec scale with a combination of high-resolution ALMA and HST/JWST observations.
In addition, we added six galaxies in the COSMOS field (HZ4, HZ7, HZ10, DC818760, DC873756, VC8326, see also Capak et al. 2015; Faisst et al. 2020b; Béthermin et al. 2023; Devereaux et al. 2024) referred to as the CRISTAL+ galaxies (corresponding to CRISTAL-20, 21, 22, 23, 24, 25, respectively) because they have ALMA data with similar spatial resolution and sensitivity to those of CRISTAL (2018.1.01359.S and 2019.1.01075.S; PI: Manuel Aravena, 2018.1.01605.S; PI: Rodrigo Herrera-Camus, 2019.1.00226.S; PI: Edo Ibar). Also, we exclude one galaxy (CRISTAL-18) because it does not exhibit clear [C II] or dust continuum detections, which is possibly due to poor estimation of [C II] frequency. Hence, the CRISTAL extended sample is composed of 24 target fields with available, sensitive ALMA [C II] and dust continuum imaging at ≲0.3″. Details of the survey design and observation setup are presented in Herrera-Camus et al. (in prep.).
2.2. Properties of the CRISTAL galaxies
To uniformly estimate galaxy-integrated physical properties of the CRISTAL galaxies, including several serendipitously detected sources in both [C II] and dust continuum (see Section 3.1), and confirm the robustness of the physical parameter estimations in the individual SED fitting code, we performed multiwavelength SED fitting using the CIGALE code (Boquien et al. 2019).
We cross-matched the positions of the CRISTAL galaxies with publicly available photometric catalogs in COSMOS (COSMOS2015 catalog, Laigle et al. 2016)1 and GOODS-S fields (ASTRODEEP catalog, Merlin et al. 2021). All of the CRISTAL galaxies have counterparts within 1″. The model SEDs are generated with the stellar population synthesis models of Bruzual & Charlot (2003) under a Chabrier (2003) initial mass function with a range of 0.1 − 100 M⊙ assuming exponentially declining star formation histories (SFHs). We adopt the Calzetti et al. (2000) dust attenuation law and the CLOUDY (Ferland et al. 1998) nebular emission line template. Details of the fitting and parameter range are summarized in Appendix B.
We derived stellar masses and SFRs by averaging the SFH over the last 100 Myr (SFRSED) from the best-fit SED models. Figure 1 shows the relation between stellar mass and SFR for the CRISTAL galaxies. We also performed SED fitting for all galaxies at z = 4 − 6 in the COSMOS2015 catalog with the exact same setup as for the CRISTAL galaxies. CRISTAL galaxies have stellar masses of log10M*[M⊙]≳9.5, which are consistent with the results of the LEPHARE code in the ALPINE program within the 1σ uncertainty. Thanks to the selection from the main-sequence, CRISTAL provides a unique subsample with which to explore a representative population of star-forming galaxies at z ∼ 5. We note that the estimated parameters of CRISTAL-01 might be uncertain due to the contamination of Spitzer band photometry by a nearby bright source (see also, Solimano et al. 2024). The stellar mass estimation will be improved by JWST data in the future (Li et al. in prep.) as most of the CRISTAL galaxies have JWST/NIRCam coverage as described in Section 2.1. We also note that CRISTAL-24 is located below the main-sequence due to its low SFRSED. As SFR estimated from UV and IR radiation (SFRUV + SFRIR) is ∼1.3 dex higher than SFRSED, SFRSED derived from optical to NIR photometry appears to be underestimated due to the degeneracy between dust extinction and stellar age (see Appendix C). The stellar masses and SFRs for the CRISTAL galaxies are summarized in Herrera-Camus et al. (in prep.).
 |
Fig. 1. SFR vs. stellar mass with z = 5 main-sequence parameterization (Speagle et al. 2014) and comparison z = 4–6 galaxies in the COSMOS catalog (Laigle et al. 2016). Pink squares are primary targets of the CRISTAL program and blue squares are serendipitously detected galaxies and additional CRISTAL+ galaxies (see Section 2.1). The sources whose dust continuum is detected with S/N > 4 are marked with crosses. The CRISTAL galaxies are located within ±0.5 dex of the star formation main-sequence at z = 5, suggesting they are representative populations at this epoch. |
2.3. Observation and data products
CRISTAL observations cover a wide range of spatial frequencies in the uv plane with a combination of extended (C43-4/5/6) and compact (C43-1/2) array configurations to achieve not only high spatial resolution (∼0.3″, corresponding to ∼1.9 kpc in physical scale at z = 5) but also a large maximum recoverable scale (∼4.5″, corresponding to ∼28.3 kpc in physical scale at z = 5). Typical beam sizes are ∼0.4″, which is an improvement by a factor of ∼2–3 compared with the previous dataset. We determine the spectral frequency coverages by centering [C II] frequency derived from the integrated [C II] spectral line profile in the ALPINE survey. Observations were carried out from November 2021 to April 2023. Details of the calibration, reduction, and data products will be presented in Herrera-Camus et al. (in prep).
In addition to the CRISTAL observations taken in two array configurations, all CRISTAL galaxies have archival observations (2012.1.00978.S, 2012.1.00523.S, and 2017.1.00428.L). As these archival data typically cover shorter spatial frequency ranges in the uv plane compared with the CRISTAL observations, adding these archival data improves the sensitivities, especially to extended emissions. We use the archive data by combining visibilities with the CASA/CONCAT task.
3. Analysis and results
3.1. Dust continuum-detected galaxies
In this paper, we focus on the dust continuum emission of CRISTAL galaxies. We exclude visibility data in the frequency range corresponding to the [C II] emission line. To ensure that we avoid contamination of the dust continuum by the [C II] lines, we excluded ±0.45 GHz from central line frequencies, which corresponds to ±400 km s−1 and ±450 km s−1 for z = 4.5 and 5.5, respectively; we note that the broad component of the [C II] emission lines can reach ∼250 km s−1 in FWHM/2 (Ginolfi et al. 2020b). Next, we built multifrequency synthesis (continuum) images with CASA task TCLEAN to look at their signal-to-noise ratio (S/N). Here we did not apply the CLEAN algorithm (i.e., dirty images) or primary beam correction in order to ensure a consistent comparison between noise and signals (cf., JvM correction, Czekala et al. 2021, Gonzalez-Lopez et al. in prep.). To avoid low S/N for extended emission in galaxies and investigate how well the extended emission of galaxies is recovered, we created low-resolution images with a uv taper of 0.25″, 0.5″, 1.0″, and 2.0″, as well as high-resolution images with natural weighting. In all images with different resolutions, we picked maximum fluxes in dust continuum images within a circle of 0.5″ in radius around the position of the previous [C II] detection. The noise is estimated by calculating 3σ clipped root mean square (RMS) values of all pixels within the field of view (FoV) where the primary beam correction value is between 0.9 and 0.5; this is to ensure that we avoid the impact of the target galaxy. Typical RMSs are 10–20 μJy beam−1, which is about two times better than the previous dataset.
In the vicinity of the main targets, we serendipitously found two sources with > 8σ [C II] detection, > 4σ dust continuum detection, and HST detection (CRISTAL-01b and 07c). We include these galaxies in the main analysis. We note that these galaxies were not identified in the previous surveys due to the shallower observations. These fainter dusty galaxies are interesting regarding the dust-obscured SFR density at high-z (e.g., Gruppioni et al. 2020; Fudamoto et al. 2021). Please refer to Hererra-Camus et al. (in prep.) for further details on serendipitous [C II] and dust detections around CRISTAL galaxies. In a total of 26 extended CRISTAL samples (18 original CRISTAL targets, 6 CRISTAL+ galaxies, and 2 serendipitously detected galaxies in the original CRISTAL fields), we find that 7, 8, and 11 galaxies have dust continuum emissions with S/N < 4, 4 ≤ S/N < 6.5, and S/N ≥ 6.5, respectively.
We show thumbnails of the dust-detected CRISTAL galaxies in Figure 2. These galaxies tend to have higher stellar masses (log10M* [M⊙]≳9.7) and SFRs (![$ \log_{10} \text{ SFR}\,[M_{\odot}\,\text{ yr}^{-1}]\gtrsim1.5 $](/articles/aa/full_html/2024/10/aa48782-23/aa48782-23-eq2.gif) ). The median stellar mass and SFR of the dust-detected and undetected sample are log10M* [M⊙] = 10.1,
). The median stellar mass and SFR of the dust-detected and undetected sample are log10M* [M⊙] = 10.1, ![$ \log_{10} \text{ SFR}\,[M_{\odot}\,\text{ yr}^{-1}] = 1.8 $](/articles/aa/full_html/2024/10/aa48782-23/aa48782-23-eq3.gif) and log10M* [M⊙] = 9.5,
and log10M* [M⊙] = 9.5, ![$ \log_{10} \text{ SFR}\,[M_{\odot}\,\text{ yr}^{-1}] = 1.4 $](/articles/aa/full_html/2024/10/aa48782-23/aa48782-23-eq4.gif) , respectively. The detection rate is 89% (16/18) in a stellar mass range of log10M* [M⊙]> 9.7 (Figure 1). Our detections of faint galaxies in the dust continuum down to the stellar mass of M* ∼ 109.5 M⊙ provide new insights into the dust-obscured star formation activities of less massive galaxies.
, respectively. The detection rate is 89% (16/18) in a stellar mass range of log10M* [M⊙]> 9.7 (Figure 1). Our detections of faint galaxies in the dust continuum down to the stellar mass of M* ∼ 109.5 M⊙ provide new insights into the dust-obscured star formation activities of less massive galaxies.
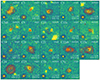 |
Fig. 2. Thumbnails of the dust-detected CRISTAL galaxies. The background images are HST/F160W images. The natural-weighted and natural-weighted+0.5″-tapered rest-frame 158 μm dust continuums are also shown in red and blue contours, respectively. An average beam size of natural-weighted continuum images is 0.46″ = 2.9 kpc. The contour levels are shown every 1σ within 3–9σ and every 2σ from 9σ, respectively. For CRISTAL-22, contour levels are shown every 2σ from 3σ. The source ID, redshift, S/N, and morphological classification based on the HST images are also shown in each panel. |
3.2. Dust-size measurement
In this section, we characterize the spatial extent of the rest-frame 158 μm dust continuum emissions in the CRISTAL galaxies. In principle, it is possible to measure the size of a galaxy by deconvolving an image with a clean beam. However, reconstructed images through the Fourier transform of the visibility data and nonlinear CLEAN algorithm strongly depend on the uv coverage of visibilities and its weight, which could lead to systematic uncertainties. Moreover, as about one-third of CRISTAL galaxies lack high S/N (S/N ≳ 5) in the dust continuum images, image-based analysis may lead to uncertain measurements. To achieve homogenous size measurements and to use all of the information provided by observations, we directly measure the effective radii of dust continuum emission from the visibility data.
Recent high-resolution ALMA observations revealed that DSFGs are generally consistent with a Sérsic profile (Sérsic 1963) with an index of n ∼ 1 (e.g., Hodge et al. 2016; Gullberg et al. 2019). Even for fainter sources, Tadaki et al. (2020a) suggest that their surface density profiles are better characterized by an exponential profile with n = 1 than with a Gaussian profile with n = 0.5. Therefore, we fit a 2D exponential profile (n = 1) using UVMULTIFIT (Martí-Vidal et al. 2014).
The observed visibilities are presented as a combination of amplitude and phase from all sources within the FoV. Hence, to extract information specific to the target galaxy, it is necessary to subtract contributions from other continuum sources within the FoV, especially when they are close to the target. First, we identified contaminant continuum emitters in the FoV with 4.5σ, because the sources above this significance level may significantly affect the measurements of the target galaxy. Sources more than 2″ apart from the target galaxy were subtracted using the CASA TCLEAN task. We cleaned down to 1.5σ by applying 2″ masks from the source position to extract the clean component of the nearby sources and subtracted them from the observed visibilities with the CASA task UVSUB. We note that there is no significant difference if we conduct the two-component fitting to take into account the other continuum sources. When we clearly find the existence of a second component in the residual map after subtracting the best-fit single component with S/N > 10 (CRISTAL-22), we use the results of the two-component fitting. As the CRISTAL galaxies typically do not have high S/N (S/N > 5) in the dust emission (Table 1), the axis ratio (q) is not well constrained in most galaxies. We therefore measured the effective radii of the dust emission by assuming a circular exponential disk with a fixed value of q = 0. We created residual maps from the visibilities where the best-fit model is subtracted in the uv plane.
Dust continuum properties of the CRISTAL galaxies.
Figure 3 shows an example of a dirty map, a residual map, and a real part of the observed visibilities as a function of uv distance. Because there is no peak above ∼3σ in the residual maps, the exponential disk model seems to successfully represent the spatial distribution of dust emission. Thanks to the observations in the extended array configurations, we successfully capture a decline of the real part of the visibilities, which clearly suggests the dust continuum from the source is spatially resolved. A signal at the real part with increasing uv distance is the reciprocal of the spatial extent at an image plane, because the Fourier transform of the profile in the image plane is a profile in the visibility plane. All of the original, model, and residual maps are shown in Appendix G.
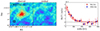 |
Fig. 3. An example of the fitting in the visibility plane. (left) Observed and residual (observed – best-fit model) dirty map of the dust continuum emission. The synthesized beam is shown in the bottom left. The black contour shows every 1σ from ±3σ. (right) Real part of the observed visibilities as a function of uv distance with different binning scales. The best-fit exponential disk model and its 1σ uncertainty are shown in a red solid line and shaded area, respectively. |
To check the goodness of the visibility fitting, we compared the flux densities of dust continuum emission estimated from the visibility fitting and those from the low-resolution image (Figure 4). Here, we made the images with a beam size of 3.0″ by applying CASA/IMSMOOTH to the 2.0″-tapered images to transform the resolution of each source to a common beam size and to make sure that all of the flux densities are included within a single beam. We then measured source flux densities with the method used in Section 3.1. We find the visibility fitting recovers the flux densities well in various sources from the brightest to the faintest among the CRISTAL galaxies, except for a very extended source (CRISTAL-21). The inconsistency of flux densities in CRISTAL-21 likely originates from extrapolation of the best-fit model toward the short uv distance regime due to a low sensitivity at ≤50 kλ. When the additional 2″ taper is applied to CRISTAL-21, we find a better match with the visibility-based estimation. To maintain consistency between the detected and undetected galaxies in the dust continuum, hereafter we use the flux densities and 1σ uncertainties estimated from the low-resolution (i.e., tapered) images.
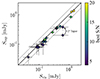 |
Fig. 4. Comparison of the flux density estimated from UVMULTIFIT and Taper images, color-coded according to the source S/N. The black solid line and dashed lines indicate a one-to-one relation and ±0.3 dex, respectively. We note that the visibility fitting has recovered the fluxes of the sources in the lower-resolution images well within the 1σ errors, except for CRISTAL-21 (see text). |
We summarize the fluxes measured in visibilities via UVMULTIFIT and low-resolution images in Table 1. As about half of the CRISTAL galaxies have 4.4 < S/N < 5.5 in the dust continuum images (see Table 1), we conduct a Monte Carlo simulation and a stacking analysis to confirm the validity of the size measurement in Appendix D. We do not find any systematic offset regardless of the source S/N in the Monte Carlo simulation and there is no clear difference between the stacked size and the average of the individual sizes in the stacking analysis. Therefore, we conclude that the fitting results are reliable. We note that better S/Ns are necessary to measure more robust sizes (e.g., Simpson et al. 2015).
3.3. Far-infrared luminosity
Because most of the CRISTAL galaxies have only single-band ALMA detections in the dust continuum, it is not possible to estimate properties such as dust temperature (Tdust) and emissivity (βdust), which are crucial for determining the shape of the FIR SED. Béthermin et al. (2017) presented a best-fit Draine & Li (2007) dust emission model for stacked fluxes of the main-sequence galaxies at z ∼ 4 with Spitzer, Herschel, LABOCA, and AzTEC data (see also Béthermin et al. 2015). This best-fit FIR SED agrees with the stacked fluxes of z = 4 − 6 main-sequence galaxies with  (Béthermin et al. 2020), corresponding to a modified blackbody with a dust temperature of Tdust ∼ 42 K. Indeed, some CRISTAL galaxies have rest-frame 110 and 200 μm observations and show a consistent Tdust estimation with the assumption of Tdust ∼ 42 K (Faisst et al. 2020a), while there exists a variation in the FIR SED with the range of dust temperatures of Td ∼ 30–60 K. Sommovigo et al. (2022a) apply a physically motivated model to characterize the Tdust validated in Sommovigo et al. (2021) for the z ∼ 5 galaxies, which partly overlaps with that of the CRISTAL galaxies. The derived average Tdust is 48 ± 8 K, and is broadly consistent with the assumption of 42 K. Because the CRISTAL galaxies are a subsample of the galaxies studied in Béthermin et al. (2020), we used the best-fit FIR SED presented in Béthermin et al. (2017) to estimate the total infrared (IR; 8–1000 μm) luminosities of the CRISTAL galaxies. We calculated the total FIR luminosities of the CRISTAL galaxies by converting the measured dust continuum fluxes at the rest-frame 158 μm using a scaling factor described by Béthermin et al. (2020, νLν = 158 μm/LIR = 0.133). The resulting LIR of the CRISTAL galaxies fall within a range of log10LIR [L⊙] = 10.9–12.4.
Figure 5 shows the total IR luminosity against the circularized effective radius (left) or the surface IR luminosity ≡ΣIR = LIR/2πre, dust2 (right) of dust continuum emission. As a comparison, we show the results of different galaxy populations, namely submillimeter galaxies (SMGs) at z ∼ 2.5 (Gullberg et al. 2019), lensed SMGs at z ∼ 3–6 (Spilker et al. 2016), DSFGs at z = 4–6 (Riechers et al. 2014; De Breuck et al. 2014; Hodge et al. 2015; Gómez-Guijarro et al. 2018; Casey et al. 2019; Tadaki et al. 2020b), and DSFGs at z ∼ 2 (Tadaki et al. 2020a). The comparison galaxies are mainly starburst galaxies above the main-sequence at the corresponding epochs, and their FIR luminosities are derived by some templates of FIR SEDs (e.g., Wuyts et al. 2008; da Cunha et al. 2015 or modified blackbody fitting with the typical dust temperature Tdust = 30 − 50 K. Solid and dashed lines indicate a series of re and LIR, each corresponding to the median IR surface densities (ΣIR) of the respective sample, as indicated by the matching color.
 |
Fig. 5. Total IR luminosities and (left) effective radii and (right) surface IR luminosities for CRISTAL galaxies, SMGs at z ∼ 2.5 (Gullberg et al. 2019), lensed SMGs at z ∼ 3–6 (Spilker et al. 2016), SMGs at z = 4–6 (Riechers et al. 2014; De Breuck et al. 2014; Hodge et al. 2015; Gómez-Guijarro et al. 2018; Casey et al. 2019; Tadaki et al. 2020b), and DSFGs at z ∼ 2 (Tadaki et al. 2020a). Solid and dashed lines corresponding to each color show the median ΣIR for each sample. Gray solid lines show the effective radii and surface IR luminosities at intervals of 0.5 dex from 0.1 kpc to 10 kpc. The black dashed line shows the representative beam size ( |

The median values of ΣIR are  for lensed SMGs,
  for SMGs at z ∼ 2.5,
  for SMGs at z = 4–6, and
  for DSFGs at z = 2. The median ΣIR of the CRISTAL galaxies is
  , which is approximately ten times smaller than that of the central compact star-forming regions of DSFGs and SMGs (Figure 5 right), and is similar to that of the extended dust continuum component of the SMGs reported in the stacked spatial distribution (Gullberg et al. 2019,
  ), which is considered to be a disk component. Our representative population of galaxies at z ∼ 4–6 seems to undergo moderate star formation with a lower ΣIR than those of DSFGs, except for some galaxies (CRISTAL-22 and 24) showing the high ΣIR comparable with DSFGs and SMGs. Interestingly, Ferrara et al. (2022) analytically derive the LIR and dust distribution radius of the REBELS (Reionization Era Bright Emission Line Survey; Bouwens et al. 2022) galaxies at z ∼ 7, finding a more compact distribution (rd ∼ 0.3 kpc) and a similar LIR to that of the CRISTAL galaxies (log10LIR [L⊙]∼11.8), which results in a higher ΣIR (
![$ \log_{10}\Sigma_{\mathrm{IR}}\,[L_{\odot}\,\text{ kpc}^{-2}]\sim12.1 $](/articles/aa/full_html/2024/10/aa48782-23/aa48782-23-eq51.gif) ) than our measurements. Direct measurement of the dust continuum distribution by the future ALMA high-resolution observations for z > 6 galaxies will enable us to compare our results with those for galaxies at z > 6.
) than our measurements. Direct measurement of the dust continuum distribution by the future ALMA high-resolution observations for z > 6 galaxies will enable us to compare our results with those for galaxies at z > 6.
3.4. Rest-frame UV size measurement
To compare the spatial extent of the dust-obscured and unobscured star formation, we measured the rest-frame UV sizes of the CRISTAL galaxies. In this section, we summarize the size measurements of the rest-frame UV emission observed with HST.
Because all of the CRISTAL galaxies have WFC3/F160W coverage and 1.6 μm corresponds to rest-frame ∼2400–3000 Å in the redshifts of the CRISTAL galaxies (z = 4.4 − 5.7), we consistently use images from the WFC3/F160W observation to measure the rest-frame UV sizes of the CRISTAL galaxies.
We measured the HST size based on a 2D surface-brightness profile fitting with GALFIT (Peng et al. 2002). First, we made a point-spread function (PSF) in the same manner as previous studies (e.g., Skelton et al. 2014). We selected point sources (i.e., stars) based on the following criteria: (1) ratios of fluxes with 2.0″ apertures and 0.5″ apertures are in the range of 1.2 to 1.4 based on the tight flux correlation in the point source; and (2) S/Ns are greater than 7500. We excluded the point sources with nearby sources within 3″. Because the central position of the point source does not necessarily correspond to the central position of the pixel, we reprojected the 2D point-source profile with a linear interpolation to the central position derived from 2D Gaussian fitting. We then obtained the PSF by stacking these reprojected stellar profiles after normalizing with the total flux of each source. We also created sigma and mask images to estimate the weight of individual pixels and excluded neighboring objects of the target galaxy from the fittings. The sigma images are made from drizzle weight maps and mask images are produced from segmentation maps from SEXTRACTOR with the parameters DETECT_MINAREA = 5, DETECT_THRESH = 2, DETECT_NTHRESH = 16, and DEBLEND_MINCONT = 0.0001. We input the sigma, mask, and PSF to GALFIT and fitted a single Sérsic profile to the 2D surface-brightness profile of each galaxy. Here, we fixed n = 1 to ensure fair comparisons with the dust size measurement, while there is no major impact without this assumption (see Appendix E). We note that there is no systematic difference if we do not fix the Sérsic index, except for CRISTAL-25, which shows a large Sérsic index in the best-fit model (see Figure E.1). Finally we obtained an effective radius along the major axis  and axis ratio q, and converted these to the circularized effective radius re, UV through
  . When carrying out this procedure, if the fitting does not converge with the axis ratio as a free parameter, we fix the axis ratio to unity, as in the size measurement in the dust continuum. The original, model, and residual maps are shown in Appendix G. For CRISTAL-22, we only measured the size of the main component by masking the second component, because the latter is too faint and the fitting does not converge (see Figure 2).
In Figure 6, we compare measured sizes of the dust-obscured star formation derived from rest-frame 158 μm dust continuum observations by ALMA and the dust-unobscured star formation derived from rest-frame UV continuum observations by HST/WFC3 F160W. The dust-obscured star formation appears to be approximately twice as spatially extended as the dust-unobscured star formation on average. We discuss the spatial extent of the dust and UV emissions in Sect. 4.3.1. Recent findings from the ALPINE survey indicate a similar result (Pozzi et al. 2024). The measured dust and rest-frame UV sizes are summarized in Table 1.
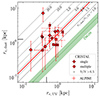 |
Fig. 6. Size comparison of the dust continuum (re, dust) and the UV continuum (re, UV). The black solid and dashed lines indicate the size ratios of the UV and dust continuum. The average size ratio of the CRISTAL galaxies (re, dust/re, UV ∼ 1.8) is shown with the red solid line. Recent results from the ALPINE survey are also shown in red open circles (Pozzi et al. 2024). The black vertical and horizontal lines show representative beam sizes (σbeam) in HST (x-axis) and ALMA (y-axis). The green shaded region shows the size ratio predicted in the illustrious TNG50 simulation (Popping et al. 2022). Overall, CRISTAL galaxies possibly have a more extended distribution in dust thermal emission than in UV radiation, which is contrary to expectations based on simulation. |
4. Discussion
4.1. Fraction of obscured star formation
The fraction of obscured star formation (fobs) is defined as the ratio of the dust-obscured star formation detected in rest-frame IR continuum emission to the total star formation rate, where this latter is calculated by accounting for dust-unobscured star formation observable in rest-frame UV continuum emission, as follows:
In general, the obscured fractions show a positive correlation with the stellar masses of the galaxies (e.g., Whitaker et al. 2017; Reddy et al. 2018). Some studies present the same trend in IR excess (IRX; log10LIR/LUV), which is also an indicator of the obscured star formation (e.g., Pannella et al. 2009, 2015; Bouwens et al. 2016; Dunlop et al. 2017; McLure et al. 2018; Bouwens et al. 2020). Based on the results of Whitaker et al. (2017), the obscured fractions do not exhibit any clear evolution from z ∼ 2.5 to z ∼ 0; they show an average obscured fraction of fobs = 0.8 using the Dale & Helou (2002) template, and 0.6 when using the Magdis et al. (2012) and Béthermin et al. (2015) templates at a mass of M* ∼ 1010 M⊙. Recent ALMA studies suggest a possible decrease in the mass dependence of fobs at a high mass range (M* ≳ 1010 M⊙) at z > 4 (Fudamoto et al. 2020b,a; Inami et al. 2022; Algera et al. 2023).
In order to confirm whether or not similar trends can be observed in our data, we calculated the average obscured fraction of the sample binned by stellar mass. We divided the sample into three ranges with log10M* [M⊙]=[9.3 : 9.8], [9.8: 10.2], and [10.2: 10.9] so that the number of galaxies in each bin is similar. For the stacking analysis, we made the images with the taper scale of 2″ after shifting the phase center of the image to the central position of the [C II] emission (Ikeda et al. in prep.). We then applied the CASA/IMSMOOTH to unify the beam size to 3″ following the flux measurements in Section 3.2 and performed median stacking of the images. We take into account the redshift difference of the target galaxies by scaling the images with the factor of (1 + z)/dL2 because our calculation from S158 μm to LIR is proportional to the reciprocal of the factor. We note that the offset between the dust continuum and [C II] emission does not impact the result because the typical offset (∼0.2″) is much smaller than the 3″ beam size. We confirm that the results do not change significantly if we adopt the inverse LUV weight following Fudamoto et al. (2020a). The IR luminosity is derived from a peak flux of the dust continuum as in Section 3. We calculated the median LUV of the galaxies obtained from the best-fit SEDs in each bin. We then converted these into SFRUV and SFRIR following Madau & Dickinson (2014). Figure 7 (left) illustrates the average fobs in each stellar mass bin (fobs–M*). Our results support the idea that the obscured fraction in the range of M* < 1010 M⊙ does not show clear evolution from z = 0 − 2.5 (Magdis et al. 2012 and Béthermin et al. 2015) to z ∼ 5. On the other hand, we find a possible evolution of the obscured fraction from z ∼ 5 to z ∼ 0–2.5 in the range of M* > 1010 M⊙, which implies a build up of dust in massive galaxies. We note that, as our sample selection is originally based on a bright UV continuum and emission lines, it likely leads to missing obscured dusty galaxies (e.g., Franco et al. 2018; Yamaguchi et al. 2019). We find our results show very good agreement with the results at z = 4.5 and z = 5.5 from the ALPINE survey (Fudamoto et al. 2020a), and z = 6–9 from the REBELS survey (Algera et al. 2023). Compared with other results at z = 6.5–7.7 from the REBELS survey (Bowler et al. 2023), our results indicate slightly lower fobs at M* < 1010 M⊙. Bowler et al. (2023) mentioned the effect of scatter in the obscuration or the clumpy morphology of their target galaxies as possible causes of such a difference.
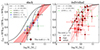 |
Fig. 7. Obscured fraction as a function of stellar masses. Black solid and dashed lines show the results from Whitaker et al. (2017) with two different dust emission templates: that of Dale & Helou (2002) “D02” and that of Magdis et al. (2012) and Béthermin et al. (2015) “M12, B15”. (left) Results from our stacking analysis with those in previous studies. The obscured fraction increases as a function of the stellar mass, and this trend is in good agreement with the results at z ∼ 5 from the ALPINE survey (Fudamoto et al. 2020a) and those at z ∼ 6–9 from the REBELS survey (Algera et al. 2023); another result at z ∼ 6.5–7.7 from the REBELS survey (Bowler et al. 2023) shows the opposite trend, with slightly higher fobs at M* < 1010 M⊙. (right) Results for the individual galaxies. The diamonds and squares correspond to the two classifications of single and multiple. We also show the results of the galaxies detected in the dust continuum at z ∼ 5 (Fudamoto et al. 2020a). The CRISTAL observations capture the galaxies with smaller fobs compared with previous z ∼ 5 galaxies individually detected thanks to deep observations. There is significant variation in the fobs–M* relation from galaxy to galaxy. |
Figure 7 (right) shows the obscured fraction of the individual galaxies as a function of stellar mass. The CRISTAL galaxies show a large diversity of fobs = 0.2–0.9. As we used the same scaling factor as Fudamoto et al. (2020a) to convert S158 μm into LIR (Béthermin et al. 2020), lower values of fobs suggest smaller S158 μm. Some CRISTAL galaxies show smaller fobs than galaxies individually detected in Fudamoto et al. (2020a), where they find a median fobs of 0.70 compared to 0.61 in our work. The smaller values of fobs are consistent with those stacking analyses (Fudamoto et al. 2020a; Algera et al. 2023). We discuss the variation of fobs in the following section based on the coverage of the wide coverage in fobs.
4.2. Origin of the spread in the fobs–M* plane
In Figure 7 (right), we find a large spread in the fobs–M* relation across galaxies in the CRISTAL sample. As more than 30% of the galaxies deviate from the average relationship derived from the stacking analysis, even when considering 1σ errors, the variance is not likely to come from the measurement errors. A similar variation has been reported in ALMA observations toward UV-bright galaxies at z > 4 (Fudamoto et al. 2020a; Inami et al. 2022). They investigated the relationship between UV continuum slope (βUV) and IRX. Previous studies predict that the scatter could be caused by dust-grain type (e.g., Ferrara et al. 2017), dust geometry (e.g., Witt & Gordon 2000), stellar populations (e.g., Popping et al. 2017a), stellar or dust assembly (e.g., Popping et al. 2017b), spatial decoupling of UV and IR emission due to galactic interaction or dust-enshrouded nuclear starbursts (e.g., Howell et al. 2010; Faisst et al. 2017), or inclination (e.g., Wang et al. 2018). As it is difficult to demonstrate the dependence of dust properties –such as grain type and geometry– and stellar properties –such as assembly history– based on our ALMA observations, we discuss the potential correlation between fobs and morphology. We note that no correlation is identified between fobs and the stellar ages derived from SED fitting obtained in Section 2.2.
4.2.1. Inhomogeneous dust reddening
The first possible explanation for the variation in the obscured fraction is inhomogeneous dust reddening, such as that caused by a global spatial offset between dust-enshrouded and dust-free star-forming regions. Recently, Bowler et al. (2022) discussed the impact of the spatial distribution of rest-UV and IR emission on the UV–IR energy balance at z ∼ 7 (see also Inami et al. 2022). They found a correlation between a redder UV slope and a peak of FIR emission detected in ALMA and suggest that inhomogeneous dust reddening might be responsible for variations in the spatially integrated IRX–βUV relation (see also, Vallini et al. 2015; Behrens et al. 2018). Faisst et al. (2017) suggest that geometrical effects, such as the distance between stars and clouds, are one of the major causes of the spread in the IRX–βUV relation (see also, Maiolino et al. 2015).
In Figure 8, we show the distance from our best-fit fobs–M* relation (Δfobs) as a function of the spatial offset seen at the central position between the UV and dust continuum estimated at the same time as the size measurement procedure (Sections 3.4 and 3.2). For galaxies without clear main UV components (CRISTAL-02 and 10), it is difficult to define the spatial offset and therefore we excluded them from our analysis. We note that the offsets do not originate from artifacts (i.e., astrometry) because the HST and ALMA images are well aligned with each other in 0.05 arcsec scale (see Appendix F), which is much smaller than the typical offset value. We find a negative correlation between Δfobs and the spatial offset within 1σ uncertainty of the correlation coefficient of  with a p-value of 0.082. This potential correlation may suggest that the decoupling of UV and IR emissions contributes to the escape of UV photons from interstellar space, and drives the variation in the obscured fraction. We note that the relatively high p-value is not sufficient to confirm this correlation with high significance. Further observations of a large number of similar galaxies may reveal whether or not this potential correlation is real.
 |
Fig. 8. Distance from the average fobs–M* relation as a function of (left) the spatial offset at the central position between UV and dust emission, (middle) the size ratio between UV and dust emission, and (right) the surface density of LIR. Galaxies without clear main UV components and without dust continuum detection at < 4σ are not shown. Based on the Spearman correlation coefficients and p-values, fobs has a correlation with the UV-dust spatial offset and ΣIR. On the other hand, there is no correlation between fobs and the size ratio between UV and dust emission. |
What is the cause of spatial offset between UV- and IR-bright star-forming regions? Numerical simulations incorporating radiative transfer suggest that galactic interaction or feedback are possible mechanisms to decouple UV- and IR-bright regions (e.g., Yajima et al. 2011; Safarzadeh et al. 2017; Arata et al. 2019; Liang et al. 2021). For the feedback case, it is expected that galaxies with higher sSFR will tend to show larger peak offsets because star formation-driven outflows are more prevalent (e.g., Fujimoto et al. 2020; Faisst et al. 2020b; Ginolfi et al. 2020b). We divide the sample into two groups within sSFR < 4 Gyr−1 and sSFR > 4 Gyr−1 based on the total (IR+UV) SFR and compare the peak offset between UV and IR. There is no clear difference in the peak offset between the two groups, with 0.150 ± 0.046″ for the galaxies within sSFR < 4 Gyr−1 and 0.150 ± 0.038″ for sSFR > 4 Gyr−1.
For the merger case, we expect a larger spatial offset in the “multiple” sample than in the “single” sample because the galaxies classified as “multiple” correspond to a kind of early-stage merger. However, the peak offset between UV and IR does not exhibit a systematic offset between “multiple” (0.145 ± 0.048″) and “single” (0.155 ± 0.041″). Therefore, the interaction is not likely to be the primary cause of the decoupling. While the merger activity does not generate the decoupling of the dust-obscured and unobscured star-forming regions, it may accelerate the obscured star formation. In Figure 7, we plot our result separately for single (isolated) and multiple (merging) galaxies. Most highly obscured galaxies tend to have high total SFRs and show merging signatures in HST images. Also, the average obscured fraction, SFR, and sSFR of the multiple galaxy sample (⟨fobs⟩multiple = 0.54 ± 0.04, ![$ \langle\, \log_{10} \text{ SFR}\,[M_{\odot}\,\text{ yr}^{-1}] \rangle_{\mathrm{multiple}} = 1.97^{+0.11}_{-0.13} $](/articles/aa/full_html/2024/10/aa48782-23/aa48782-23-eq56.gif) , and
, and ![$ \langle\, \log_{10} \text{ sSFR}\,[\text{ Gyr}^{-1}] \rangle_{\mathrm{multiple}} = 7.0^{+2.9}_{-5.0} $](/articles/aa/full_html/2024/10/aa48782-23/aa48782-23-eq57.gif) ) is higher than that of the single galaxy samples (⟨fobs⟩single = 0.42 ± 0.04,
) is higher than that of the single galaxy samples (⟨fobs⟩single = 0.42 ± 0.04, ![$ \langle\, \log_{10} \text{ SFR}\,[M_{\odot}\,\text{ yr}^{-1}] \rangle_{\mathrm{single}} = 1.59^{+0.10}_{-0.11} $](/articles/aa/full_html/2024/10/aa48782-23/aa48782-23-eq58.gif) , and
, and ![$ \langle\, \log_{10} \text{ sSFR}\,[\text{ Gyr}^{-1}] \rangle_{\mathrm{single}} = 4.4^{+1.7}_{-3.2} $](/articles/aa/full_html/2024/10/aa48782-23/aa48782-23-eq59.gif) ), while the difference in sSFR is within the 1 σ uncertainties. Our results suggest that galaxy interactions may boost not only star formation activity but also the obscured fraction within almost the same stellar mass range, and the mixture of the different merger stages and isolated disks leads to the variation in the fobs–M* plane.
), while the difference in sSFR is within the 1 σ uncertainties. Our results suggest that galaxy interactions may boost not only star formation activity but also the obscured fraction within almost the same stellar mass range, and the mixture of the different merger stages and isolated disks leads to the variation in the fobs–M* plane.
Another potential physical reason for the displacement is a multiphase structure of the ISM, for which one-zone ISM models assumed in the IRX-β (or fobs-M*) relation cannot be applied. As discussed in Ferrara et al. (2022), the molecular index Im (=F158/F1500/(β − βint)) might represent a good indicator of this kind of multiphase ISM structure. We tested this hypothesis by comparing the UV–dust spatial offset and Im under the assumption of βint = −2.41 following Inami et al. (2022), but we do not find a clear correlation between them ( with a p-value of 0.401). This result is mainly due to the small measured values of the UV–dust offset compared to Inami et al. (2022). However, interestingly, CRISTAL-24 shows a very high Im of ∼5000 with a relatively blue UV slope of β = −1.55. An inconsistent SFRSED and SFRUV + IR in CRISTAL-24 described in Section 2.2 may indicate the multiphase and multicomponent nature of this galaxy (see also, Sommovigo et al. 2022a).
4.2.2. Concentration of the star-forming regions
In this section, we compared fobs with the compactness of the star-forming regions. Whitaker et al. (2017) indicate that the spatial extent of the star-forming region affects the obscured fraction (see also, Smail et al. 2021). Howell et al. (2010) mentioned that a dust-enshrouded central starburst may lead to diversity in the obscured fraction. We derived the compactness of the dust-obscured star-forming region as ΣIR computed from IR luminosities and effective radii of the dust continuum. We also checked the dependence of Δfobs on the size ratio between UV and dust emission (re, dust/re, UV). We find that there is no clear correlation between Δfobs and the size ratio ( with a p-value of 0.693 respectively) but that ΣIR shows a potential correlation with fobs (
 with a p-value of 0.245). Enhancement of the dust-obscured star formation activity could relate to the concentration of the young, active dust-enshrouded star formation regions, which may be accelerated by unstable disks with a high gas-mass fraction (Dekel et al. 2009; Tacconi et al. 2013; Scoville et al. 2017; Dessauges-Zavadsky et al. 2020). As starbursts induced by galaxy interactions could concentrate the gas and dust into the central parts of galaxies (e.g., Barnes & Hernquist 1996), these interactions may accelerate the dust obscuration of the galaxy and may be able to explain the positive trend between the obscured fraction and ΣIR or merging signatures.
4.2.3. Inclination
Both observational (e.g., Leslie et al. 2018) and simulation (e.g., Jonsson et al. 2010) studies suggest that an apparent UV–IR energy balance can be affected by the viewing angle of disk galaxies; that is, their inclination. There is a systematic offset of ∼0.5 dex in IRX values between edge-on and face-on galaxies (Wang et al. 2018). While the inclinations are calculated from the axis ratios, the axis ratios of the UV continua may not be a good indicator of inclination because of the severe dust attenuation. We do not find a correlation between the axis ratio of the UV continuum and Δfobs ( with a p-value of 0.761). Moreover, only a few CRISTAL galaxies have constraints on the axis ratios in dust emission. The current data quality is not sufficient to discuss the possibility that inclinations explain the variation in fobs. It is worth noting that two galaxies with relatively large fobs (> 0.7) have axis ratios of ∼0.2 − 0.3 in the dust emission, suggesting that an edge-on view of disk galaxies may make the obscured fraction higher. Also, we note that the axis ratio of [C II] emission also possibly correlates with Δfobs with
  and a p-value of 0.203, where the axis ratio of [C II] is measured in a similar way to in this work (Ikeda et al. in prep.). Future JWST observations will unveil the rest-frame optical light distribution, which traces stellar mass distributions, and allow us to investigate the inclination dependence of fobs toward high-redshift galaxies (e.g., Cochrane et al. 2023).
4.2.4. Caveat
One caveat of our analysis is that we use the single template of FIR SEDs for all CRISTAL galaxies. Therefore, we do not take into account the variation of Tdust or βdust characterizing FIR SEDs. If the actual Tdust of the galaxies with low (high) fobs is larger (smaller) than that of the FIR SED used in this work (Tdust ∼ 40K, see Béthermin et al. 2020), the spread of fobs becomes smaller. A variation of Td ∼ 20 K changes IR luminosities by ΔLIR ∼ 0.25 dex and the obscured fractions by Δfobs ∼ 0.15. As we find a potential correlation between ΣIR and fobs, the galaxies with high (low) fobs would have higher (lower) Tdust or LIR than the current estimation if we assume that there is a positive correlation between ΣIR and Tdust, as has been demonstrated (e.g., Díaz-Santos et al. 2017; Dudzevičiūtė et al. 2020). In this case, the range of variation expands beyond the current estimation. We need high-frequency ALMA bands (Band-8/9/10) covering the frequencies corresponding to the peak of the dust continuum emission in order to derive the FIR SEDs of individual galaxies. While high-frequency band observations toward large galaxy samples are still challenging due to limitations such as sensitivities and atmospheric conditions, case studies of some representative galaxies will help us to obtain accurate FIR SEDs.
4.3. Star formation mode of z ∼ 5 LBGs
4.3.1. Extended dust-obscured star formation
As described in Section 3.4 and Figure 6, we find re, dust are comparable to or slightly larger than re, UV. Our size ratios are not consistent with the results from the TNG50 simulation, which suggests re, UV/re, dust ∼ 2–4 in the stellar mass range of the CRISTAL galaxies (Popping et al. 2022). As Popping et al. (2022) measure half-light radii of UV and dust continuum at almost the same observed wavelength as our observations (λobs = 1.6 μm and 850 μm for UV and dust continuum, respectively), the size ratios can be directly compared.
Before comparing observational results with the simulation, we need to address the possible observational biases coming from the limited S/N and spatial resolution. One possible reason for the extended dust continua is the source blending of nearby companions. To demonstrate how the companions affect the size measurement, we reran GALFIT on the HST images after matching the HST PSF to the ALMA beam size with PHOTUTILS/PSF and adding white noise to match the peak S/Ns of the UV continuum to dust continuum. As ALMA beam sizes can be changed by different weighting of visibilities, here we use the naturally weighted beam sizes of each visibility as the nominal target beam sizes of the PSF matching. Typically, the naturally weighted ALMA beam sizes (0.46″ = 2.9 kpc at z = 5) are larger than HST PSFs (0.20″ = 1.3 kpc at z = 5). We tested the procedure in three CRISTAL galaxies (CRISTAL-02, 06a, and 22ab), because (i) they have nearby companions in HST images and (ii) their dust continua are detected in S/N > 6.5. The results reveal that the measured sizes are consistent with those without PSF and S/N matching. Therefore, source blending is not sufficient to explain the extended dust continua in CRISTAL galaxies. Another possible reason for the extended continua is the limited S/N, although this is unlikely because re, dust are still only slightly larger than re, UV when we only take the sources with S/N > 6.5 into account.
In Figure 9, we show the stacked radial profile of the dust and UV continuum to obtain better S/N than the individual measurements. Here we used galaxies classified as single to avoid blending with companions. We followed the visibility-based method described in Section D.2 regarding the stacking of ALMA data. Regarding the stacked UV continuum image, we shifted the fitting center to the central coordinate of the image and matched the PSFs of each HST image to that of the stacked ALMA image; we then took an average. Again, the stacked radial profile shows that the spatial extent of the dust continuum is slightly greater than that of the UV continuum (by a factor of 1.5 in the beam-deconvolved size).
 |
Fig. 9. Normalized radial profiles of the stacked dust and UV continua (red and blue, respectively). The perpendicular lines are effective radii derived from the best-fit Sérsic profile in the corresponding colors. Here we used only “single” galaxy samples to avoid the blending of the companion. The matched PSF size is also shown with a black solid line. The inset shows the 2D distributions. |
Therefore, the spatially extended dust continuum does not originate from the observation but from the properties of the galaxy itself. The numerical simulation suggests that the primary factors in deciding the distribution of the dust thermal emission are dust mass and heating source (UV radiation; Cochrane et al. 2019). The spatial extent of the dust-obscured star-forming region (i.e., the spatial extent of LIR) can be more compact than that derived in the single-band observations in the following two cases. (i) Large dust opacity at the outskirts: if the dust opacity (AV) increases at the outskirts of galaxies, total IR luminosity decreases, and UV photons are strongly attenuated (see also, Li et al. in prep.). This situation makes the dust continuum emission appear more extended in the single-band measurement than the dust-obscured SF regions and also makes dust-unobscured SF regions appear more compact. The strong stellar feedback outward can transport metal or dust to the outside and realize the large opacity at the outskirts. Some observations reveal strong radiation outward (e.g., Wang et al. 2019). (ii) Negative gradient of Tdust: If the distribution of the heating source has a negative gradient, the dust temperature also decreases at the outskirts. This situation makes the actual dust-obscured SF region more compact than that measured in a single band. In our conversion from S158 μm to LIR, if the dust temperature has a negative gradient of ΔTdust ∼ 10 K from the center to the outskirts (e.g., Arata et al. 2019), the IR luminosity decreases by ∼0.3 dex, and the actual spatial extent of the dust-obscured SF region becomes comparable to that of the dust-unobscured region, as predicted in the SERRA simulation (e.g., Pallottini et al. 2022). Some numerical simulations suggest such a Tdust gradient highly affects the apparent dust continuum distribution (Cochrane et al. 2019).
If the spatial extent of the dust continuum in a single band is equal to the dust-obscured SF region, the FIR continuum traces global star formation activity, but UV continuums are only sensitive to massive star-forming clumps within the galaxies. Further investigation at higher frequencies will help to reveal the actual distribution of the dust-obscured SF regions.
4.3.2. Stellar mass–size relation
Several HST-based studies of galaxy morphology reveal that the size of the stellar distribution depends on both redshift and stellar mass (e.g., van der Wel et al. 2014; Shibuya et al. 2016). The stellar sizes become smaller with increasing redshift at fixed stellar mass and with decreasing stellar mass at fixed redshift. Fujimoto et al. (2017) find that dust continuum sizes also follow a similar evolutionary trend with redshift and stellar mass. Because the dust continuum traces recent star formation events and the stellar emission traces the history of the star formation in the galaxies, the size comparison of the dust continuum and stellar continuum at similar epochs brings a crucial perspective on the morphological transformation of galaxies.
In Figure 10, we plot the rest-frame 158 μm dust continuum sizes of the CRISTAL galaxies as a function of their stellar mass. We also show typical rest-frame optical sizes of late-type galaxies (LTGs) and early-type galaxies (ETGs; van der Wel et al. 2014) and rest-frame UV sizes (Shibuya et al. 2016) of Lyman-break galaxies (LBGs) as a function of stellar mass at z ∼ 5. We note that we extrapolated the redshift evolution of the parameter A and α in reff/kpc = A × (M*/5 × 1010 M⊙)α (van der Wel et al. 2014) to z ∼ 5 by fitting them as a function of redshift because the rest-frame wavelength of 5000 Å used to measure stellar sizes in van der Wel et al. (2014) is redshifted to the outside of the coverage of HST NIR filters. Therefore, we also show recent JWST studies of the rest-frame UV sizes of LBGs (Morishita et al. 2023, see also Ono et al. 2023), and of the rest-frame optical sizes of LTGs (Ward et al. 2023) and ETGs (Ito et al. 2023). The extrapolated van der Wel et al. (2014) relation might be slightly overestimated, but the difference does not impact our conclusion. Future direct comparison with the rest-frame optical sizes measured by JWST observations will allow us to capture the dust, UV, and stellar-size properties of the typical galaxies individually.
 |
Fig. 10. Stellar mass versus effective radius of the dust continuum for the CRISTAL galaxies (red filled markers). The average stellar mass and stacked size derived in Section D.2 is also shown by the magenta point. The dashed and solid lines show the scaling relations derived with HST and JWST. The orange and green colors represent the rest-frame optical sizes of ETGs (van der Wel et al. 2014; Ito et al. 2023), and the LTGs (van der Wel et al. 2014; Ward et al. 2023). The blue colors indicate rest-frame UV sizes of LBGs (Shibuya et al. 2016; Morishita et al. 2023). Recent results from the ALPINE survey are also shown in red open circles (Pozzi et al. 2024). The CRISTAL galaxies are distributed asound the scaling sequence of LTGs and LBGs, in contrast to the massive SMGs, which show consistent dust continuum sizes and stellar masses with those of ETGs (Riechers et al. 2014; De Breuck et al. 2014; Hodge et al. 2015; Gómez-Guijarro et al. 2018; Casey et al. 2019; Tadaki et al. 2020b). |
The dust continuum sizes and stellar masses of the more dusty galaxies follow the trend of ETGs (e.g., Gómez-Guijarro et al. 2022). These results imply that massive dusty galaxies are in a build-up phase of the central stellar cores (i.e., stellar bulge) of massive elliptical galaxies (e.g., Toft et al. 2014; Gómez-Guijarro et al. 2022) or evolve into compact quiescent galaxies (e.g., Toft et al. 2014; Ikarashi et al. 2015; Barro et al. 2016). This is consistent with the findings of studies that investigated the stellar and dust continuum sizes of individual galaxies at z ∼ 2–3 (Simpson et al. 2015; Gullberg et al. 2019; Lang et al. 2019; Tadaki et al. 2020a). In contrast, as shown in Figure 10, the dust continuum sizes of CRISTAL galaxies follow a similar trend to the mass–size relation of LTGs and LBGs. Average stellar mass (M* ∼ 109.8 M⊙) and effective radius (∼1.7 kpc) are also in excellent agreement with these scaling relations on the mass–size plane. Recent results from the ALPINE survey distribute at a similar regime in mass–size plane (Pozzi et al. 2024), even though they focus on a slightly higher mass regime. Our result suggests that typical star-forming galaxies with M* ∼ 1010 M⊙ might still be growing their disks via global star formation.
4.4. Morphological transformation and descendant
Recent wide-field surveys reveal typical dark matter halo masses of the bright LBGs (MUV ∼ −21 mag, M* ∼ 1010 M⊙ in stellar mass) at z = 4–6 of Mhalo ∼ 1012 M⊙ (e.g., Harikane et al. 2018). If we assume the median growth rate for their dark matter haloes from N-body simulations, dark matter haloes with masses of Mhalo ∼ 1012 M⊙ at z ∼ 5 evolve into haloes with Mhalo ∼ 1012.5 − 13.0 M⊙ at z ∼ 2, which host massive galaxies with masses of M* ∼ 1011 M⊙ at z ∼ 2. In the case where the bright LBGs at z = 4–6 continue to stay on the MS to z = 2, their stellar masses could grow to M* ≳ 1011 M⊙. From this estimation, the bright LBGs with M* ∼ 1010 M⊙ at z = 4–6 are likely to evolve into massive galaxies at z ∼ 2 with M* ∼ 1011 M⊙.
As the average structural evolution of SFGs is expected to follow the scaling relation on the mass–size plane, a bright LBG at z = 4–6 will grow its stellar disk by a factor of two after a ten-fold increase in stellar mass. The expected size of the stellar disks is consistent with that of massive DSFGs at z ∼ 2. This consistency also supports the idea that the bright LBGs at z = 4–6 are expanding their stellar disks through widespread star formation.
5. Summary and conclusions
In this study, we focused on the dust continuum emissions of z ∼ 5 normal star-forming galaxies as part of the ALMA cycle-8 large program, CRISTAL. The sample is taken from the previous ALMA large program, ALPINE, and is representative of typical star-forming galaxies at z = 4 − 6, as almost all of them lie within 0.3 dex of the MS in that redshift range. The stellar mass (M*) and SFR of the target galaxies are in the ranges of log10M* [M⊙]∼9.5 − 11.0 and ![$ \log_{10} \text{ SFR}\,[M_{\odot}\,\text{ yr}^{-1}]\sim1.0{-}2.7 $](/articles/aa/full_html/2024/10/aa48782-23/aa48782-23-eq65.gif) , respectively. Thanks to the deep and high-resolution ALMA data taken in the CRISTAL program, we were able to detect the dust continuum from 19 LBGs down to a stellar mass of log10M* [M⊙]∼9.5, including nine new detections. We successfully constrained the spatial extent of the dust continuum in UV-selected galaxies and compared them with other physical parameters statistically. Specifically, we examined the spatial extent of the dust-obscured and unobscured star formation, the obscured fraction of star formation as a function of stellar mass (fobs − M* relation), and the origin of the observed variation in fobs with stellar mass on fobs − M*. From individual measurements and stacking analysis,
, respectively. Thanks to the deep and high-resolution ALMA data taken in the CRISTAL program, we were able to detect the dust continuum from 19 LBGs down to a stellar mass of log10M* [M⊙]∼9.5, including nine new detections. We successfully constrained the spatial extent of the dust continuum in UV-selected galaxies and compared them with other physical parameters statistically. Specifically, we examined the spatial extent of the dust-obscured and unobscured star formation, the obscured fraction of star formation as a function of stellar mass (fobs − M* relation), and the origin of the observed variation in fobs with stellar mass on fobs − M*. From individual measurements and stacking analysis,
-
First, we conclude that the CRISTAL galaxies have ∼1 dex smaller IR luminosities (LIR) and are slightly more extended in dust continuum emission than DSFGs and SMGs. Consequently, the median IR surface densities ΣIR are approximately ten times smaller (Figure 5). This suggests that the representative galaxy population at z ∼ 4 − 6 undergoes moderate star formation with a lower ΣIR compared with the dusty galaxies, indicating intensive, centrally concentrated star formation.
-
We confirm that the obscured fraction shows a positive correlation with stellar mass (Figure 7, left). The average relationship we find is consistent with the previous results at z ∼ 5 − 9 and supports the idea that the obscured fraction for galaxies with M* < 1010 M⊙ does not show clear evolution from z = 0 to z = 2.5, but may decrease for galaxies with M* > 1010 M⊙. The possible evolution of galaxies with M* > 1010 M⊙ suggests an evolution of the dust content from z ∼ 5 to z ∼ 0–2.5.
-
We find a large variation in the fobs–M* relation across galaxies in the CRISTAL sample. Through deep observations in the CRISTAL survey, we traced the galaxies with an obscured fraction of as low as 20%, which is smaller than what has been reported in previous surveys. We find a weak correlation between the distance from the average M*–fobs relation (Δfobs) and potential merger identified by multiplicity, compactness of the dust-obscured star-forming regions, and the spatial offset between UV and dust continuum, but do not detect a correlation with the UV-dust size ratio or the viewing angle (Figure 8). Some mechanisms, such as interactions or rich gas accretions, may enhance the concentration of gas and dust, and accelerate the obscuration of star formation activity.
-
We also find that the effective radius of the dust continuum (re, dust) is comparable to or is about two times larger than that of the UV continuum (re, UV) in the individual comparison, whereas the dust emission originates from the dust heated by UV radiation from massive O/B type stars. These results are not consistent with the Illustris TNG50 simulation, which suggests that we should expect re, dust/re, UV ∼ 0.25–0.5 in the stellar mass range of the CRISTAL galaxies. By careful treatment and a stacking analysis, we confirm that the comparable sizes of the dust and UV continuum are not a result of observational uncertainties. The spatial extent of the dust-obscured star-forming regions is comparable to that of the dust-unobscured regions under the conditions of (i) large dust opacity at the outskirts or (ii) negative gradient of Tdust. Supposing that the spatial extent of a single-band dust continuum is comparable to the dust-obscured SF region, the FIR continuum traces global star formation activity but UV continuums are only sensitive to massive star-forming clumps within the galaxies.
-
The CRISTAL galaxies follow a similar trend to LTGs and LBGs in the stellar mass–size plane (Figure 10). They are distributed in a different regime compared with more dusty galaxies, which follow the same trend as the ETGs. Our results suggest that the disks of typical star-forming galaxies with M* ∼ 1010 M⊙ are in a growing-up phase through global star formation.
-
An expansion of the disks in z ∼ 5 normal SFGs along with the star-forming sequence in the mass–size plane are completely consistent with the large stellar disks of massive galaxies at z ∼ 2. An expansion of the stellar disks from z ∼ 5 to z ∼ 2 and the subsequent compaction events naturally explain morphological transformation and are consistent with previous studies examining massive galaxies at z ∼ 2.
Our results emphasize the importance of considering the spatial extent of both the dust-obscured and unobscured star formation activities when studying the morphological transformation of galaxies, especially given the fact that more than ∼50% of the star formation activity is obscured by dust at the stellar mass range of M* > 1010 M⊙. As the spatial extent of the dust-obscured star formation is almost comparable with that of the dust-unobscured region, normal star-forming galaxies at z ∼ 5 are not becoming compact in size, but are rather expanding their stellar disks. Future ALMA and JWST observations will provide a more robust measurement of the spatial extent of dust-obscured star-forming regions or other components, such as pre-existing stellar disks or ionized gas, and will enable us to explore inner structures of the typical star-forming galaxies at z ∼ 5. Also, ALMA has the capability to make more high-frequency observations, for example in bands 8, 9, and 10, which would enable constraint of the FIR SED of each galaxy and bring us to a clearer picture of the obscured star formation.
We find there are spatial offsets between the detected position in the COSMOS2015 catalog and the latest COSMOS catalog (Weaver et al. 2022). For our target galaxies, the COSMOS2015 catalog shows better source extractions (see Appendix A).
Acknowledgments
We thank the anonymous referee for constructive comments and suggestions. This paper makes use of the following ALMA data: ADS/JAO.ALMA#2017.1.00428.S, #2018.1.01359.S, #2018.1.01605.S, #2019.1.01075.S, #2019.1.00226.S, and #2021.1.00280.L. ALMA is a partnership of ESO (representing its member states), NSF (USA), and NINS (Japan), together with NRC (Canada), MOST and ASIAA (Taiwan), and KASI (Republic of Korea), in cooperation with the Republic of Chile. The Joint ALMA Observatory is operated by ESO, AUI/NRAO, and NAOJ. This work was supported by JSPS KAKENHI grant No. 23K03466. I.M. is financially supported by Grants-in-Aid for Japan Society for the Promotion of Science (JSPS) Fellows (KAKENHI Number 22KJ0821). K.T. is supported by Grants-in-Aid for Japan Society for the Promotion of Science (JSPS) Fellows (KAKENHI Number 23K03466). R.I. is supported by Grants-in-Aid for Japan Society for the Promotion of Science (JSPS) Fellows (KAKENHI Grant Number 23KJ1006). R.H.-C. thanks to the Max Planck Society for support under the Partner Group project “The Baryon Cycle in Galaxies” between the Max Planck for Extraterrestrial Physics and the Universidad de Concepción. R.H-C. also gratefully acknowledges financial support from Millenium Nucleus NCN19058 (TITANs), and ANID BASAL projects ACE210002 and FB210003. M.A. acknowledges support from FONDECYT grant 1211951. M.A. and R.J.A. acknowledge support from ANID BASAL project grant FB210003. R.J.A. was supported by FONDECYT grant number 1231718. R.B. acknowledges support from an STFC Ernest Rutherford Fellowship [grant number ST/T003596/1]. R.D. is supported by the Australian Research Council Centre of Excellence for All Sky Astrophysics in 3 Dimensions (ASTRO 3D), through project number CE170100013. E.d.C. gratefully acknowledges funding from the Australian Research Council (projects DP240100589 and CE170100013). A.F. acknowledges support from the ERC Advanced Grant INTERSTELLAR H2020/740120. T.N. acknowledges support from the Deutsche Forschungsgemeinschaft (DFG, German Research Foundation) under Germany’s Excellence Strategy – EXC-2094 – 390783311 from the DFG Cluster of Excellence “ORIGINS”. M.R. acknowledges support from project PID2020-114414GB-100, financed by MCIN/AEI/10.13039/501100011033. H.Ü. gratefully acknowledges support by the Isaac Newton Trust and by the Kavli Foundation through a Newton-Kavli Junior Fellowship. Data analysis was in part carried out on the Multi-wavelength Data Analysis System operated by the Astronomy Data Center (ADC), National Astronomical Observatory of Japan.
References
- Algera, H. S. B., Inami, H., Oesch, P. A., et al. 2023, MNRAS, 518, 6142 [Google Scholar]
- Arata, S., Yajima, H., Nagamine, K., Li, Y., & Khochfar, S. 2019, MNRAS, 488, 2629 [NASA ADS] [CrossRef] [Google Scholar]
- Bakx, T. J. L. C., Sommovigo, L., Carniani, S., et al. 2021, MNRAS, 508, L58 [NASA ADS] [CrossRef] [Google Scholar]
- Barnes, J. E., & Hernquist, L. 1996, ApJ, 471, 115 [NASA ADS] [CrossRef] [Google Scholar]
- Barro, G., Kriek, M., Pérez-González, P. G., et al. 2016, ApJ, 827, L32 [NASA ADS] [CrossRef] [Google Scholar]
- Behrens, C., Pallottini, A., Ferrara, A., Gallerani, S., & Vallini, L. 2018, MNRAS, 477, 552 [NASA ADS] [CrossRef] [Google Scholar]
- Béthermin, M., Daddi, E., Magdis, G., et al. 2015, A&A, 573, A113 [Google Scholar]
- Béthermin, M., Wu, H.-Y., Lagache, G., et al. 2017, A&A, 607, A89 [Google Scholar]
- Béthermin, M., Fudamoto, Y., Ginolfi, M., et al. 2020, A&A, 643, A2 [Google Scholar]
- Béthermin, M., Accard, C., Guillaume, C., et al. 2023, A&A, 680, L8 [NASA ADS] [CrossRef] [EDP Sciences] [Google Scholar]
- Blain, A. W., Smail, I., Ivison, R. J., Kneib, J. P., & Frayer, D. T. 2002, Phys. Rep., 369, 111 [Google Scholar]
- Boquien, M., Burgarella, D., Roehlly, Y., et al. 2019, A&A, 622, A103 [NASA ADS] [CrossRef] [EDP Sciences] [Google Scholar]
- Bouwens, R. J., Illingworth, G. D., Blakeslee, J. P., Broadhurst, T. J., & Franx, M. 2004a, ApJ, 611, L1 [Google Scholar]
- Bouwens, R. J., Thompson, R. I., Illingworth, G. D., et al. 2004b, ApJ, 616, L79 [NASA ADS] [CrossRef] [Google Scholar]
- Bouwens, R. J., Illingworth, G. D., Franx, M., & Ford, H. 2007, ApJ, 670, 928 [Google Scholar]
- Bouwens, R. J., Illingworth, G. D., Oesch, P. A., et al. 2012, ApJ, 754, 83 [Google Scholar]
- Bouwens, R. J., Aravena, M., Decarli, R., et al. 2016, ApJ, 833, 72 [NASA ADS] [CrossRef] [Google Scholar]
- Bouwens, R., González-López, J., Aravena, M., et al. 2020, ApJ, 902, 112 [NASA ADS] [CrossRef] [Google Scholar]
- Bouwens, R. J., Smit, R., Schouws, S., et al. 2022, ApJ, 931, 160 [NASA ADS] [CrossRef] [Google Scholar]
- Bowler, R. A. A., Bourne, N., Dunlop, J. S., McLure, R. J., & McLeod, D. J. 2018, MNRAS, 481, 1631 [Google Scholar]
- Bowler, R. A. A., Cullen, F., McLure, R. J., Dunlop, J. S., & Avison, A. 2022, MNRAS, 510, 5088 [NASA ADS] [CrossRef] [Google Scholar]
- Bowler, R. A. A., Inami, H., Sommovigo, L., et al. 2023, ArXiv e-prints [arXiv:2309.17386] [Google Scholar]
- Bruzual, G., & Charlot, S. 2003, MNRAS, 344, 1000 [NASA ADS] [CrossRef] [Google Scholar]
- Calzetti, D., Armus, L., Bohlin, R. C., et al. 2000, ApJ, 533, 682 [NASA ADS] [CrossRef] [Google Scholar]
- Capak, P. L., Carilli, C., Jones, G., et al. 2015, Nature, 522, 455 [NASA ADS] [CrossRef] [Google Scholar]
- Casey, C. M., Narayanan, D., & Cooray, A. 2014, Phys. Rep., 541, 45 [Google Scholar]
- Casey, C. M., Zavala, J. A., Aravena, M., et al. 2019, ApJ, 887, 55 [Google Scholar]
- Casey, C. M., Zavala, J. A., Manning, S. M., et al. 2021, ApJ, 923, 215 [NASA ADS] [CrossRef] [Google Scholar]
- Casey, C. M., Kartaltepe, J. S., Drakos, N. E., et al. 2022, ArXiv e-prints [arXiv:2211.07865] [Google Scholar]
- Chabrier, G. 2003, PASP, 115, 763 [Google Scholar]
- Chen, C.-C., Smail, I., Swinbank, A. M., et al. 2015, ApJ, 799, 194 [NASA ADS] [CrossRef] [Google Scholar]
- Cochrane, R. K., Hayward, C. C., Anglés-Alcázar, D., et al. 2019, MNRAS, 488, 1779 [NASA ADS] [CrossRef] [Google Scholar]
- Cochrane, R. K., Anglés-Alcázar, D., Cullen, F., & Hayward, C. C. 2023, ArXiv e-prints [arXiv:2310.08829] [Google Scholar]
- Cullen, F., McLure, R. J., Khochfar, S., Dunlop, J. S., & Dalla Vecchia, C. 2017, MNRAS, 470, 3006 [NASA ADS] [CrossRef] [Google Scholar]
- Czekala, I., Loomis, R. A., Teague, R., et al. 2021, ApJS, 257, 2 [NASA ADS] [CrossRef] [Google Scholar]
- da Cunha, E., Walter, F., Smail, I. R., et al. 2015, ApJ, 806, 110 [Google Scholar]
- Daddi, E., Cimatti, A., Renzini, A., et al. 2004, ApJ, 617, 746 [NASA ADS] [CrossRef] [Google Scholar]
- Daddi, E., Renzini, A., Pirzkal, N., et al. 2005, ApJ, 626, 680 [NASA ADS] [CrossRef] [Google Scholar]
- Dale, D. A., & Helou, G. 2002, ApJ, 576, 159 [Google Scholar]
- De Breuck, C., Williams, R. J., Swinbank, M., et al. 2014, A&A, 565, A59 [NASA ADS] [CrossRef] [EDP Sciences] [Google Scholar]
- Dekel, A., Sari, R., & Ceverino, D. 2009, ApJ, 703, 785 [Google Scholar]
- Dessauges-Zavadsky, M., Ginolfi, M., Pozzi, F., et al. 2020, A&A, 643, A5 [NASA ADS] [CrossRef] [EDP Sciences] [Google Scholar]
- Devereaux, T., Cassata, P., Ibar, E., et al. 2024, A&A, 686, A156 [NASA ADS] [CrossRef] [EDP Sciences] [Google Scholar]
- Díaz-Santos, T., Armus, L., Charmandaris, V., et al. 2017, ApJ, 846, 32 [Google Scholar]
- Draine, B. T., & Li, A. 2007, ApJ, 657, 810 [CrossRef] [Google Scholar]
- Dudzevičiūtė, U., Smail, I., Swinbank, A. M., et al. 2020, MNRAS, 494, 3828 [Google Scholar]
- Dunlop, J. S., McLure, R. J., Biggs, A. D., et al. 2017, MNRAS, 466, 861 [Google Scholar]
- Dunlop, J. S., Abraham, R. G., Ashby, M. L. N., et al. 2021, PRIMER: Public Release IMaging for Extragalactic Research, JWST Proposal. Cycle 1, ID. #1837 [Google Scholar]
- Faisst, A. L., Capak, P. L., Yan, L., et al. 2017, ApJ, 847, 21 [Google Scholar]
- Faisst, A. L., Fudamoto, Y., Oesch, P. A., et al. 2020a, MNRAS, 498, 4192 [NASA ADS] [CrossRef] [Google Scholar]
- Faisst, A. L., Schaerer, D., Lemaux, B. C., et al. 2020b, ApJS, 247, 61 [NASA ADS] [CrossRef] [Google Scholar]
- Ferguson, H. C., Dickinson, M., Giavalisco, M., et al. 2004, ApJ, 600, L107 [NASA ADS] [CrossRef] [Google Scholar]
- Ferland, G. J., Korista, K. T., Verner, D. A., et al. 1998, PASP, 110, 761 [Google Scholar]
- Ferrara, A., Hirashita, H., Ouchi, M., & Fujimoto, S. 2017, MNRAS, 471, 5018 [NASA ADS] [CrossRef] [Google Scholar]
- Ferrara, A., Sommovigo, L., Dayal, P., et al. 2022, MNRAS, 512, 58 [NASA ADS] [CrossRef] [Google Scholar]
- Franco, M., Elbaz, D., Béthermin, M., et al. 2018, A&A, 620, A152 [NASA ADS] [CrossRef] [EDP Sciences] [Google Scholar]
- Fudamoto, Y., Oesch, P. A., Faisst, A., et al. 2020a, A&A, 643, A4 [NASA ADS] [CrossRef] [EDP Sciences] [Google Scholar]
- Fudamoto, Y., Oesch, P. A., Magnelli, B., et al. 2020b, MNRAS, 491, 4724 [Google Scholar]
- Fudamoto, Y., Oesch, P. A., Schouws, S., et al. 2021, Nature, 597, 489 [CrossRef] [Google Scholar]
- Fujimoto, S., Ouchi, M., Shibuya, T., & Nagai, H. 2017, ApJ, 850, 83 [Google Scholar]
- Fujimoto, S., Silverman, J. D., Bethermin, M., et al. 2020, ApJ, 900, 1 [Google Scholar]
- Fujimoto, S., Kohno, K., Ouchi, M., et al. 2023, ArXiv e-prints [arXiv:2303.01658] [Google Scholar]
- Ginolfi, M., Jones, G. C., Béthermin, M., et al. 2020a, A&A, 643, A7 [NASA ADS] [CrossRef] [EDP Sciences] [Google Scholar]
- Ginolfi, M., Jones, G. C., Béthermin, M., et al. 2020b, A&A, 633, A90 [NASA ADS] [CrossRef] [EDP Sciences] [Google Scholar]
- Gómez-Guijarro, C., Toft, S., Karim, A., et al. 2018, ApJ, 856, 121 [Google Scholar]
- Gómez-Guijarro, C., Elbaz, D., Xiao, M., et al. 2022, A&A, 658, A43 [NASA ADS] [CrossRef] [EDP Sciences] [Google Scholar]
- Gruppioni, C., Béthermin, M., Loiacono, F., et al. 2020, A&A, 643, A8 [NASA ADS] [CrossRef] [EDP Sciences] [Google Scholar]
- Gullberg, B., Smail, I., Swinbank, A. M., et al. 2019, MNRAS, 490, 4956 [Google Scholar]
- Harikane, Y., Ouchi, M., Ono, Y., et al. 2018, PASJ, 70, S11 [NASA ADS] [CrossRef] [Google Scholar]
- Hathi, N. P., Jansen, R. A., Windhorst, R. A., et al. 2008, AJ, 135, 156 [NASA ADS] [CrossRef] [Google Scholar]
- Herrera-Camus, R., Förster Schreiber, N., Genzel, R., et al. 2021, A&A, 649, A31 [NASA ADS] [CrossRef] [EDP Sciences] [Google Scholar]
- Hodge, J. A., Riechers, D., Decarli, R., et al. 2015, ApJ, 798, L18 [Google Scholar]
- Hodge, J. A., Swinbank, A. M., Simpson, J. M., et al. 2016, ApJ, 833, 103 [Google Scholar]
- Howell, J. H., Armus, L., Mazzarella, J. M., et al. 2010, ApJ, 715, 572 [Google Scholar]
- Hygate, A. P. S., Hodge, J. A., da Cunha, E., et al. 2023, MNRAS, 524, 1775 [NASA ADS] [CrossRef] [Google Scholar]
- Ikarashi, S., Ivison, R. J., Caputi, K. I., et al. 2015, ApJ, 810, 133 [Google Scholar]
- Ikeda, R., Tadaki, K.-I., Iono, D., et al. 2022, ApJ, 933, 11 [NASA ADS] [CrossRef] [Google Scholar]
- Inami, H., Algera, H. S. B., Schouws, S., et al. 2022, MNRAS, 515, 3126 [NASA ADS] [CrossRef] [Google Scholar]
- Ito, K., Valentino, F., Brammer, G., et al. 2023, ArXiv e-prints [arXiv:2307.06994] [Google Scholar]
- Jonsson, P., Groves, B. A., & Cox, T. J. 2010, MNRAS, 403, 17 [NASA ADS] [CrossRef] [Google Scholar]
- Kennicutt, Robert C. J., 1998, ARA&A, 36, 189 [NASA ADS] [CrossRef] [Google Scholar]
- Kennicutt, R. C., & Evans, N. J. 2012, ARA&A, 50, 531 [NASA ADS] [CrossRef] [Google Scholar]
- Laigle, C., McCracken, H. J., Ilbert, O., et al. 2016, ApJS, 224, 24 [Google Scholar]
- Lang, P., Schinnerer, E., Smail, I., et al. 2019, ApJ, 879, 54 [Google Scholar]
- Laporte, N., Ellis, R. S., Boone, F., et al. 2017, ApJ, 837, L21 [CrossRef] [Google Scholar]
- Laporte, N., Zitrin, A., Ellis, R. S., et al. 2021, MNRAS, 505, 4838 [Google Scholar]
- Le Fèvre, O., Béthermin, M., Faisst, A., et al. 2020, A&A, 643, A1 [Google Scholar]
- Leslie, S. K., Schinnerer, E., Groves, B., et al. 2018, A&A, 616, A157 [NASA ADS] [CrossRef] [EDP Sciences] [Google Scholar]
- Liang, L., Feldmann, R., Hayward, C. C., et al. 2021, MNRAS, 502, 3210 [NASA ADS] [CrossRef] [Google Scholar]
- Lilly, S., Schade, D., Ellis, R., et al. 1998, ApJ, 500, 75 [NASA ADS] [CrossRef] [Google Scholar]
- Madau, P., & Dickinson, M. 2014, ARA&A, 52, 415 [Google Scholar]
- Magdis, G. E., Daddi, E., Béthermin, M., et al. 2012, ApJ, 760, 6 [NASA ADS] [CrossRef] [Google Scholar]
- Magnelli, B., Elbaz, D., Chary, R. R., et al. 2009, A&A, 496, 57 [NASA ADS] [CrossRef] [EDP Sciences] [Google Scholar]
- Magnelli, B., Elbaz, D., Chary, R. R., et al. 2011, A&A, 528, A35 [NASA ADS] [CrossRef] [EDP Sciences] [Google Scholar]
- Maiolino, R., Carniani, S., Fontana, A., et al. 2015, MNRAS, 452, 54 [NASA ADS] [CrossRef] [Google Scholar]
- Martí-Vidal, I., Vlemmings, W. H. T., Muller, S., & Casey, S. 2014, A&A, 563, A136 [Google Scholar]
- McLure, R. J., Dunlop, J. S., Cullen, F., et al. 2018, MNRAS, 476, 3991 [Google Scholar]
- Merlin, E., Castellano, M., Santini, P., et al. 2021, A&A, 649, A22 [NASA ADS] [CrossRef] [EDP Sciences] [Google Scholar]
- Morishita, T., Stiavelli, M., Chary, R. R., et al. 2023, ArXiv e-prints [arXiv:2308.05018] [Google Scholar]
- Moutard, T., Sawicki, M., Arnouts, S., et al. 2020, MNRAS, 494, 1894 [NASA ADS] [CrossRef] [Google Scholar]
- Nelson, E. J., Tadaki, K.-I., Tacconi, L. J., et al. 2019, ApJ, 870, 130 [NASA ADS] [CrossRef] [Google Scholar]
- Oesch, P. A., Bouwens, R. J., Carollo, C. M., et al. 2010, ApJ, 709, L21 [NASA ADS] [CrossRef] [Google Scholar]
- Ono, Y., Harikane, Y., Ouchi, M., et al. 2023, ArXiv e-prints [arXiv:2309.02790] [Google Scholar]
- Pallottini, A., Ferrara, A., Gallerani, S., et al. 2022, MNRAS, 513, 5621 [NASA ADS] [Google Scholar]
- Pannella, M., Carilli, C. L., Daddi, E., et al. 2009, ApJ, 698, L116 [Google Scholar]
- Pannella, M., Elbaz, D., Daddi, E., et al. 2015, ApJ, 807, 141 [Google Scholar]
- Peng, C. Y., Ho, L. C., Impey, C. D., & Rix, H.-W. 2002, AJ, 124, 266 [Google Scholar]
- Popping, G., Puglisi, A., & Norman, C. A. 2017a, MNRAS, 472, 2315 [Google Scholar]
- Popping, G., Somerville, R. S., & Galametz, M. 2017b, MNRAS, 471, 3152 [NASA ADS] [CrossRef] [Google Scholar]
- Popping, G., Pillepich, A., Calistro Rivera, G., et al. 2022, MNRAS, 510, 3321 [CrossRef] [Google Scholar]
- Posses, A., Aravena, M., González-López, J., et al. 2024, A&A, submiited[arXiv:2403.03379] [Google Scholar]
- Pozzi, F., Calura, F., D’Amato, Q., et al. 2024, A&A, 686, A187 [NASA ADS] [CrossRef] [EDP Sciences] [Google Scholar]
- Reddy, N. A., Oesch, P. A., Bouwens, R. J., et al. 2018, ApJ, 853, 56 [NASA ADS] [CrossRef] [Google Scholar]
- Riechers, D. A., Carilli, C. L., Capak, P. L., et al. 2014, ApJ, 796, 84 [Google Scholar]
- Rowan-Robinson, M., Oliver, S., Wang, L., et al. 2016, MNRAS, 461, 1100 [Google Scholar]
- Safarzadeh, M., Hayward, C. C., & Ferguson, H. C. 2017, ApJ, 840, 15 [NASA ADS] [CrossRef] [Google Scholar]
- Schouws, S., Stefanon, M., Bouwens, R., et al. 2022, ApJ, 928, 31 [NASA ADS] [CrossRef] [Google Scholar]
- Schreiber, C., Elbaz, D., Pannella, M., et al. 2018, A&A, 609, A30 [NASA ADS] [CrossRef] [EDP Sciences] [Google Scholar]
- Scoville, N., Lee, N., Vanden Bout, P., et al. 2017, ApJ, 837, 150 [Google Scholar]
- Sérsic, J. L. 1963, Boletin de la Asociacion Argentina de Astronomia La Plata Argentina, 6, 41 [Google Scholar]
- Shen, S., Mo, H. J., White, S. D. M., et al. 2003, MNRAS, 343, 978 [NASA ADS] [CrossRef] [Google Scholar]
- Shibuya, T., Ouchi, M., Kubo, M., & Harikane, Y. 2016, ApJ, 821, 72 [NASA ADS] [CrossRef] [Google Scholar]
- Simpson, J. M., Smail, I., Swinbank, A. M., et al. 2015, ApJ, 799, 81 [CrossRef] [Google Scholar]
- Skelton, R. E., Whitaker, K. E., Momcheva, I. G., et al. 2014, ApJS, 214, 24 [Google Scholar]
- Smail, I., Dudzevičiūtė, U., Stach, S. M., et al. 2021, MNRAS, 502, 3426 [NASA ADS] [CrossRef] [Google Scholar]
- Solimano, M., González-López, J., Aravena, M., et al. 2024, A&A, 689, A145 [NASA ADS] [CrossRef] [EDP Sciences] [Google Scholar]
- Sommovigo, L., Ferrara, A., Carniani, S., et al. 2021, MNRAS, 503, 4878 [NASA ADS] [CrossRef] [Google Scholar]
- Sommovigo, L., Ferrara, A., Carniani, S., et al. 2022a, MNRAS, 517, 5930 [NASA ADS] [CrossRef] [Google Scholar]
- Sommovigo, L., Ferrara, A., Pallottini, A., et al. 2022b, MNRAS, 513, 3122 [NASA ADS] [CrossRef] [Google Scholar]
- Speagle, J. S., Steinhardt, C. L., Capak, P. L., & Silverman, J. D. 2014, ApJS, 214, 15 [Google Scholar]
- Spilker, J. S., Marrone, D. P., Aravena, M., et al. 2016, ApJ, 826, 112 [NASA ADS] [CrossRef] [Google Scholar]
- Steidel, C. C., Adelberger, K. L., Giavalisco, M., Dickinson, M., & Pettini, M. 1999, ApJ, 519, 1 [NASA ADS] [CrossRef] [Google Scholar]
- Tacconi, L. J., Neri, R., Genzel, R., et al. 2013, ApJ, 768, 74 [NASA ADS] [CrossRef] [Google Scholar]
- Tadaki, K.-I., Belli, S., Burkert, A., et al. 2020a, ApJ, 901, 74 [NASA ADS] [CrossRef] [Google Scholar]
- Tadaki, K.-I., Iono, D., Yun, M. S., et al. 2020b, ApJ, 889, 141 [Google Scholar]
- Toft, S., van Dokkum, P., Franx, M., et al. 2007, ApJ, 671, 285 [CrossRef] [Google Scholar]
- Toft, S., Smolčić, V., Magnelli, B., et al. 2014, ApJ, 782, 68 [Google Scholar]
- Trujillo, I., Förster Schreiber, N. M., Rudnick, G., et al. 2006, ApJ, 650, 18 [Google Scholar]
- Vallini, L., Gallerani, S., Ferrara, A., Pallottini, A., & Yue, B. 2015, ApJ, 813, 36 [NASA ADS] [CrossRef] [Google Scholar]
- van der Wel, A., Franx, M., van Dokkum, P. G., et al. 2014, ApJ, 788, 28 [Google Scholar]
- Wang, W., Kassin, S. A., Pacifici, C., et al. 2018, ApJ, 869, 161 [NASA ADS] [CrossRef] [Google Scholar]
- Wang, X., Jones, T. A., Treu, T., et al. 2019, ApJ, 882, 94 [Google Scholar]
- Ward, E. M., de la Vega, A., Mobasher, B., et al. 2023, ArXiv e-prints [arXiv:2311.02162] [Google Scholar]
- Watson, D., Christensen, L., Knudsen, K. K., et al. 2015, Nature, 519, 327 [Google Scholar]
- Weaver, J. R., Kauffmann, O. B., Ilbert, O., et al. 2022, ApJS, 258, 11 [NASA ADS] [CrossRef] [Google Scholar]
- Whitaker, K. E., Pope, A., Cybulski, R., et al. 2017, ApJ, 850, 208 [NASA ADS] [CrossRef] [Google Scholar]
- Witt, A. N., & Gordon, K. D. 2000, ApJ, 528, 799 [Google Scholar]
- Wuyts, S., Labbé, I., Förster Schreiber, N. M., et al. 2008, ApJ, 682, 985 [NASA ADS] [CrossRef] [Google Scholar]
- Yajima, H., Choi, J.-H., & Nagamine, K. 2011, MNRAS, 412, 411 [NASA ADS] [CrossRef] [Google Scholar]
- Yamaguchi, Y., Kohno, K., Hatsukade, B., et al. 2019, ApJ, 878, 73 [Google Scholar]
- Zavala, J. A., Casey, C. M., Manning, S. M., et al. 2021, ApJ, 909, 165 [CrossRef] [Google Scholar]
Appendix A: Thumbneil of the CRISTAL-04 field
Figure A.1 shows a thumbnail of the CRISTAL-04 field. The CRISTAL-04 counterpart in the COSMOS2015 and COSMOS2020 catalogs shows a spatial offset while other sources included in the field do not. We decided to utilize the COSMOS2015 catalog since it shows better source extraction (∼3 times closer than the HST/ALMA counterpart) for CRISTAL-04 (see Section 2.2).
 |
Fig. A.1. Thumneil of the CRISTAL-04 field. Background and white contours indicate the UV and dust continuum from HST and ALMA, respectively. The extracted sources in the COSMOS2015 and COSMOS2020 catalogs are shown in blue squares and red diamonds. For CRISTAL-04, the COSMOS2015 catalog shows better source extraction. |
Appendix B: CIGALE parameters used to estimate global properties
We use all available broad- (BBs) and medium bands (MBs) in optical to near-infrared (NIR) for the SED fitting. In the COSMOS2015 catalog, we use 10 broad bands (u*, B, V, r+, i+, z++, Y, J, H, Ks) and 12 medium bands on Ground-based telescopes, and 4 Spitzer bands that achieve the best sensitivities among the bands covering similar wavelength. We take 4 broad bands (U, B, R, Ks) and 23 medium bands on Ground-based telescopes, and 10 HST and 4 Spitzer bands on space telescopes from the ASTRODEEP catalog. We extract the total fluxes of the counterparts of the CRISTAL galaxies from the corresponding catalogs. Table B.1 shows parameters used in SED fitting to derive stellar masses and SFRs (see Section 2.2).
Parameters for SED fitting
Appendix C: comparison of SFRSED and SFRUV + SFRIR
In Figure C.1, we compare SFRUV + SFRIR and SFRSED. SFRUV + SFRIR is calculated by summing up SFRUV from best-fit SED and SFRIR from the rest-frame 158 μm dust continuum flux and SFRSED is computed by averaging the SFH over 100 Myr. SFRSED is broadly consistent with SFRUV + SFRIR. CRISTAL-24 show ∼1.4 dex smaller SFRSED than SFRUV + SFRIR. This difference is due to the degeneracy of the dust extinction and stellar age and makes CRISTAL-24 distribute ∼1.2 dex lower than the main-sequence.
 |
Fig. C.1. SFRUV + SFRIR vs SFRSED. The black dashed line represents a one-to-one relationship. SFRSED is broadly consistent with SFRUV + SFRIR, except for CRISTAL-24. |
Appendix D: Validation of the dust size measurement
As shown in Table 1, about half of the CRISTAL galaxies range 4.4 < S/N < 5.5 in the dust continuum images. These S/Ns might translate to significant uncertainties in our flux measurements but also to systematical errors in the sizes. To evaluate uncertainties of the size measurement through visibility fitting and confirm the validity of the size measurement, we conducted a Monte Carlo simulation and a stacking analysis toward fainter CRISTAL galaxies.
D.1. Monte-Carlo simulation
Because the measured sizes might be affected by noise fluctuations, we need to know the dependence of the size measurement uncertainties on the source S/N.
In the following Monte-Carlo simulation, we use the visibilities of six galaxies (CRISTAL-01b, 07ab, 09, 10, 11a, and 19) that have relatively low S/Ns among the CRISTAL sample (4.4 ≤ S/N ≤ 5.5). This selection was made because galaxies with smaller S/N are anticipated to be more affected by noise fluctuations in size measurements. We take different array configurations used in each CRISTAL galaxy into account as the visibilities of the six galaxies encompass various representative uv coverages among those obtained in our observations. We create ∼1500 (∼300 in each field) artificial circular Gaussian sources with a log uniform distribution of total flux within a range of 0.025–1.25 mJy and effective radius ranging 0.025–1.5″. After subtracting observed galaxies with the CASA task TCLEAN, we injected the generated mock sources in the visibilities at a random position and calculated source S/N in the same manner as referred to in Sec 3.1. When the mock source is detected at 4.4 < S/N (lowest S/N among observed galaxies in dust continuum), we fit a circular Gaussian model by setting an initial estimation of the central position to the artificial source center using UVMULTIFIT.
In Figure D.1, we plot the result of the Monte-Carlo simulation, with an average and standard deviation of the ratio between input and output values. As shown in Figure D.1, independent of the S/N of the source, we do not find any systematic offsets between intrinsic sizes and resulting measured sizes (sizeinp/sizefit ∼ 0). This result demonstrates the estimated sizes of these galaxies are on average reliable. However, careful treatment of individual sizes of the sources with 4.4 ≤ S/N ≤ 5.5 is needed as the output sizes of these sources show large scatters from input sizes ( ) especially in the case that output sizes are less than 0.4″ (
 ). To obtain a better estimation of the size of these low-S/N sources, we additionally carry out a stacking analysis in the following section.
 |
Fig. D.1. Comparison of the flux density and FWHM between fitting results and input models. The left, middle, and right panels show the results for sources detected at S/N = 4.4–5.5, S/N = 6.5–7.8 and S/N ≥ 12.3, respectively. Different colors indicate different visibilities used in the simulation, corresponding to the different array configurations. White circles and error bars show 50 ± 34% percentiles in the bins of output values. Black solid and dashed lines correspond to the averages and standard deviations of the fitting results and output models, which are also shown in the bottom right of each panel. |
D.2. Stacked size
We now perform stacking analysis to check whether there are systematic biases in our size estimates. If galaxies included in stacking are intrinsically compact (extended) but appear as extended (compact) due to noise effects, stacked sizes are expected to become smaller (larger) than a weighted average of the individual sizes. We perform the stacking analysis, especially for six of eight CRISTAL galaxies with 4.4 ≤ S/N ≤ 5.5 (CRISTAL-01b, 07ab, 09, 10, 11a, and 19), to evaluate the potential size misestimations. We did not use the other two galaxies (CRISTAL-03 and 21) because CRISTAL-03 is not resolved and CRISTAL-21 has extremely extended sizes therefore they may affect stacked sizes strongly.
We align phase centers to the measured central position and set the phase center to a common coordinate of α = 00h 00m 00s; δ = 00d 00m 00s (J2000) with CASA task FIXPLANET. We concatenate all visibilities into a single measurement set with the CONCAT task. Finally, we measured the sizes with UVMULTIFIT.
The estimated average size is 0.209 ± 0.061″, which is consistent with the average of the individually measured sizes (0.237″) within 1σ uncertainty. Therefore we conclude that the individual measurements of the six CRISTAL galaxies listed above are reliable. While the stacked measurements do not significantly affect the conclusion, we also plot the stacked size in Figure 10.
Appendix E: Sérsic index-dependence of the UV sizes
In Figure E.1, we compare the derived UV sizes under the assumption of Sérsic index n = 1 and n = free. Overall, there is no systematic difference between the two sizes. CRISTAL-25 shows a larger size in the case of n = free because the best-fit Sérsic index is larger than unity (n = 7.3 ± 1.7). We note that this size difference of CRISTAL-25 does not affect the conclusion.
Appendix F: Astrometry of the ALMA and HST images
In Figure F.1, we show coordinate offsets between sources detected in the HST images covering the CRISTAL galaxies and sources in the Gaia DR1 catalog. The number of counterparts is small due to the limited HST coverage. We do not find any clear systematic spatial offsets in the HST image because the median value is very close to the origin. Also, ALMA shows very accurate astrometry with the typical positional offset of ∼50 mas in our dataset. Therefore, we suggest that the spatial offsets between UV and dust continuum seen in Section 4.2.1 are not artificial, but physical.
Appendix G: Fitting results of ALMA and HST
Figure G.1 shows the results of the dust continuum size measurements in the visibility domain. The left and middle panels show the observed and residual images respectively. The observed and model images are natural-weighted in Figure G.1. The right panels show visibility amplitudes as a function of uv-distance from the central position of the fitting in two different binning scales (red and magenta). Red solid lines and shaded regions show best-fit models and uncertainties. To illustrate how the sizes are measured without the CRISTAL dataset, we add these results in gray points and solid lines. Figure G.3 shows results of the rest-frame UV size measurements in HST/F160W.
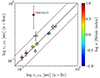 |
Fig. G.1. UV size comparison between the case with the Sérsic index fixed (n = 1) and with the Sérsic index free. Black solid and dashed lines indicate one-to-one relation and ±0.3dex. The sizes are almost consistent, except for CRISTAL-25 showing a large Sérsic index (n = 7.3 ± 1.7). |
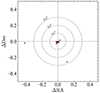 |
Fig. G.2. Coordinate offset between sources extracted in the HST image and those in Gaia DR1 data. Black and red points show the individual and median values, respectively. While the number of Gaia sources included in the HST images is small, there is no systematic offset in the HST images due to astrometry. |
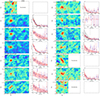 |
Fig. G.3. Fitting results of the ALMA images. The left and middle panels show the natural-weighted observed and residual images respectively. The contours indicate every 1σ from ±3σ to 10σ and every 3σ from 10σ. The right panels show the visibility real part as a function of uv-distance from a central position of the fitting in two different binning scales (red and blue). Red solid lines and shaded regions show best-fit models and 1σ uncertainties. We also show sizes without the CRISTAL dataset when the fittings have converged. (gray points and solid lines). |
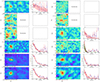 |
Fig. G.4. Continue from Figure G.2. For CRISTAL-21, we also show the best-fit profile assuming Gaussian to illustrate how the measurement is uncertain due to the extrapolation toward the uv distance of < 50 kλ |
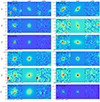 |
Fig. G.5. The fitting results of the HST/F160W images. Observed, model and residual images are shown from left to right. The contours indicate every 2σ from ±4σ. |
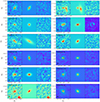 |
Fig. G.6. (continue) |
All Tables
All Figures
|
Fig. 1. SFR vs. stellar mass with z = 5 main-sequence parameterization (Speagle et al. 2014) and comparison z = 4–6 galaxies in the COSMOS catalog (Laigle et al. 2016). Pink squares are primary targets of the CRISTAL program and blue squares are serendipitously detected galaxies and additional CRISTAL+ galaxies (see Section 2.1). The sources whose dust continuum is detected with S/N > 4 are marked with crosses. The CRISTAL galaxies are located within ±0.5 dex of the star formation main-sequence at z = 5, suggesting they are representative populations at this epoch. |
| In the text | |
|
Fig. 2. Thumbnails of the dust-detected CRISTAL galaxies. The background images are HST/F160W images. The natural-weighted and natural-weighted+0.5″-tapered rest-frame 158 μm dust continuums are also shown in red and blue contours, respectively. An average beam size of natural-weighted continuum images is 0.46″ = 2.9 kpc. The contour levels are shown every 1σ within 3–9σ and every 2σ from 9σ, respectively. For CRISTAL-22, contour levels are shown every 2σ from 3σ. The source ID, redshift, S/N, and morphological classification based on the HST images are also shown in each panel. |
| In the text | |
|
Fig. 3. An example of the fitting in the visibility plane. (left) Observed and residual (observed – best-fit model) dirty map of the dust continuum emission. The synthesized beam is shown in the bottom left. The black contour shows every 1σ from ±3σ. (right) Real part of the observed visibilities as a function of uv distance with different binning scales. The best-fit exponential disk model and its 1σ uncertainty are shown in a red solid line and shaded area, respectively. |
| In the text | |
|
Fig. 4. Comparison of the flux density estimated from UVMULTIFIT and Taper images, color-coded according to the source S/N. The black solid line and dashed lines indicate a one-to-one relation and ±0.3 dex, respectively. We note that the visibility fitting has recovered the fluxes of the sources in the lower-resolution images well within the 1σ errors, except for CRISTAL-21 (see text). |
| In the text | |
|
Fig. 5. Total IR luminosities and (left) effective radii and (right) surface IR luminosities for CRISTAL galaxies, SMGs at z ∼ 2.5 (Gullberg et al. 2019), lensed SMGs at z ∼ 3–6 (Spilker et al. 2016), SMGs at z = 4–6 (Riechers et al. 2014; De Breuck et al. 2014; Hodge et al. 2015; Gómez-Guijarro et al. 2018; Casey et al. 2019; Tadaki et al. 2020b), and DSFGs at z ∼ 2 (Tadaki et al. 2020a). Solid and dashed lines corresponding to each color show the median ΣIR for each sample. Gray solid lines show the effective radii and surface IR luminosities at intervals of 0.5 dex from 0.1 kpc to 10 kpc. The black dashed line shows the representative beam size ( |
| In the text | |
|
Fig. 6. Size comparison of the dust continuum (re, dust) and the UV continuum (re, UV). The black solid and dashed lines indicate the size ratios of the UV and dust continuum. The average size ratio of the CRISTAL galaxies (re, dust/re, UV ∼ 1.8) is shown with the red solid line. Recent results from the ALPINE survey are also shown in red open circles (Pozzi et al. 2024). The black vertical and horizontal lines show representative beam sizes (σbeam) in HST (x-axis) and ALMA (y-axis). The green shaded region shows the size ratio predicted in the illustrious TNG50 simulation (Popping et al. 2022). Overall, CRISTAL galaxies possibly have a more extended distribution in dust thermal emission than in UV radiation, which is contrary to expectations based on simulation. |
| In the text | |
|
Fig. 7. Obscured fraction as a function of stellar masses. Black solid and dashed lines show the results from Whitaker et al. (2017) with two different dust emission templates: that of Dale & Helou (2002) “D02” and that of Magdis et al. (2012) and Béthermin et al. (2015) “M12, B15”. (left) Results from our stacking analysis with those in previous studies. The obscured fraction increases as a function of the stellar mass, and this trend is in good agreement with the results at z ∼ 5 from the ALPINE survey (Fudamoto et al. 2020a) and those at z ∼ 6–9 from the REBELS survey (Algera et al. 2023); another result at z ∼ 6.5–7.7 from the REBELS survey (Bowler et al. 2023) shows the opposite trend, with slightly higher fobs at M* < 1010 M⊙. (right) Results for the individual galaxies. The diamonds and squares correspond to the two classifications of single and multiple. We also show the results of the galaxies detected in the dust continuum at z ∼ 5 (Fudamoto et al. 2020a). The CRISTAL observations capture the galaxies with smaller fobs compared with previous z ∼ 5 galaxies individually detected thanks to deep observations. There is significant variation in the fobs–M* relation from galaxy to galaxy. |
| In the text | |
|
Fig. 8. Distance from the average fobs–M* relation as a function of (left) the spatial offset at the central position between UV and dust emission, (middle) the size ratio between UV and dust emission, and (right) the surface density of LIR. Galaxies without clear main UV components and without dust continuum detection at < 4σ are not shown. Based on the Spearman correlation coefficients and p-values, fobs has a correlation with the UV-dust spatial offset and ΣIR. On the other hand, there is no correlation between fobs and the size ratio between UV and dust emission. |
| In the text | |
|
Fig. 9. Normalized radial profiles of the stacked dust and UV continua (red and blue, respectively). The perpendicular lines are effective radii derived from the best-fit Sérsic profile in the corresponding colors. Here we used only “single” galaxy samples to avoid the blending of the companion. The matched PSF size is also shown with a black solid line. The inset shows the 2D distributions. |
| In the text | |
|
Fig. 10. Stellar mass versus effective radius of the dust continuum for the CRISTAL galaxies (red filled markers). The average stellar mass and stacked size derived in Section D.2 is also shown by the magenta point. The dashed and solid lines show the scaling relations derived with HST and JWST. The orange and green colors represent the rest-frame optical sizes of ETGs (van der Wel et al. 2014; Ito et al. 2023), and the LTGs (van der Wel et al. 2014; Ward et al. 2023). The blue colors indicate rest-frame UV sizes of LBGs (Shibuya et al. 2016; Morishita et al. 2023). Recent results from the ALPINE survey are also shown in red open circles (Pozzi et al. 2024). The CRISTAL galaxies are distributed asound the scaling sequence of LTGs and LBGs, in contrast to the massive SMGs, which show consistent dust continuum sizes and stellar masses with those of ETGs (Riechers et al. 2014; De Breuck et al. 2014; Hodge et al. 2015; Gómez-Guijarro et al. 2018; Casey et al. 2019; Tadaki et al. 2020b). |
| In the text | |
|
Fig. A.1. Thumneil of the CRISTAL-04 field. Background and white contours indicate the UV and dust continuum from HST and ALMA, respectively. The extracted sources in the COSMOS2015 and COSMOS2020 catalogs are shown in blue squares and red diamonds. For CRISTAL-04, the COSMOS2015 catalog shows better source extraction. |
| In the text | |
|
Fig. C.1. SFRUV + SFRIR vs SFRSED. The black dashed line represents a one-to-one relationship. SFRSED is broadly consistent with SFRUV + SFRIR, except for CRISTAL-24. |
| In the text | |
|
Fig. D.1. Comparison of the flux density and FWHM between fitting results and input models. The left, middle, and right panels show the results for sources detected at S/N = 4.4–5.5, S/N = 6.5–7.8 and S/N ≥ 12.3, respectively. Different colors indicate different visibilities used in the simulation, corresponding to the different array configurations. White circles and error bars show 50 ± 34% percentiles in the bins of output values. Black solid and dashed lines correspond to the averages and standard deviations of the fitting results and output models, which are also shown in the bottom right of each panel. |
| In the text | |
|
Fig. G.1. UV size comparison between the case with the Sérsic index fixed (n = 1) and with the Sérsic index free. Black solid and dashed lines indicate one-to-one relation and ±0.3dex. The sizes are almost consistent, except for CRISTAL-25 showing a large Sérsic index (n = 7.3 ± 1.7). |
| In the text | |
|
Fig. G.2. Coordinate offset between sources extracted in the HST image and those in Gaia DR1 data. Black and red points show the individual and median values, respectively. While the number of Gaia sources included in the HST images is small, there is no systematic offset in the HST images due to astrometry. |
| In the text | |
|
Fig. G.3. Fitting results of the ALMA images. The left and middle panels show the natural-weighted observed and residual images respectively. The contours indicate every 1σ from ±3σ to 10σ and every 3σ from 10σ. The right panels show the visibility real part as a function of uv-distance from a central position of the fitting in two different binning scales (red and blue). Red solid lines and shaded regions show best-fit models and 1σ uncertainties. We also show sizes without the CRISTAL dataset when the fittings have converged. (gray points and solid lines). |
| In the text | |
|
Fig. G.4. Continue from Figure G.2. For CRISTAL-21, we also show the best-fit profile assuming Gaussian to illustrate how the measurement is uncertain due to the extrapolation toward the uv distance of < 50 kλ |
| In the text | |
|
Fig. G.5. The fitting results of the HST/F160W images. Observed, model and residual images are shown from left to right. The contours indicate every 2σ from ±4σ. |
| In the text | |
|
Fig. G.6. (continue) |
| In the text | |
Current usage metrics show cumulative count of Article Views (full-text article views including HTML views, PDF and ePub downloads, according to the available data) and Abstracts Views on Vision4Press platform.
Data correspond to usage on the plateform after 2015. The current usage metrics is available 48-96 hours after online publication and is updated daily on week days.
Initial download of the metrics may take a while.