Fig. 10.
Download original image
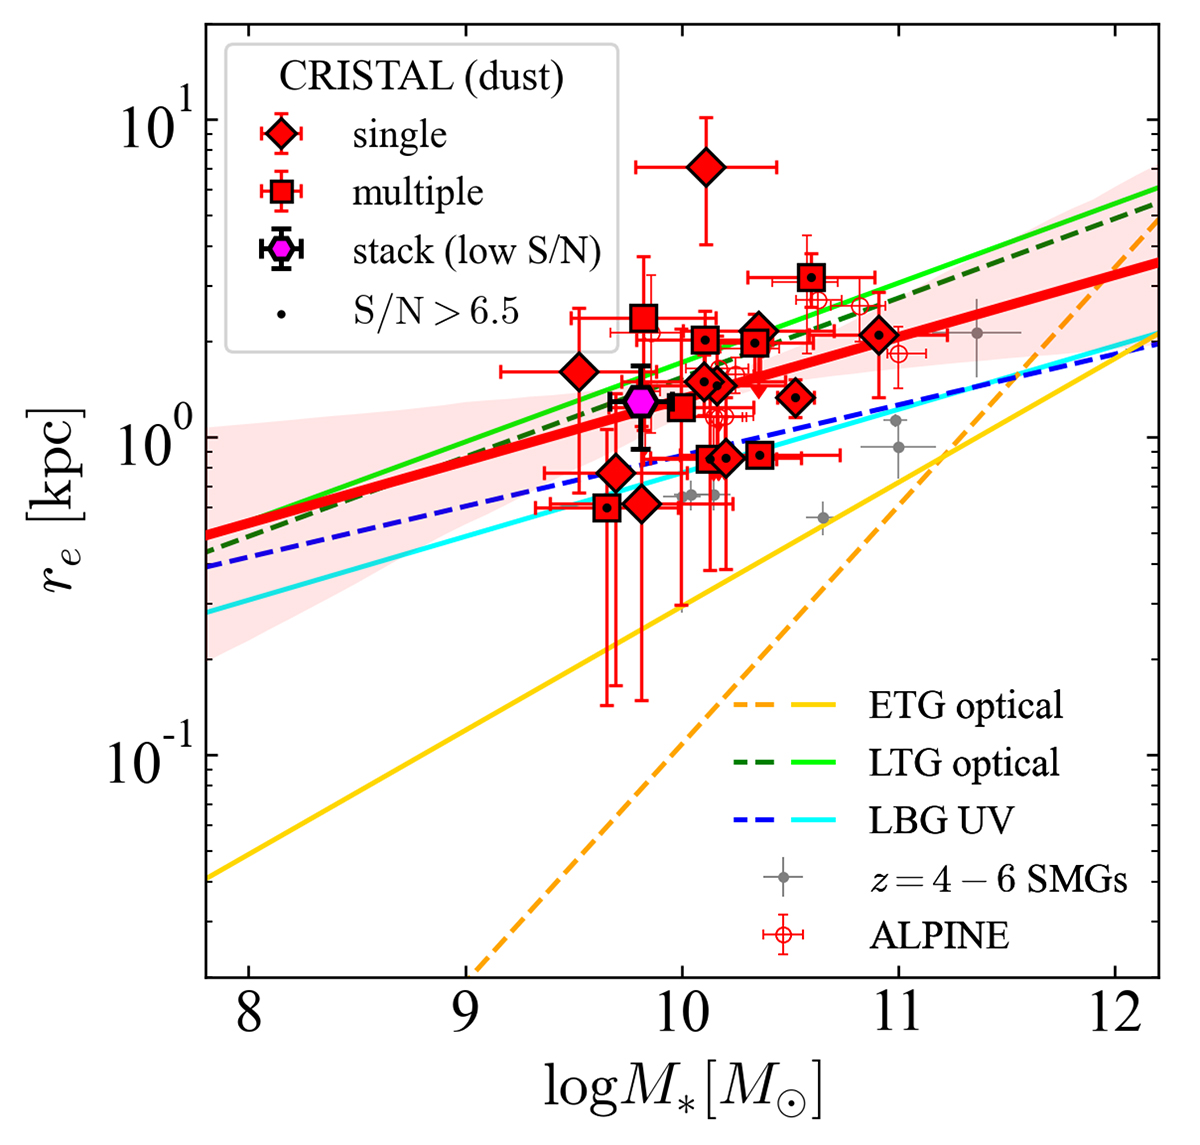
Stellar mass versus effective radius of the dust continuum for the CRISTAL galaxies (red filled markers). The average stellar mass and stacked size derived in Section D.2 is also shown by the magenta point. The dashed and solid lines show the scaling relations derived with HST and JWST. The orange and green colors represent the rest-frame optical sizes of ETGs (van der Wel et al. 2014; Ito et al. 2023), and the LTGs (van der Wel et al. 2014; Ward et al. 2023). The blue colors indicate rest-frame UV sizes of LBGs (Shibuya et al. 2016; Morishita et al. 2023). Recent results from the ALPINE survey are also shown in red open circles (Pozzi et al. 2024). The CRISTAL galaxies are distributed asound the scaling sequence of LTGs and LBGs, in contrast to the massive SMGs, which show consistent dust continuum sizes and stellar masses with those of ETGs (Riechers et al. 2014; De Breuck et al. 2014; Hodge et al. 2015; Gómez-Guijarro et al. 2018; Casey et al. 2019; Tadaki et al. 2020b).
Current usage metrics show cumulative count of Article Views (full-text article views including HTML views, PDF and ePub downloads, according to the available data) and Abstracts Views on Vision4Press platform.
Data correspond to usage on the plateform after 2015. The current usage metrics is available 48-96 hours after online publication and is updated daily on week days.
Initial download of the metrics may take a while.