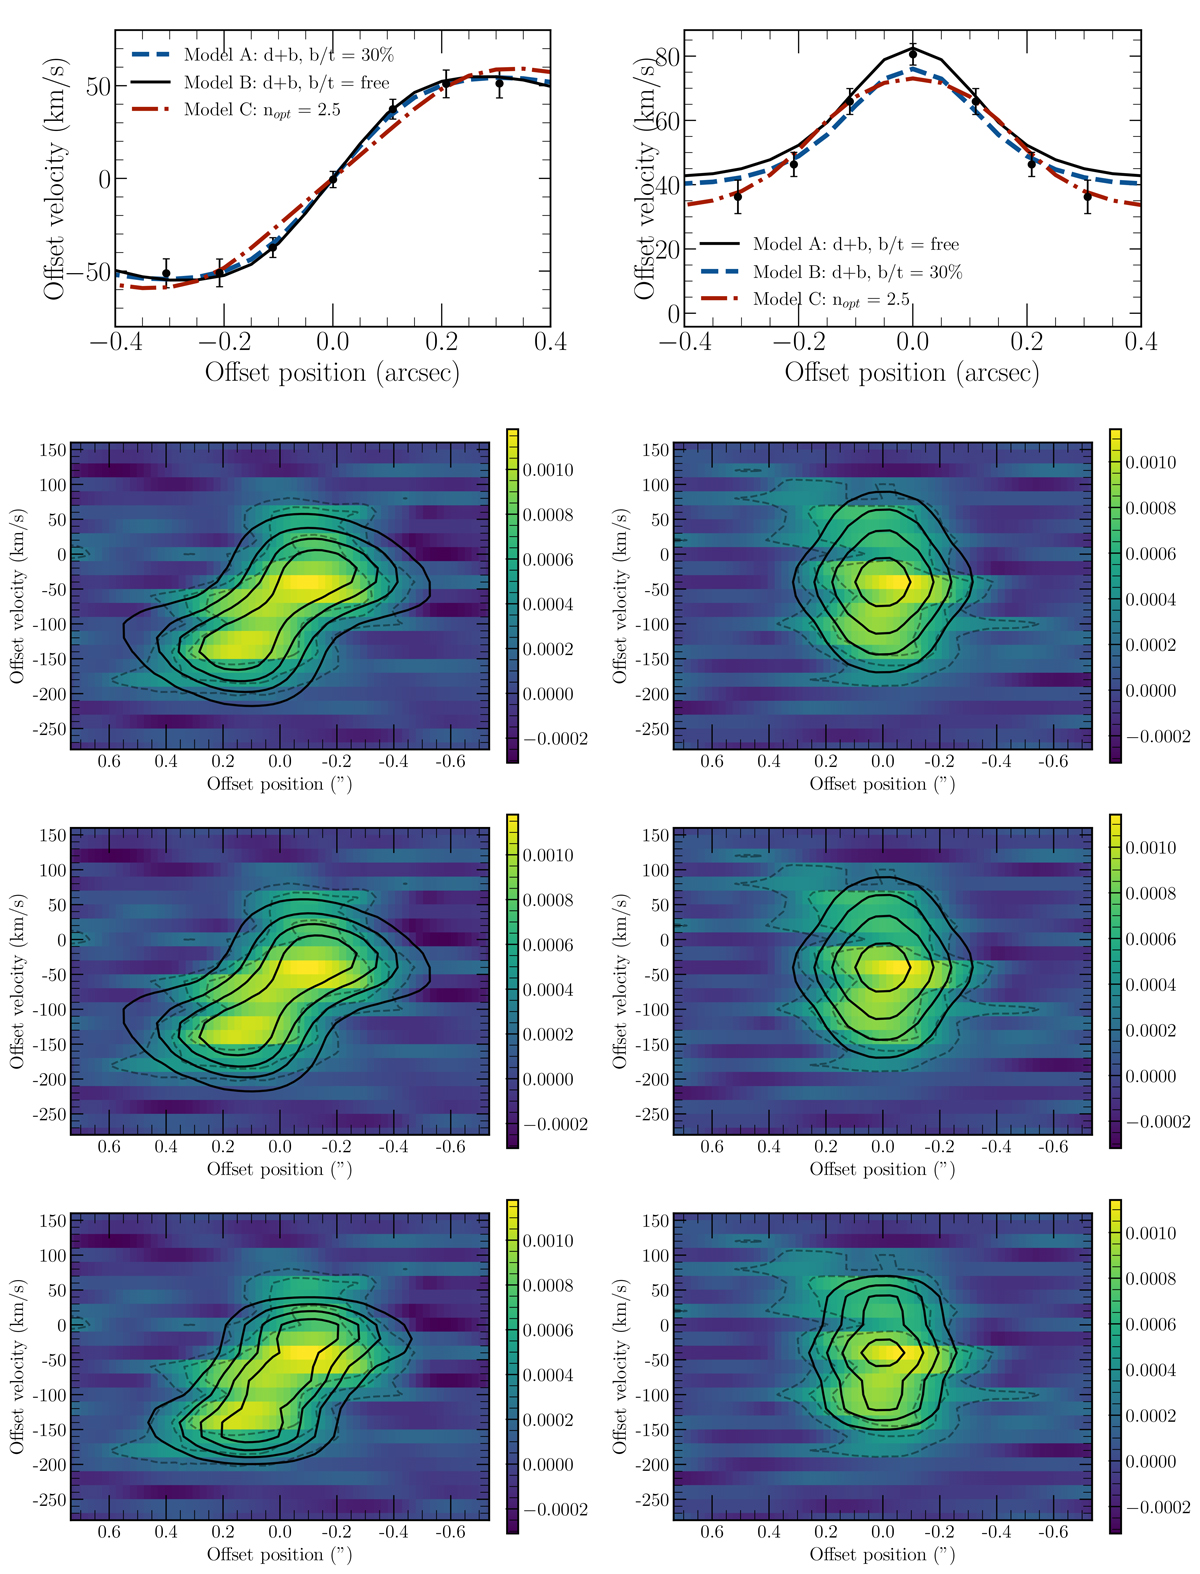
Fig. B.1.
Download original image
(First row): Velocity (left) and dispersion (right) 1D profiles of the observation and models. (Second to forth row): Position-velocity diagrams of C05-NW, extracted along the major (left) and minor (right) axes using a pseudo-slit with a width of 0.245″. The dashed lines represent the 3, 4, and 5σ levels of the observation. The solid black lines represent 0.3, 0.5, 0.7 and 0.9 times the emission peak of the main model A (second row), of Model B (third row), and of the disk-only Model C (forth row).
Current usage metrics show cumulative count of Article Views (full-text article views including HTML views, PDF and ePub downloads, according to the available data) and Abstracts Views on Vision4Press platform.
Data correspond to usage on the plateform after 2015. The current usage metrics is available 48-96 hours after online publication and is updated daily on week days.
Initial download of the metrics may take a while.