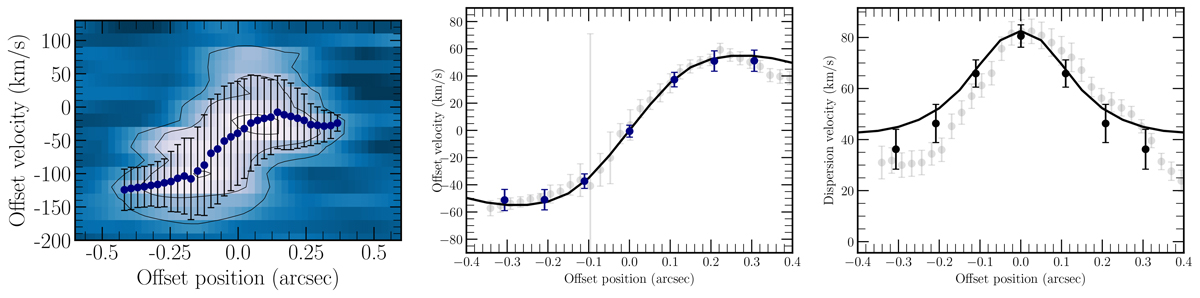
Fig. 10.
Download original image
Radial rotation curves of C05-NW as the input for DYSMALpy. (a) Left panel: Position-velocity diagram in an extracted-C05-NW cube, with a slit along the major axis with a width of 0.245″. The navy circles are the peak velocity of the Gaussian distribution in each position, and the black error bars are the dispersion of the distribution. These curves were symmetrized and are presented in the central and right panels. (b) Central panel: Symmetrized rotation radial profile of C05-NW as navy circles. The background gray circles are the curve that was not symmetrized, which is shown as navy circles in the left panel. (c) Right panel: Symmetrized dispersion velocity radial profile of C05-NW as black circles. The background gray circles are the error bars in the left panel before they were symmetrized.
Current usage metrics show cumulative count of Article Views (full-text article views including HTML views, PDF and ePub downloads, according to the available data) and Abstracts Views on Vision4Press platform.
Data correspond to usage on the plateform after 2015. The current usage metrics is available 48-96 hours after online publication and is updated daily on week days.
Initial download of the metrics may take a while.