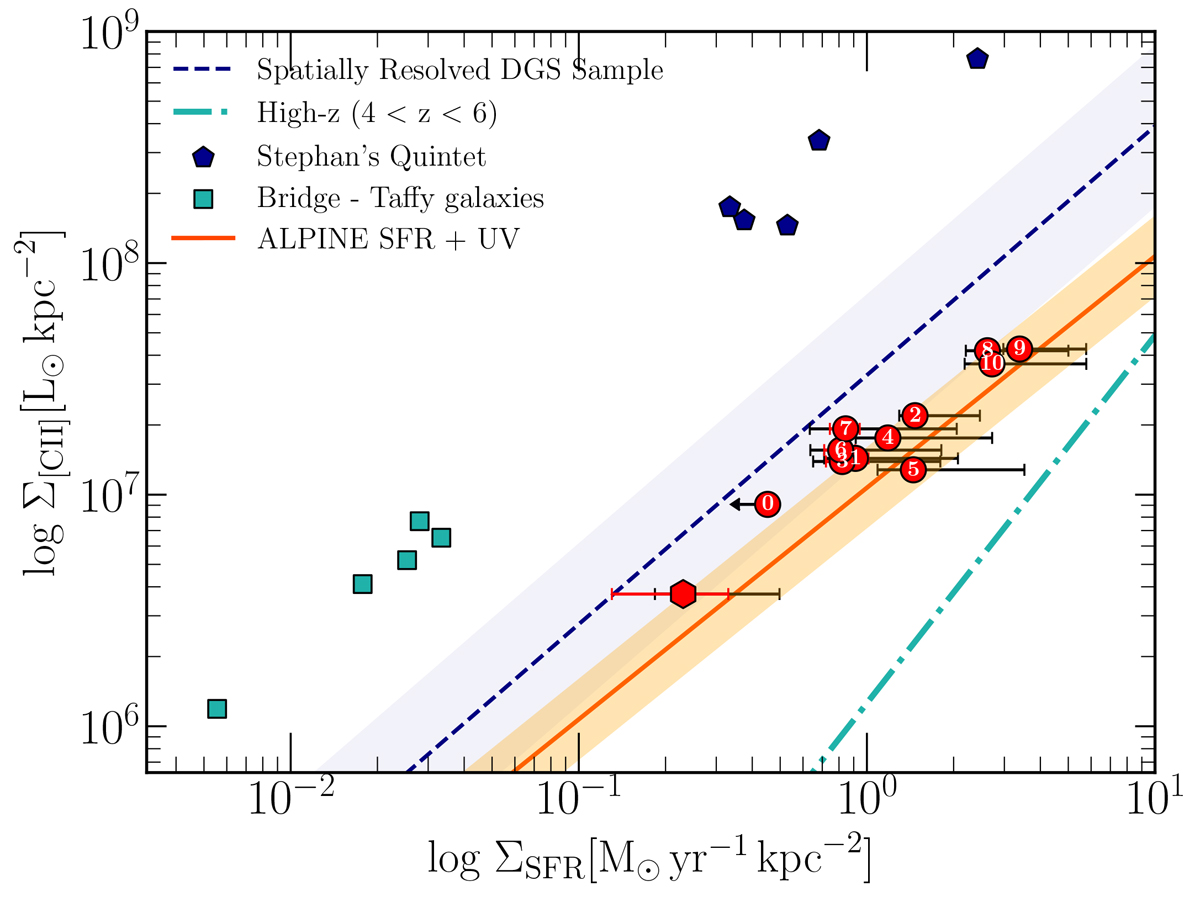
Fig. 13.
Download original image
[C II] surface density of CRISTAL-05 and its subregions as a function of the SFR surface density. The global measurement (aperture of 1.5″) is represented as a red hexagon, and the subregions as red circles, labeled as shown in the left panel Figure 12. We also display relations of local (navy dashed line, De Looze et al. 2014) and high-redshift galaxies (z > 4), as cyan dot-dashed (Carniani et al. 2018) and navy dashed (Schaerer et al. 2020) lines. For the latter, we convert the L[CII] – SFR correlation to the surface density, assuming an average area of 8 kpc−2.
Current usage metrics show cumulative count of Article Views (full-text article views including HTML views, PDF and ePub downloads, according to the available data) and Abstracts Views on Vision4Press platform.
Data correspond to usage on the plateform after 2015. The current usage metrics is available 48-96 hours after online publication and is updated daily on week days.
Initial download of the metrics may take a while.