Open Access
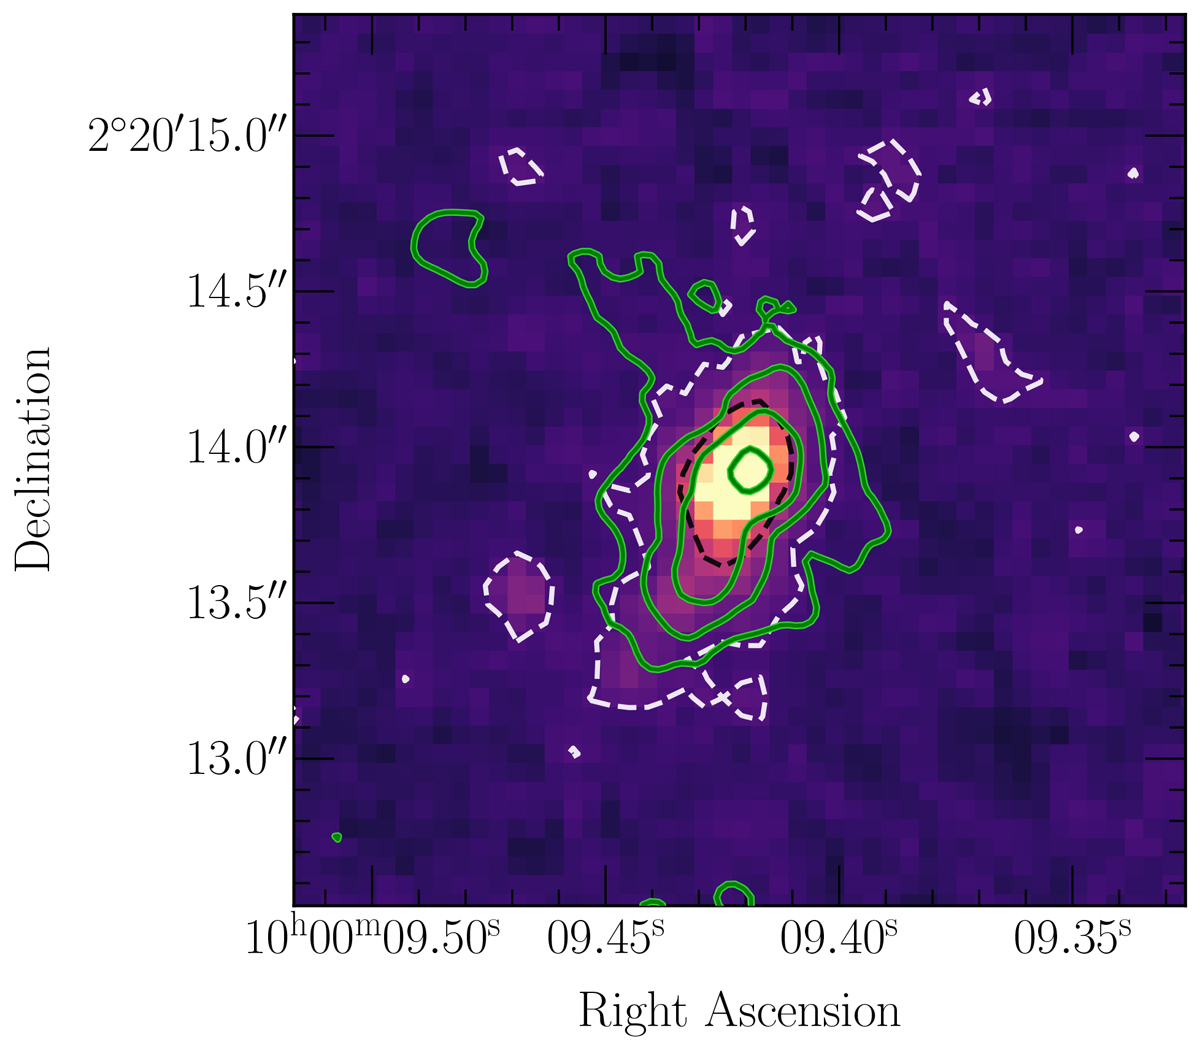
Fig. 6.
Download original image
F277W-band image of CRISTAL-05 that captures the rest-frame optical emission at z = 5.54. The black contours denote the 3, 4, 5, and 6σ levels of the F277W band, while the white contours represent the 3, 4, 5, and 6σ contours from the [CII] moment-0 map.
Current usage metrics show cumulative count of Article Views (full-text article views including HTML views, PDF and ePub downloads, according to the available data) and Abstracts Views on Vision4Press platform.
Data correspond to usage on the plateform after 2015. The current usage metrics is available 48-96 hours after online publication and is updated daily on week days.
Initial download of the metrics may take a while.