Fig. 12.
Download original image
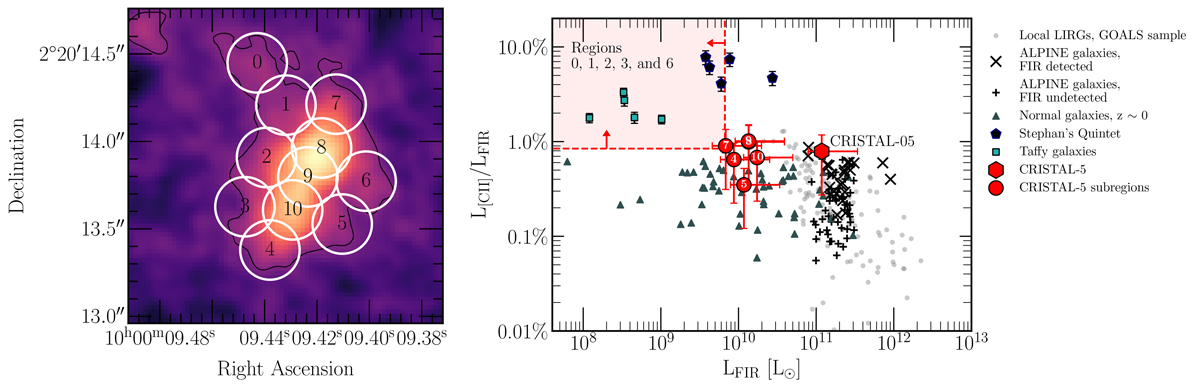
(a) Left panel: [C II] moment-0 map, same as Figure 5, with 0.17″ apertures across the galaxy (white circles). The emission we extracted is analyzed in the right panel and in Figure 13. (b) Right panel: [C II] -to-FIR luminosity ratio as a function of the FIR luminosity. The global measurement (aperture of 1.5″) is shown as a red hexagon, and subregions 8, 9, and 10 are shown as red circles. The uncertainties reflect the possible dust temperature range between 40 and 60 K. The red area locates the upper limits of the mean of the ratios, where the dust emission is undetected. As a comparison, we also reference to z ∼ 0 LIRGS of the GOALS sample (gray circles; Díaz-Santos et al. 2013), z ∼ 0 normal galaxies (darkgray triangles; Malhotra et al. 2001), a purely shock-gas region in the Stephan's Quintet compact group (navy pentagons; Appleton et al. 2013), shock-gas in the bridge of the merging pair UGC12914/12915 (cyan squares; Peterson et al. 2018), and 4 < z < 6 typical galaxies from the ALPINE galaxies (IR detected sources as x-shape marker and IR upper limits as plus-shape markers; Béthermin et al. 2020).
Current usage metrics show cumulative count of Article Views (full-text article views including HTML views, PDF and ePub downloads, according to the available data) and Abstracts Views on Vision4Press platform.
Data correspond to usage on the plateform after 2015. The current usage metrics is available 48-96 hours after online publication and is updated daily on week days.
Initial download of the metrics may take a while.