Fig. 7.
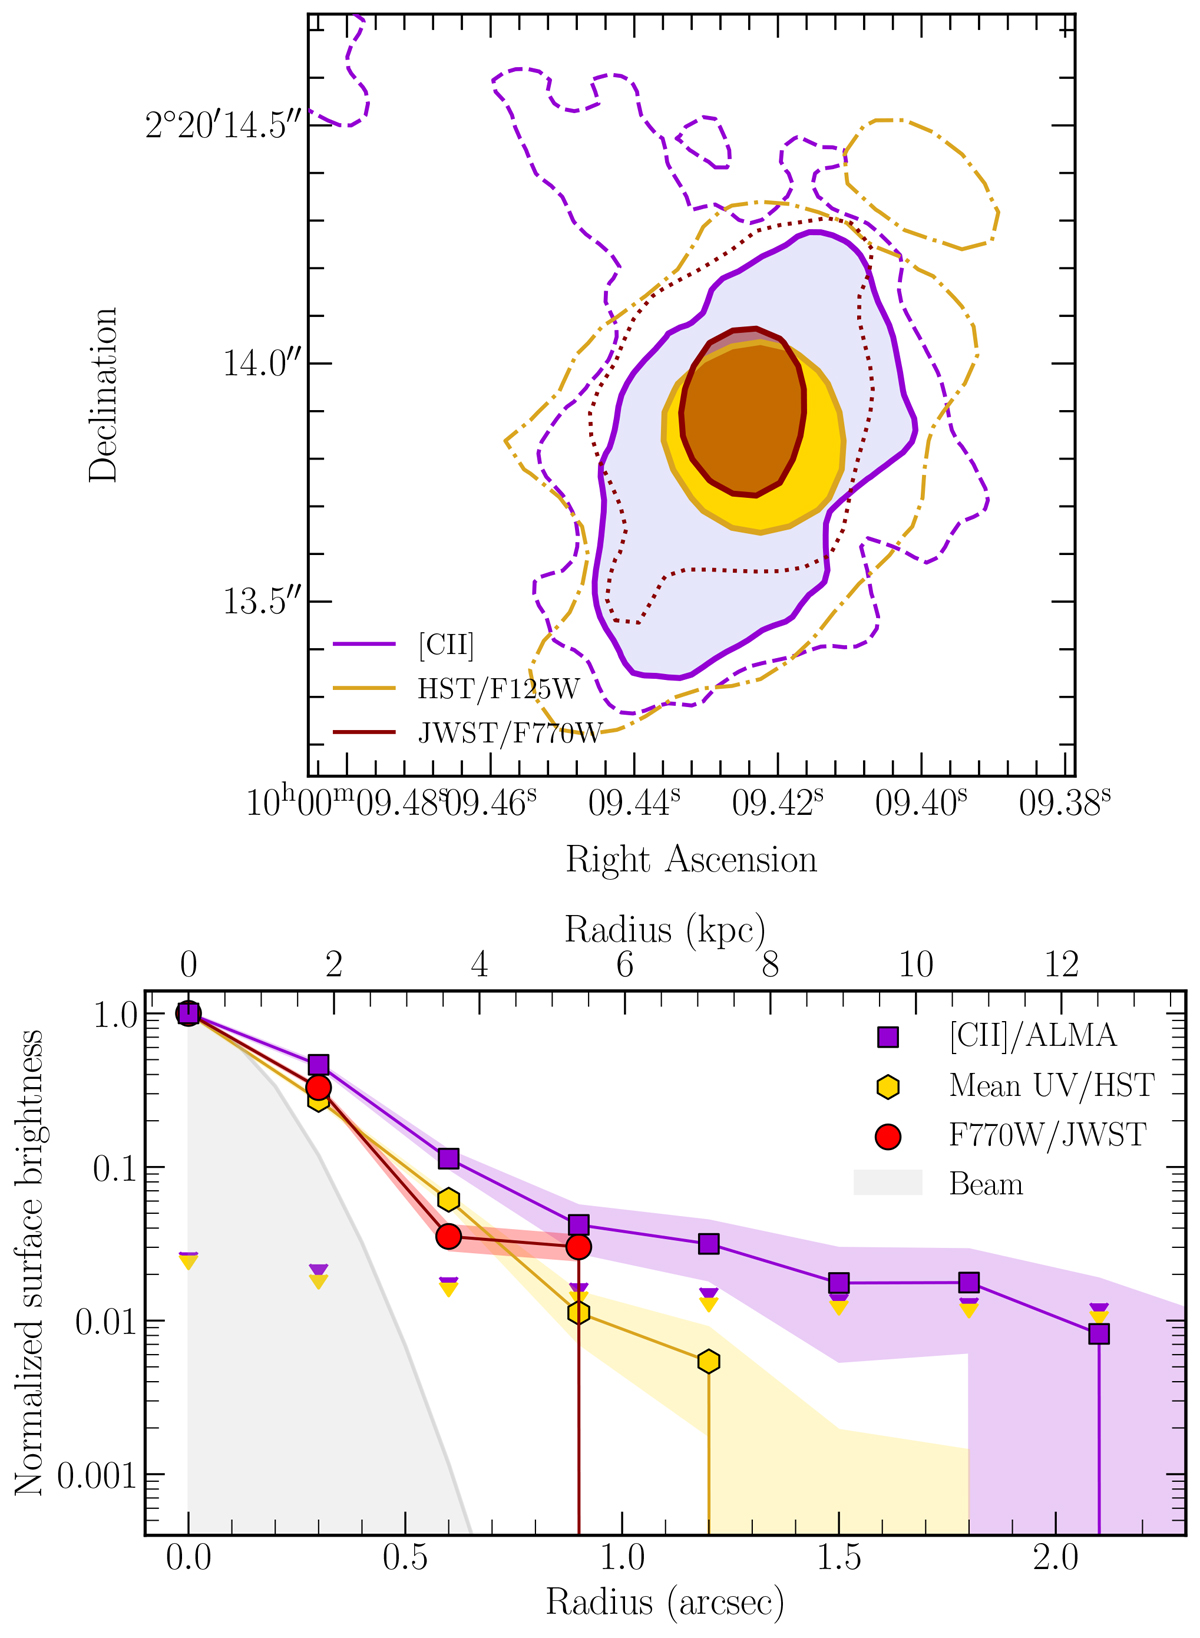
Download original image
Comparison of the multiwavelength radial profiles. (a) Top: Resolution-matched (0.33″× 0.27″) moment-0 maps. The [C II] , HST, and JWST are color-coded purple, yellow, and dark red, respectively. The solid lines correspond to the significance levels, which contain half of the total flux density of the galaxy. The dashed, dot-dashed, and dotted lines correspond to the 3-σ edge of the source in [C II] , rest-frame UV, and rest-frame NIR, respectively. (b) Bottom: Surface brightness profiles of [C II] and (average F105W + F125W + F140W + F160W) UV emission, in 0.3″ width elliptical apertures all centered in the [C II] centroid. The purple and yellow arrows show 1σ upper limits.
Current usage metrics show cumulative count of Article Views (full-text article views including HTML views, PDF and ePub downloads, according to the available data) and Abstracts Views on Vision4Press platform.
Data correspond to usage on the plateform after 2015. The current usage metrics is available 48-96 hours after online publication and is updated daily on week days.
Initial download of the metrics may take a while.