Fig. 8.
Download original image
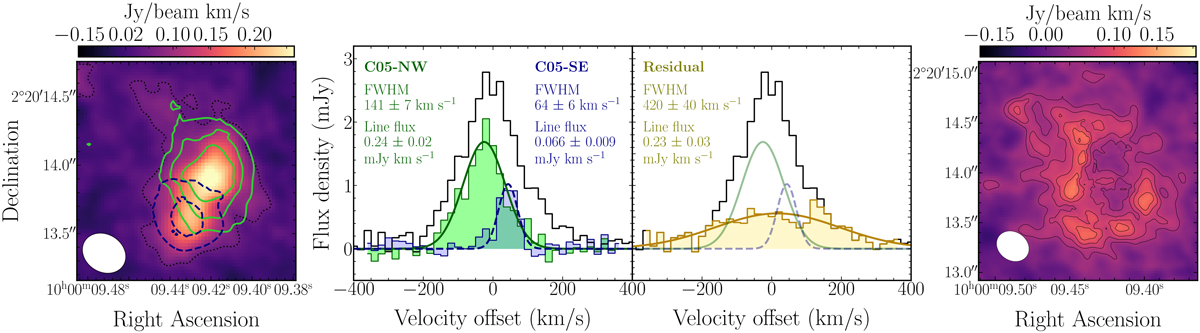
Morphologies and spectra of the individual galaxies and extended emission. [From left to right,] (a) the first panel shows the non-JvM-corrected [C II] moment-0 map of CRISTAL-05, similar to the central panel of Figure 5, with C05-NW and C05-SE maps overlaid as solid green and dashed navy lines, respectively (3, 9, and 15 σrms). (b) Second panel: JvM-corrected spectra of CRISTAL-05 (black line), C05-NW (green line), and C05-SE (navy line), for apertures that enclose all the emissions of each component. The Gaussian distribution represents the best fit for the spectra of C05-NW and C05-SE, with a FWHM of 141 ± 7 and 64 ± 6 km s−1 , respectively. (c) Third panel: JvM-corrected spectra of CRISTAL-05 (black line) and the subtraction of components C05-NW and C05-SE (yellow line). The Gaussian distribution represents the best fit for the spectra of the residual, with a FWHM of 420 ± 40. (d) Non-JvM-corrected [C II] moment-0 map of CRISTAL-05, with the residual emission of the cube after subtracting components C05-NW and C05-SE (as 3-, 9-, 15-σrms)
Current usage metrics show cumulative count of Article Views (full-text article views including HTML views, PDF and ePub downloads, according to the available data) and Abstracts Views on Vision4Press platform.
Data correspond to usage on the plateform after 2015. The current usage metrics is available 48-96 hours after online publication and is updated daily on week days.
Initial download of the metrics may take a while.