Fig. 12.
Download original image
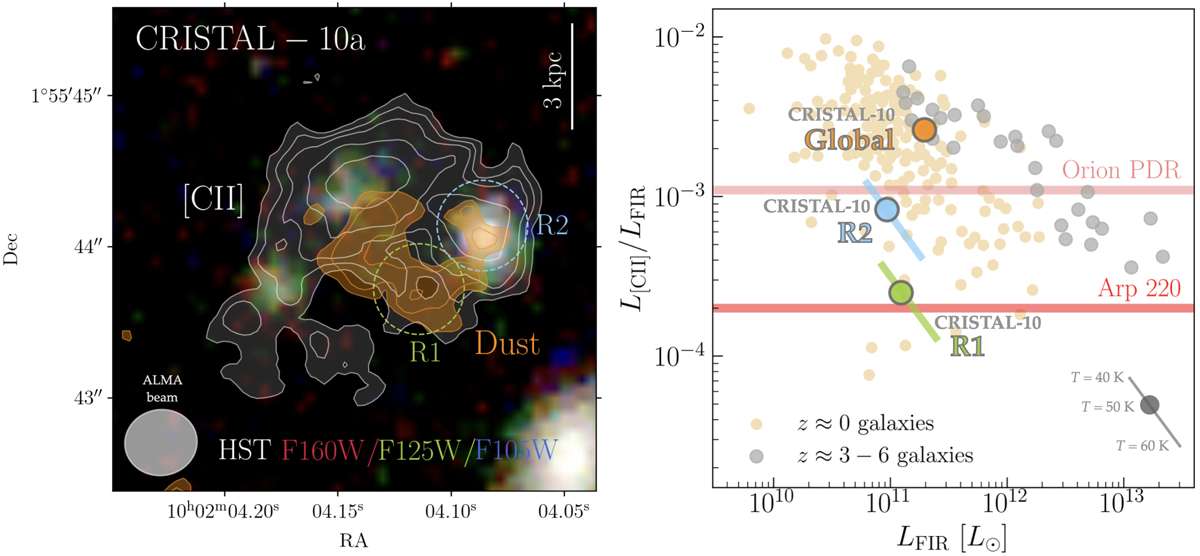
Left: Multiwavelength view of CRISTAL-10, a main-sequence star-forming galaxy at z = 5.67. The background image is a composite of three HST/WFC3 filters, highlighting the rest-frame UV stellar light emitted by young, massive stars. Overlaid on this image are white contours showing the integrated [C II] line emission (3, 4, 5, 7 and 10σ levels), and orange contours showing the dust continuum emission at rest-frame 158 μm (2.5, 3, 4 and 5σ levels). The dust continuum reveals two distinct peaks, designated as Region 1 and Region 2. In Region 1, the dust continuum emission lacks a corresponding rest-frame UV light counterpart, and the [C II] line emission is faint. Region 2, on the other hand, correspond to a star-forming region where the rest-frame UV, dust, and [C II] line emission peak. Right: [C II]/FIR luminosity ratio as a function of the FIR luminosity observed in nearby star-forming galaxies and starbursts (beige points; Lutz et al. 2016; Herrera-Camus et al. 2018b) and high-z star-forming galaxies (gray points; Spilker et al. 2016, and references therein). The [C II]/FIR luminosity ratio measured in the star-forming Region 2 (light blue circle) is comparable to that measured in the dense PDR of the Orion complex, while the [C II]/FIR luminosity ratio of Region 1 (yellow) is significantly low, comparable only to extreme local systems such as Arp 220 (e.g., Luhman et al. 1998, 2003), characterized by deeply embedded star formation. The FIR luminosities where measured based on the Band 7 continuum using the conversion factor by Béthermin et al. (2020) and assuming a dust temperature of 50 K. The diagonal line represents how much the measurements of Regions 1 and 2 change if we assume a dust temperature of 40 K and 60 K. We also show the global value (orange circle) measured using the LFIR in Mitsuhashi et al. (2024) and the integrated [C II] flux from Table 1.
Current usage metrics show cumulative count of Article Views (full-text article views including HTML views, PDF and ePub downloads, according to the available data) and Abstracts Views on Vision4Press platform.
Data correspond to usage on the plateform after 2015. The current usage metrics is available 48-96 hours after online publication and is updated daily on week days.
Initial download of the metrics may take a while.