Open Access
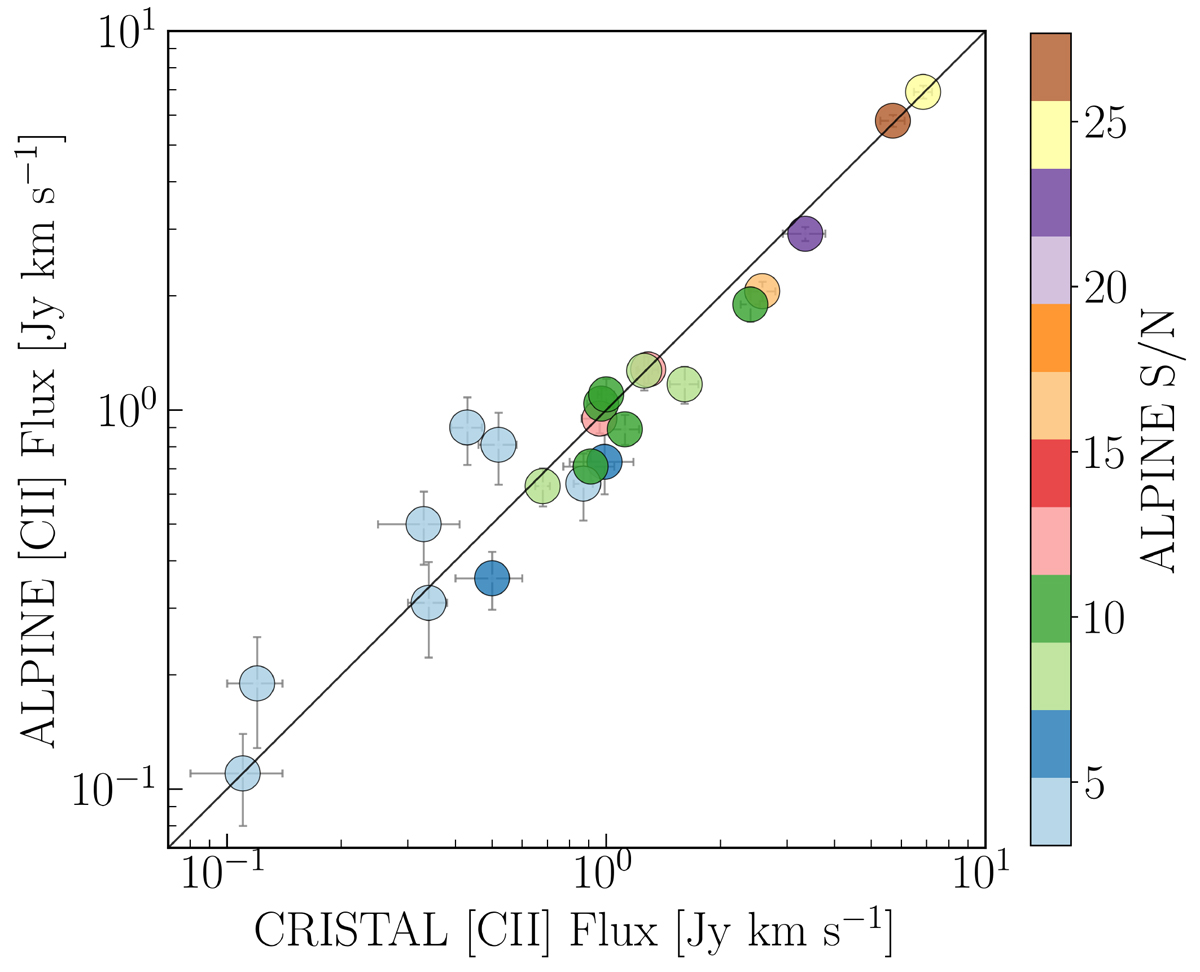
Fig. 7.
Download original image
[C II] integrated flux measured from the CRISTAL and ALPINE data. The colorscale represents the S/N of the integrated line detection in the ALPINE data (Béthermin et al. 2020). In general there is good agreement between the CRISTAL and ALPINE fluxes, except for four systems that were detected with S/N ≲5 in the ALPINE data.
Current usage metrics show cumulative count of Article Views (full-text article views including HTML views, PDF and ePub downloads, according to the available data) and Abstracts Views on Vision4Press platform.
Data correspond to usage on the plateform after 2015. The current usage metrics is available 48-96 hours after online publication and is updated daily on week days.
Initial download of the metrics may take a while.