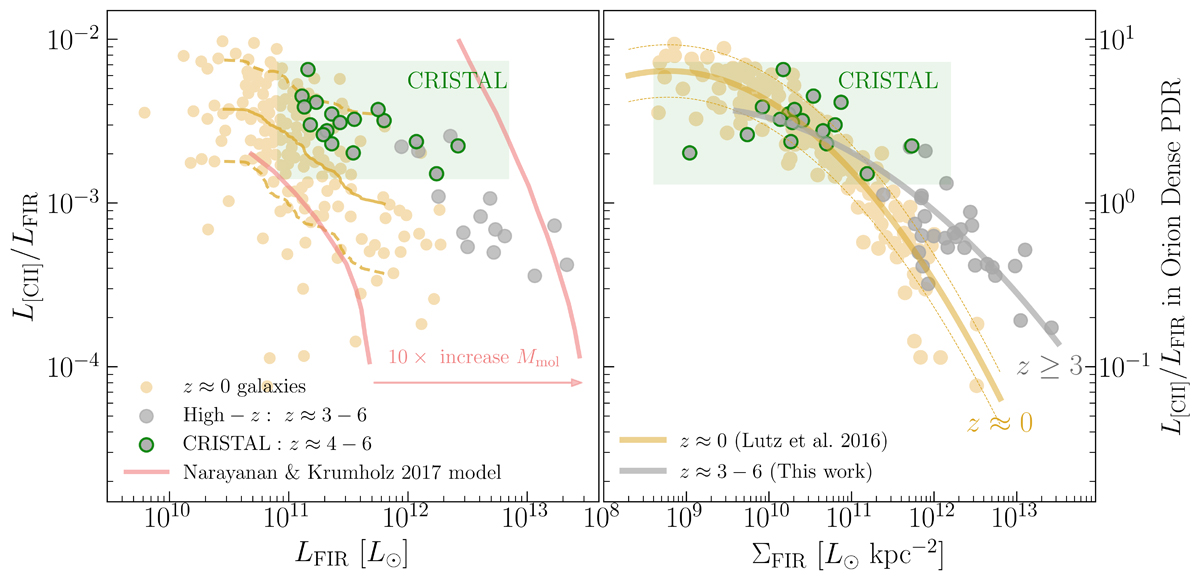
Fig. 14.
Download original image
Left: [C II]/FIR luminosity ratio as a function of the FIR luminosity observed in nearby star-forming galaxies and starbursts (beige points; Lutz et al. 2016; Herrera-Camus et al. 2018b) and high-z star-forming galaxies (gray points; Spilker et al. 2016, and references therein). CRISTAL galaxies are shown as gray points with green borders. As a reference, the y axis on the right shows the [C II]/FIR luminosity ratio normalized to the value measured in the dense PDR of the Orion Nebula (L[CII]/LFIR = 1.1 × 10⁻³; Goicoechea et al. 2015). The predictions from the models by Narayanan & Krumholz (2017) of how the relation between L[CII]/LFIR and LFIR changes if the molecular gas content increase by a factor of ×10 are shown as light-blue lines. The solid golden line represents the running median for z ≈ 0 galaxies, while the dashed lines indicate the 10th and 90th percentiles. Right: Similar to the left panel, but this time we plot the [C II]/FIR luminosity ratio as a function of the FIR surface brightness (ΣFIR). The best fit to the data at z ≈ 0 (Lutz et al. 2016; Herrera-Camus et al. 2018b) and z ≈ 3 − 6 (this work; Eq. (2)) are shown as beige and gray lines, respectively.
Current usage metrics show cumulative count of Article Views (full-text article views including HTML views, PDF and ePub downloads, according to the available data) and Abstracts Views on Vision4Press platform.
Data correspond to usage on the plateform after 2015. The current usage metrics is available 48-96 hours after online publication and is updated daily on week days.
Initial download of the metrics may take a while.