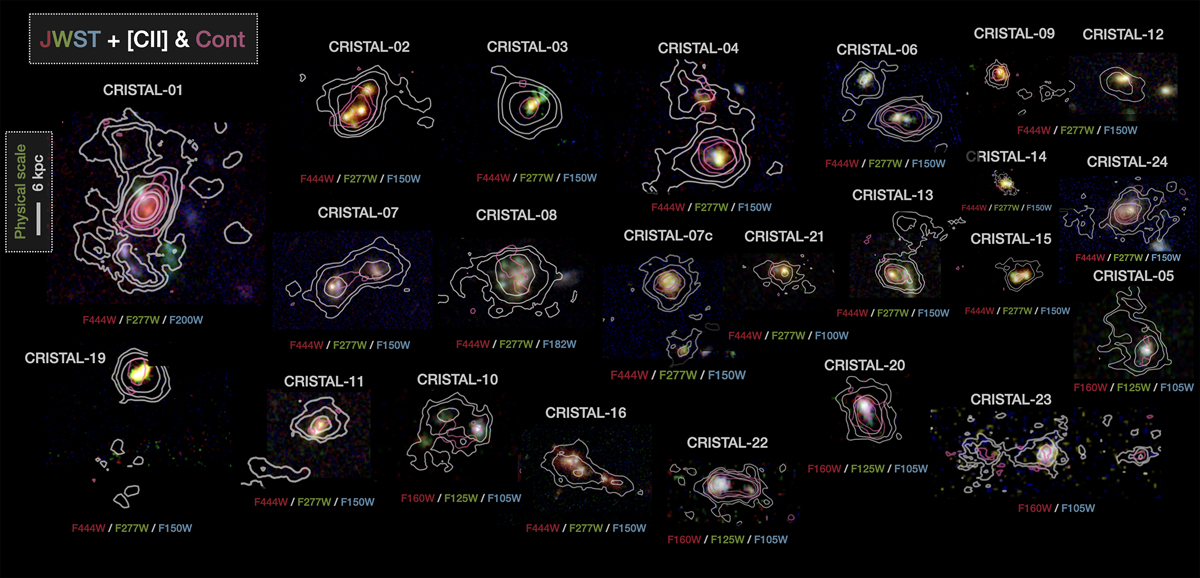
Fig. 10.
Download original image
JWST composite images of CRISTAL galaxies, overlaid with [C II] line emission (white contours) and dust continuum emission (pink contours). Contour levels correspond to [3, 5, 10]σ, except for CRISTAL-01, where the emission intensity is shown on a logarithmic scale, and contours represent [4, 6, 8, 20, 60, 100]σ levels. All maps are scaled to the same physical size, with a 6 kpc scale bar shown as a white line on the left side of each panel. For galaxies CRISTAL-10, -20, -22, and -23 we show the HST composite images as there are no JWST/NIRCam observations available.
Current usage metrics show cumulative count of Article Views (full-text article views including HTML views, PDF and ePub downloads, according to the available data) and Abstracts Views on Vision4Press platform.
Data correspond to usage on the plateform after 2015. The current usage metrics is available 48-96 hours after online publication and is updated daily on week days.
Initial download of the metrics may take a while.