| Issue |
A&A
Volume 699, July 2025
|
|
|---|---|---|
| Article Number | A154 | |
| Number of page(s) | 17 | |
| Section | Extragalactic astronomy | |
| DOI | https://doi.org/10.1051/0004-6361/202452994 | |
| Published online | 04 July 2025 | |
GA-NIFS: Dissecting the multiple sub-structures and probing their complex interactions in the Lyα emitter galaxy CR7 at z = 6.6 with JWST/NIRSpec
1
Dipartimento di Fisica e Astronomia, Università degli Studi di Firenze, Via G. Sansone 1, I-50019, Sesto Fiorentino, Firenze, Italy
2
INAF – Osservatorio Astrofisico di Arcetri, Largo E. Fermi 5, I-50125, Firenze, Italy
3
Kavli Institute for Cosmology, University of Cambridge, Madingley Road, Cambridge CB3 0HE, UK
4
Cavendish Laboratory, University of Cambridge, 19 J. J. Thomson Ave., Cambridge CB3 0HE, UK
5
Department of Physics and Astronomy, University College London, Gower Street, London WC1E 6BT, UK
6
Centro de Astrobiología (CAB), CSIC-INTA, Ctra. de Ajalvir km 4, Torrejón de Ardoz, E-28850, Madrid, Spain
7
University of Oxford, Department of Physics, Denys Wilkinson Building, Keble Road, Oxford OX13RH, UK
8
Scuola Normale Superiore, Piazza dei Cavalieri 7, I-56126 Pisa, Italy
9
Sorbonne Université, CNRS, UMR 7095, Institut d’Astrophysique de Paris, 98 bis bd Arago, 75014 Paris, France
10
Max-Planck-Institut für extraterrestrische Physik (MPE), Gießenbachstraße 1, 85748 Garching, Germany
11
NRC Herzberg, 5071 West Saanich Rd, Victoria, BC V9E 2E7, Canada
12
European Space Agency, c/o STScI, 3700 San Martin Drive, Baltimore, MD 21218, USA
13
European Southern Observatory, Karl-Schwarzschild-Strasse 2, 85748 Garching, Germany
⋆ Corresponding author: cosimo.marconcini@unifi.it
Received:
14
November
2024
Accepted:
23
May
2025
We present JWST/NIRSpec integral field spectroscopic (IFS) observations of the Lyα emitter CR7 at z ∼ 6.6, observed as part of the GA-NIFS program. Using low-resolution PRISM (R ∼ 100) data, we confirm the observation of a bright Lyα emitter with a diffuse Lyα halo extending up to 3 kpc from the peak of ionised emission. Both features are associated with the most massive UV bright galaxy in the system, CR7-A. We confirm the presence of two additional UV-bright satellites (CR7-B and CR7-C) detected at projected distances of 6.4 and 5.2 kpc from the primary source. We performed a spectral energy distribution fitting of the low-resolution data, and it revealed an inverted star formation history between two satellites at early epochs and a spatially resolved anti-correlation of the gas-phase metallicity and the star formation rate density, likely driven by the gas exchange among the satellites and favouring the merger scenario for CR7. From the high-resolution G395H (R ∼ 2700) data, we discovered at least one additional companion mainly traced by the [O III]λ5007 emission line, although it is not detected in continuum emission. We disentangled the kinematics of the system and reveal extended ionised emission linking the main galaxy and the satellite. We spatially resolved the [O III]λ5007, [O III]4363, and Hγ emission lines and used a diagnostic diagram tailored to high-z systems to reveal tentative evidence of active galactic nucleus ionisation across the main galaxy (CR7-A) and the N-E companion (CR7-B). Moreover, we detected an unresolved blueshifted outflow from one of the satellites and present first evidence for a redshifted outflow from the main galaxy. Finally, we computed the resolved electron temperature (Te∼1.6×10⁴ K) and metallicity maps (log(Z/Z⊙) from –0.8 to –0.5), and we provide insights on how the physical properties of the system evolved at earlier epochs.
Key words: galaxies: abundances / galaxies: high-redshift / galaxies: ISM / galaxies: kinematics and dynamics
© The Authors 2025
 Open Access article, published by EDP Sciences, under the terms of the Creative Commons Attribution License (https://creativecommons.org/licenses/by/4.0), which permits unrestricted use, distribution, and reproduction in any medium, provided the original work is properly cited.
This article is published in open access under the Subscribe to Open model. Subscribe to A&A to support open access publication.
1. Introduction
The launch of the James Webb Space Telescope (JWST) has established a new era for observational astronomy, revolutionising our understanding of galaxy properties and assembly processes in the early Universe (redshift z ≥ 5.5, t ≤ 1 Gyr). Recent observations of galaxies at the epoch of reionisation have revealed for the first time their stellar population and age, providing key insights into the star formation process and star formation history (SFH) in pristine environments (Whitler et al. 2023; Chen et al. 2023; Endsley et al. 2023; Santini et al. 2023; Treu et al. 2023; Topping et al. 2024; Weibel et al. 2024). The combination of JWST's unmatched sensitivity and spectral coverage allow the rest-optical emission of galaxies at z > 4 to be traced for the first time, resolving the internal structure of primordial star forming systems. Moreover, the superb sensitivity of JWSTNIRSpec (Jakobsen et al. 2022) in the near-infrared (NIR) wavelength range allows for investigation into the distribution of the ionised gas in primordial galaxies, providing new insights into the interstellar medium (ISM) properties at high-redshift, such as the electron density and gas-phase metallicity (Taylor et al. 2022; Schaerer et al. 2022; Rhoads et al. 2023; Isobe et al. 2023; Curti et al. 2023, 2025; Abdurro’uf et al. 2024; Sarkar et al. 2025; Marconcini et al. 2024, Cresci et al. in prep.).
Simulations and theoretical models predict that powerful sources of ionising photons are crucial to define the physical conditions during the reionisation era (z ∼ 6–10), i.e. when most of the hydrogen in the Universe transitioned from the neutral to the ionised phase, which was driven by energetic UV photons (Lyman continuum or LyC photons, with wavelengths shorter than 912 Å) (Partridge & Peebles 1967; Ciardi et al. 2003; Fan et al. 2006; Stark 2016; Ma et al. 2020; Maji et al. 2022). Due to the intervening intergalactic medium (IGM), it is challenging to directly trace LyC photons at high redshift, and thus a valid alternative is to study Lyα emitter galaxies, as their properties are fundamental to gaining insight to the reionisation of intergalactic hydrogen (Blanc et al. 2011; Robertson et al. 2013; Dijkstra et al. 2016; Goovaerts et al. 2024). In particular, the escape fraction of Lyα photons has been observed to correlate with the escape fraction of the energetic LyC photons (Dijkstra et al. 2016; Xu et al. 2022; Izotov et al. 2022; Yuan et al. 2024), thus making Lyα emitters the optimal candidates to comprehend the process of cosmic reionisation. Recent JWST observations have played a major role in investigating the physical properties of Lyα emitters during the epoch of reionisation, providing stringent constraints on the ionising photon production, the gas-phase metallicity, and the fraction of escaping Lyα photons (Tang et al. 2023; Bunker et al. 2023; Jones et al. 2024; Kumari et al. 2024; Saxena et al. 2024; Muñoz et al. 2024).
The goal of this paper is to study the gas and stellar population properties in the merger system of COSMOS Redshift 7 (CR7; z = 6.60425). This source was first identified by Matthee et al. (2015) using the Suprime-Cam on the Subaru telescope to inspect a region of the COSMOS/UltraVISTA field and detect bright Lyα emitters in the reionisation era. Sobral et al. (2015) performed follow-up spectroscopic observations with X-shooter, SINFONI, and FORS2 at the VLT and DEIMOS at Keck and confirmed CR7 as one of the most luminous Lyα emitters at z ≥6 (LLyα ∼ 1044 erg s−1). Moreover, Sobral et al. (2015) disfavoured the presence of an active galactic nucleus (AGN) or Wolf-Rayet (WR) stars, as they only detected a narrow He IIλ1640 emission line and no metal lines in their X-shooter spectrum covering wavelengths from the UV to the NIR. Instead, they proposed a combination of a PopIII-like stellar population (107 M⊙) and an older metal-enriched stellar population (1010 M⊙, 0.2 Z⊙) to explain the mass of the system. Visbal et al. (2016) further investigated this scenario, exploring the formation of a massive PopIII cluster through photoionisation feedback. They concluded that pristine gas collapsing onto the host halo could potentially explain the high PopIII stellar masses in CR7 that would be the result of a massive PopIII starburst. On the other hand, Bowler et al. (2017) used Spitzer photometry in IRAC ch1 and ch2 to provide observational constraints on the [O III]λ5007 line strengths, discarding the presence of PopIII stars in favour of a narrow-line low-mass AGN or a young metal-poor starburst.
Further, Lyα focused works have discussed the possibility that the Lyα luminosity in CR7 might be explained by a direct collapse black hole (DCBH) accreting pristine gas (Pallottini et al. 2015; Sobral et al. 2015; Dijkstra et al. 2016; Hartwig et al. 2016; Agarwal et al. 2016, 2017). In particular, Pacucci et al. (2017) performed radiation-hydrodynamic simulations and found that a 7 × 10⁶ M⊙ BH accreting metal-free or low-metallicity gas (5 × 10⁻³ Z⊙) is consistent with the DCBH hypothesis and could explain the IR photometry of CR7. Matthee et al. (2017a) constrained the rest-frame IR continuum of CR7 with band 6 ALMA observations showing the presence of at least four [C II]λ158μm satellites, compared to the three observed in the UV (Matthee et al. 2015). They showed that the two brightest satellites are observed in both [C II]λ158μm and UV emission. The other smaller satellites detected only in [C II]λ158μm emission are observed in the surroundings of the two least massive companions. In this work, the three main UV-bright companions are labelled as CR7-A, CR7-B, and CR7-C, following the nomenclature of previous works and as shown in Fig. 1. From the dynamical mass measurements, Matthee et al. (2017a) found Mdyn(CR7-A) = 3.9 ± 1.7 × 10¹⁰ M⊙ and estimated CR7-A to be the most massive and therefore the main or central galaxy of the halo, with indications of a potential ongoing major merger with CR7-C. They used the ALMA observations to constrain the star formation rate (SFR) in each component and found values of 28, 5, and 7 M⊙ yr−1 for CR7-A, CR7-B, and CR7-C, respectively. Overall, Matthee et al. (2017a) found gas metallicities for CR7-A of Z ∼ 0.1 – 0.2 Z⊙ (i.e. 12 + log(O/H) ∼ 7.7 – 8.0), which is entirely inconsistent with the PopIII-like stellar population scenario. Similarly, Dors et al. (2018) found Z ∼ 0.1 – 0.5 Z⊙ when fitting UV emission lines with photoionisation models. Finally, Sobral et al. (2019) re-analysed SINFONI data and provided a new lower ∼2 σ detection of the He IIλ1640 emission line. They concluded that CR7-A, B, and C are all consistent with a young starbursts scenario and a low gas-phase metallicity, in agreement with previous works (Matthee et al. 2017a; Dors et al. 2018). Moreover, they argue that based on the current data availability, there is no evidence for the presence of an AGN in any of the satellites of the system, with only tentative evidence of CR7-C having a higher ionisation parameter and potentially hosting an AGN. This scenario is supported by a comparison of UV emission lines with photoionisation models, which tend to attribute a non-thermal nature to the central source of CR7-C, and thus points towards the AGN activity (Dors et al. 2018).
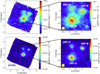 |
Fig. 1. JWSTNIRSpec images from collapsed [O III]λ5007 emission in the high-resolution G395H (top) and low-resolution prism (bottom) data cubes. Sub-cubes with the selected and labelled clumps are shown on the right. The yellow circle is the fiducial point spread function of ∼0.15″. Magenta contours represent the selected regions for the integrated analysis of the three main satellites described in Sect. 3.2. North is up and east to the left. |
Matthee et al. (2020) analysed spatially resolved Lyα observations with VLT/MUSE and reported a total Lyα luminosity fainter by a factor of 1.5 with respect to previous works (Sobral et al. 2015). They observed a ∼1 kpc offset between the Lyα and UV peak over CR7-A, with the former being elongated towards CR7-B. Moreover, they explained the observed Lyα equivalent width (EW) with a metal-poor starburst only without needing to include high-ionisation sources. Finally, by spatially resolving the Lyα morphology, they confirmed that the main contribution to the total emission originates from CR7-A, and they reported the elongated nature of the Lyα halo might indicate the presence of multiple star-forming regions consistent with the presence of three UV clumps and possibly multiple sub-clumps (e.g. Matthee et al. 2017a).
While CR7 has been extensively studied with both ground- and space-based instruments targeting the rest-UV and far-IR bands, JWST/NIRSpec is the first instrument capable of measuring the rest-frame optical spectrum of this intriguing source. Thus, it is the first instrument that may be able to shed light on the system's nature and provide insights on galaxy assembly processes via mergers at high redshift.
In this work, we present spatially resolved high-resolution (R ∼ 2700) and low-resolution (R ∼ 100) NIRSpec/IFS observations of CR7, providing, for the first time, spatially resolved rest-frame optical spectroscopy of this intriguing system. This paper is organised as follows. In Sect. 2 we present the NIRSpec observations together with the data reduction. In Sect. 3 we discuss the emission line analysis of the G395H and prism data cubes, the emission line fitting method, and the following results via line ratio analysis and spatially resolved kinematics. Then, in Sect. 4 we discuss the implications of our results in the broad context of galaxy assembly processes. Finally, in Sect. 5 we summarise the main results, comparing our findings with previous works. In this paper, we assume the Planck Collaboration VI (2020) cosmology, i.e. a flat ΛCDM cosmology with H0 = 67.4 km s−1 Mpc−1, Ωm = 0.315, and ΩΛ = 0.685.
2. Observations and data reduction
2.1. NIRSpec observations
CR7 (CR7-COS-6.60-L, RA 10h 00m 58.005s Dec. +01° 48′15.25″, J2000) was observed as part of the Galaxy Assembly with NIRSpec Integral Field Spectroscopy (GA-NIFS1) Guaranteed Time Observations (GTO) programme, included in proposal #1217 (PI: N. Luetzgendorf). The observations were carried out on May 2 2023 with the NIRSpec IFU (field of view, FOV: 3.1″× 3.2″, spaxel size: 0.1″; Böker et al. 2022; Rigby et al. 2023). The observations include both high-(R ∼ 2700) and low-(R ∼ 100) resolution configurations with the G395H grating and the PRISM, respectively, with a 0.5″ size cycling pattern of eight dithers, covering a total effective FOV of about 3.7″×3.7″. The total integration times were 18207 seconds (5h) for G395H and 3968 seconds (1.1 h) for the PRISM configuration.
We used the [O III]λ5007 and Hβ integrated emission line profiles over the aperture of CR7-A to estimate the redshift, assuming CR7-A to be the main galaxy of the system. In the following, we adopt z = 6.60425 ± 0.00002 as the systemic redshift of the system, thus defining the zero velocity of the gas kinematics.
2.2. Data reduction
We performed the data reduction using the JWST calibration pipeline version 1.8.2 with CRDS context jwst1068.pmap. The steps and changes we performed with respect to the standard pipeline in order to improve the final data quality are discussed in Perna et al. (2023). To combine each integration and create the final data cube with spaxel size of 0.05″, we adopted the drizzle method, using an official patch to account for a known issue affecting the calibration pipeline2. For the high-resolution data, we did not perform a background subtraction since it is already accounted for during the emission line fitting. For the low-resolution PRISM cube, we performed a background subtraction using selected regions away from the three main clumps.
3. Analysis and results
3.1. High-resolution data: Emission line fitting
The G395H high-resolution data cube was analysed by means of a set of custom Python scripts in order to subtract the continuum emission and then fit the observed emission lines. As a first step, we performed a Voronoi tessellation binning (Cappellari & Copin 2003) on the continuum level between 3800 and 6900 Å rest-frame, requiring a minimum signal-to-noise ratio (S/N) in each spectral channel of 3. Spaxels with S/N ≥ 3 are not binned. Then we used the Penalized Pixel-Fitting (PPXF) software (Cappellari & Emsellem 2004; Cappellari 2023) to fit the continuum in each bin. We used single-stellar population templates from the stellar-population synthesis tool FSPS (Conroy et al. 2009; Conroy & Gunn 2010), combining them with a third order multiplicative polynomial. While fitting the continuum, we simultaneously fitted the emission lines with one or two Gaussian components to account for possible absorptions underlying the emission lines. The criteria adopted to decide the Gaussian components, as well as other fitting details, are described in the following. Bad pixels, as well as the detector gap are masked during this step in order to maximise the fit quality. Then, we selected and subtracted the continuum in each bin from the corresponding flux of each spaxel and obtained a continuum-subtracted data cube, which we used to infer the gas properties via a detailed multi-Gaussian emission line fitting. We performed a spatial smoothing to match the spatial resolution within the FOV by convolving each spectral slice of the data cube with a σ = 1 spaxel (i.e. 0.05″) Gaussian kernel. To extract the emission-line properties we fit the emission lines of the continuum-subtracted data cube with up to two Gaussians, tying the velocity and the velocity dispersion of each Gaussian component among all the emission lines. After a detailed inspection of the high-resolution data cube in each spaxel we imposed reasonable boundaries on the Gaussian components, in order to reproduce the observed asymmetric line profiles. As an example, Fig. 2 shows a three colour emission line image of CR7, highlighting the difference in systemic velocity between the three main components and the presence of a main satellite (hereafter, CR7-D). In particular, the CR7-D satellite shows a narrow [O III]λλ4959,5007 emission line doublet and a 3σ upper limit on the non-detection of Hα and Hβ of 8 × 10⁻²⁰ erg s−1 cm−2 and 2 × 10⁻²⁰ erg s−1 cm−2, respectively, extracted from a circular region with radius equal to half the FWHM of the point spread function. Overall, the [O III]λ5007 line profile across the FOV shows a narrow component in each spaxel with a broad component over CR7-A and a blueshifted narrow wing in the south-west region of CR7-C. To account for these features we adopted up to two Gaussian components, with tailored boundaries on the velocity and velocity dispersion of each component. In particular, the first component is used to model the brightest, narrowest and closest to systemic velocity emission line profile (labelled as narrow component). The second component is used to reproduce the possible broad line profile or line wing (labelled as broad component). A detailed discussion of different kinematic components is presented in Sect. 3.3.2.
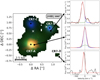 |
Fig. 2. Three-colour emission line image of CR7 derived from the G395H data cube. The emission line maps are obtained by integrating the continuum-subtracted data-cube around the [O III]λ5007 emission line in the velocity ranges v ≤ – 150 km s−1 (blue), – 150 km s−1 ≤ v ≤ 150 km s−1 (green) and v ≥ 150 km s−1 (red), with respect to the systemic redshift z = 6.60425 (see Sect. 3.3). The black stars mark the positions of the three main components shown in Fig. 1. White crosses mark the positions of the two brightest additional [C II]λ158μm components detected by Matthee et al. (2017a). The right panels show the normalised [O III]λ5007 line profile (black), with the best-fit multi-Gaussian fit (red) composed of the narrow (blue) and broad (green) components, extracted from circular apertures of 0.1 ″ in radius. |
The intensities for all the components are free to vary. We accounted for the [O III]λλ4959,5007 emission line doublet by fixing the flux ratio to 1/3 between the two lines, given by the Einstein coefficients of the two transitions (Osterbrock & Ferland 2006). We decided the optimal number of Gaussian components to be used in each spaxel based on the results of a Kolgomorov-Smirnov test (see Marasco et al. 2020, for details). In particular, we compared the residuals of the fit with a different number of Gaussians in the wavelength range between 4980 and 5040 Å rest-frame, in order to optimise the fit result for the asymmetric [O III]λ5007 emission line. If the residuals of the n-component Gaussian fit statistically improve the fit with respect to the one-component Gaussian fit then we adopt n Gaussians to build the final best-fit model. This procedure gives the minimum and optimal number of Gaussian components to be used to reproduce the observed emission line profile. As a result, we obtain a two-dimensional map with the optimal number of Gaussian components to be used in each spaxel, highlighting structured regions that benefit from multiple components (up to 2) to reproduce the asymmetric or broad line profile, ultimately providing insightful information on the intrinsic gas kinematics. The final result is an emission-line-only model cube centred around each emission line.
The top panels in Fig. 1 show images of the total and selected sub-region of the G395H data cube obtained collapsing over the total [O III]λ5007 emission. The bottom panels show the same [O III]λ5007 emission extracted from the prism data cube. The left and right panels in Fig. 3 show the integrated spectra of the high- and low-resolution (background subtracted) spectra extracted from the three apertures shown in Fig. 1, corresponding to CR7-A, CR7-B, and CR7-C. As shown by the integrated low-resolution spectra in Fig. 3 we significantly detect the Lyα emission line only in CR7-A, with no evidence in CR7-B and CR7-C, which instead show evidence of damped Lyα absorption. We discuss this feature further in Sect. 3.5. In this work, we focused on a ‘subcube’ centred on the main galaxy and shown in the right panels of Fig. 1, since no additional source is detected outside of the FOV of the selected subcube. Finally, in the high-resolution data cube we fitted the following emission lines: Hα, Hβ, Hγ, Hδ, Hϵ, Hζ, He Iλ3889, He Iλ5876, [Ne III]λ3869, [Ne III]λ3967, [O III]λ4363, [O III]λ4959, and [O III]λ5007. Table 1 shows the integrated fluxes from the apertures shown in Fig. 1 for the detected emission lines in the CR7 system.
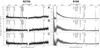 |
Fig. 3. JWST/NIRSpec G395H (left) and prism (right) integrated spectra from CR7-A, CR7-B, and CR7-C, from top to bottom panels, respectively. The high-resolution spectra cover the wavelength range from 2.7 to 5.27 μm. The low-resolution background-subtracted spectra show a prominent Lyα emission line in CR7-A. |
Integrated emission line fluxes for CR7-A, CR7-B, and CR7-C.
3.2. Dust attenuation
To estimate the dust attenuation we used the Hα/Hβ line ratio and assumed a Calzetti extinction law (Calzetti et al. 2000) to measure AV and to correct the observed fluxes of each line for dust attenuation3. We performed an unresolved analysis for the dust attenuation by integrating the spectra from the apertures over the three components, where both Hα and Hβ have an S/N greater than five. We estimated a nebular attenuation of AV = 0.18 ± 0.08, 0.04 ± 0.02, 0.07 ± 0.03 for CR7-A, CR7-B, and CR7-C, respectively. Such low values for AV are consistent with the estimates from the same NIRSpec data by Kiyota et al. (2025), and with the previous upper limits for the IR continuum derived from deep ALMA observations. Indeed, Matthee et al. (2017a) estimated dust masses ≤8 × 10⁶ M⊙ based on the far-IR continuum, which, assuming dust is enclosed within the radius of the CR7 system (∼ 3 kpc) and a dust opacity κ = 103 cm2 g−1, provides an attenuation of AV ∼ 0.07. In the following analysis, line ratios are corrected for dust attenuation if not specified otherwise.
3.3. Gas kinematics
As a result of the spaxel-by-spaxel fit described in the previous section, we obtained the one-, or two-Gaussian best-fit model for each line in each spaxel and a model cube for each emission line. From this, we can create spatially resolved moment maps and velocity channel maps for any detected emission line, which provide precious hints on the projected gas kinematics.
3.3.1. Ionised gas moment maps
Figure 4 shows the integrated emission line flux (moment 0), the flux-weighted line-of-sight (LOS) velocity (moment 1) and the flux-weighted velocity dispersion (moment 2) maps for the total best-fit [O III]λ5007 emission line model.
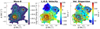 |
Fig. 4. Moment maps of [O III]λ5007 from G395H data. From left to right, the integrated emission line flux in logarithmic scale, the flux-weighted LOS velocity, and the velocity dispersion maps are shown. All moment maps are calculated from the total best-fit model. Contours highlight the blueshifted emission v ≤ – 150 km s−1 (magenta), – 150 km s−1 ≤ v ≤ 150 km s−1 (black), and redshifted v ≥ 150 km s−1 (red), with respect to the systemic velocity of CR7-A defined by the redshift z = 6.60425 (see Sect. 3.3). Moment maps are masked when the S/N is less than five. The black stars mark the positions of the three main components and are labelled in the left panel for clarity. North is up, east to the left. |
The moment maps clearly highlight the clumpy morphology of the system, with the [O III]λ5007 emission peaking at the three well-known UV-bright components (Matthee et al. 2015, 2017b,a; Sobral et al. 2015). From the profile of integrated [O III]λ5007 emission line (Fig. 3) we measure redshifts of z = 6.60425, z = 6.60115, z = 6.59948, for CR7-A, CR7-B, and CR7-C, respectively. Therefore, assuming the redshift of CR7-A as a reference, CR7-B and CR7-C are blueshifted by about –100 and –200 km s−1 with respect to the main galaxy, respectively. The integrated emission line flux map in Fig. 4 clearly shows the presence of extended ionised emission between CR7-A and CR7-C with average relative projected velocity of 100 km s−1, suggesting a possible interaction among these two components. In addition, extended redshifted emission is also detected from CR7-A towards south-west. Interestingly, the ionised gas morphology shown in Fig. 4 shows fainter diffused ionised emission between CR7-A and CR7-B than between CR7-A and CR7-C.
Different velocity contours are superimposed in Fig. 4 on the [O III]λ5007 moment maps. Red contours represent arbitrary levels of the ionised emission at velocities ≥200 km s−1. Magenta and black contours represent arbitrary levels of the flux at velocities ≤–200 km s−1 and –200 km s−1 ≤ v ≤ –200 km s−1, respectively. Moreover, magenta contours also show blueshifted emission slightly offset from the position of the centres of CR7-A and CR7-B, which likely indicates the presence of outflows from the central source or tidal features. Interestingly, we observe low velocity dispersion corresponding to the location of CR7-D (σ ∼ 40 km s−1), similarly to the three main components. Finally, red contours in Fig. 4 also show elongated emission from the centre of CR7-A towards the south and east, with an almost conical morphology. The detection of one satellite (CR7-D) with a clear peak of ionised emission at ∼6.8 kpc from CR7-A, and no detection of Hα or Hβ emission, points towards the presence of at least one smaller component in CR7, similar to the findings of Matthee et al. (2017a) from [C II]λ158μm.
From the spatially resolved [O III]λ5007 emission-line fit we measured an average velocity dispersion4 of CR7-A of 124 ± 17 km s−1. To calculate a reference dynamical mass, we assumed the structure of CR7-A to be consistent with a disc and used the stellar virial estimator of van der Wel et al. (2022), using our velocity dispersion and effective radius of 920 ± 60 pc5. Then, assuming a Sérsic index of 1 and an axis ratio of 0.5, we obtained a dynamical mass of Mdyn = 2.4 × 10¹⁰M⊙, which is consistent with the previous [C II] based estimate of 3.9 ± 1.7 × 10¹⁰ M⊙ from Matthee et al. (2017a). Nevertheless, to compute the dynamical mass of CR7-A we rely on highly uncertain estimates and assume the morphology of CR7-A to be consistent with a disc, for which there is no convincing evidence. Therefore, the value provided here for the dynamical mass has to be considered as order of magnitude estimate. Nevertheless, when using similar assumptions, the [O III]λ5007 and [C II]λ158μm dynamical mass estimates agree very well, showing no evidence of a bias between these two tracers. As anticipated in the previous section, to further investigate the nature of such extended emissions and the possibly detached smaller component, we adopted tailored criteria to discriminate between different kinematic structures, as discussed in the next section.
3.3.2. Narrow and broad components
Employing the multi-Gaussians fit described in Section 3.1 we were able to reproduce the complex emission line profile in each spaxel. In particular, depending on the location within the system, we observed up to two different kinematic components. First, we observed a narrow emission line profile (most commonly found for CR7-C) with no evident asymmetries or broad wings which we attribute to systemic emission from the galaxy. Then, we observed a combination of narrow and broad components around CR7-A, with the two components having similar low projected velocities but different line widths. To reproduce such profiles we adopted narrow + broad Gaussian components. Finally, mostly towards the south of CR7-B, we observed a combination of a bright, narrow component and a low-velocity dispersion blueshifted component (see top right panel in Fig. 2. As discussed in Sect. 3.1, we refer to the narrow systemic component as narrow, and to the high-velocity dispersion in CR7-A or the blueshifted low-velocity dispersion component in CR7-B, as broad. Fig. 5 shows the three moments maps for the narrow (top), and broad (bottom) components. The separation of the observed line profiles into distinct kinematic components allowed us to better investigate the observed complex ionised gas features. In particular, the narrow component traces gas with low projected velocity and velocity dispersion (see Sect. 3.3 for details). Indeed, the narrow component maps represent the systemic emission emerging from each component of CR7, with the kinematic maps showing no evidence of disturbed motions and highlighting the CR7-D satellite towards south-west.
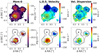 |
Fig. 5. Moment maps of the ionised gas in CR7 traced by the [O III]λ5007 emission line for two disentangled kinematic components. From left to right, the integrated emission, the line of sight velocity, and velocity dispersion maps are shown. From top to bottom, moments maps for the narrow and broad components are shown (see Sect. 3.3 for the method used to discriminate between different components). The first order momentum is computed with respect to z = 6.60425. A S/N cut of five on the flux of each component was applied to the maps of the narrow and broad components. The black stars mark the positions of the three main components of CR7. Dashed black contours are arbitrary [O III]λ5007 flux levels. The moment maps are not corrected for dust attenuation. |
For CR7-A, the main source, the narrow component velocity map shows a tenuous north-south gradient, with amplitude of ∼20 km s−1, suggestive of a system observed close to face-on, under the assumption of a rotating disc. Interestingly, in CR7-A the velocity dispersion is larger along the axis of maximum velocity variation (instead of orthogonally, as expected from beam smearing of a rotating disc). The broad component maps show a peak of emission slightly shifted towards the north-west from the peak of the narrow component, with an elongated structure directed NW-SE, possibly indicating merger or outflow activity. The broad component LOS velocity map shows an almost constant projected velocity over CR7-A with amplitude of 25 ± 10 km s−1. Interestingly, the velocity dispersion map of the broad component shows the maximum values over the peak flux emission, with an average velocity dispersion of σ≥175±25 km s−1.
The narrow moment map shows a blueshifted peak of emission over CR7-B (with respect to the zero velocity assumed from integrated [O III]λ5007 line profile over CR7-A). The velocity dispersion of the narrow component shows an average constant line broadening with velocity dispersion of 70 ± 5 km s−1. Additionally, we found that to fit the line profile southwards of CR7-B we need to include a second, blueshifted component, as shown in bottom panels in Fig. 5. Overall, this region southwards of CR7-B appears to have high velocity dispersion as traced by the broad component. This region also appears to be co-spatial with the asymmetric blueshifted contours shown in Fig. 4, which extends southwards of CR7-B, and with the enhanced [O III]λ5007/Hβ ratio shown in Fig. 7, suggesting the presence of an unresolved high-ionisation source and outflow/merger scenario.
Finally, we observed that the centre of CR7-C shows a narrow profile with blueshifted velocity of ∼200 km s−1 with respect to the systemic velocity assumed. Interestingly, we observed that no additional Gaussian component is needed to reproduce the observed line profile. Moreover, the extended blueshifted ionised emission, traced by the magenta contours in Fig. 4, is well reproduced by a single Gaussian component, which shows peaks of velocity dispersion between CR7-A and CR7-C of 110 km s−1 (see top panel in Fig. 5).
Overall, from the ionised gas kinematics we find that at least one additional sub-component exists in CR7 (i.e. CR7-D), as traced by a narrow line profile in [O III]λ5007 (Figs. 2 and 5) and as already suggested by previous works (Matthee et al. 2017a). Unfortunately, the S/N of the ionised emission connecting CR7-A and CR7-D, as traced by the [O III]λ5007 emission line, is less than three, thus preventing us from confirming an interaction between these components. The broad components reasonably trace outflowing or tidal features, mostly from CR7-A towards the north-west and south and from CR7-B southwards (see bottom panels in Fig. 5).
3.4. Excitation diagnostics and line ratios
In this section we used the results of the emission line fitting of the high-resolution data cube performed in Sect. 3.1 to investigate the main line ratios and examine the excitation source in CR7.
Recent works highlighted the difficulty in distinguishing between SF and AGN ionisation at high-z (Feltre et al. 2016; Nakajima & Maiolino 2022; Kocevski et al. 2023; Übler et al. 2023; Scholtz et al. 2025; Maiolino et al. 2024), employing the standard BPT diagram (Baldwin et al. 1981). Indeed, we do not detect [N II]λ6584 in any of the galaxies in the CR7 system, while [O III]λ5007/Hβ generally higher than 5 (Fig. 7) means that the BPT is inconclusive.
Therefore, we explored the possible source of ionisation in CR7 by employing new diagnostic diagrams. Specifically, we adopt the diagnostic diagram from Mazzolari et al. (2024), which leverage the [O III]λ4363 auroral line (when detected) and which is particularly well suited to identify narrow line TypeII AGN at high redshift. Indeed, recent works exploiting JWST/NIRSpec observations of high-z systems first showed that an enhancement of the [O III]λ4363 emission line might be indicative of the presence of an AGN (Brinchmann 2023; Übler et al. 2024) The high-energy ionising photons produced by AGN are capable of heating the gas to higher temperatures with respect to photons produced by SF regions. Therefore, due to its high sensitivity to the ionised gas temperature, the [O III]λ4363 emission line represent an optimal tracer of the ionising source.
We computed the following line ratios in all the spaxels with S/N > 5:
![$$ {\rm O33 = {[O\,{\small{\text{III}}}]\lambda 5007}/ {[O\,{\small{\text{III}}}]\lambda 4363}} $$](/articles/aa/full_html/2025/07/aa52994-24/aa52994-24-eq2.gif)
![$$ {\rm O3\gamma = {[O\,{\small{\text{III}}}]4363} / {\mathrm {H\gamma }}} $$](/articles/aa/full_html/2025/07/aa52994-24/aa52994-24-eq3.gif)
![$$ {\rm R3 = {[O\,{\small{\text{III}}}]\lambda 5007} / {\mathrm {H\beta }}. } $$](/articles/aa/full_html/2025/07/aa52994-24/aa52994-24-eq4.gif)
We adopted the O3γ versus O33 diagram from Mazzolari et al. (2024) correcting the intensity of the emission lines for dust attenuation (see Sect. 3.2). Fig. 6 shows the diagnostic diagram, together with a map of the most likely excitation source in CR7. In this diagram, lying above the demarcation line is a sufficient but not necessary condition for an object to be identified as an AGN, and therefore spaxels that are below the demarcation line can still be associated with AGN excitation. We observe that CR7-B and CR7-C lie in the region associated to SF or AGN ionisation. On the other hand, CR7-A shows two regions where the AGN ionisation is likely dominant, with respect to SF ionisation. Nevertheless, we observe that the spaxels associated to AGN ionisation in CR7-A are distributed towards the outskirts of CR7-A and thus have a lower S/N (S/N ∼ 3–5) compared to the central region. Additionally, due to the large uncertainties on the line ratios we cannot provide a secure determination of the main source of ionisation in these two regions. Overall, as shown in Fig. 6, all the points lie preferentially below the demarcation line, thus indicating that the most likely source of ionisation cannot be conclusively stated as either AGN or SF in any of the three components of CR7.
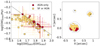 |
Fig. 6. Left: Diagnostic diagram based on Mazzolari et al. (2024) for the excitation source in CR7 based on the [O III]λ4363/Hγ versus [O III]λ5007/[O III]λ4363 line ratio. The dashed black line is the discriminator between AGN or SF excitation source, respectively. Right: Spatially resolved map of CR7 with spaxels colour-coded based on their position on the diagram on the left. For visualisation, we report error-bars only for half of the points. Black solid lines show arbitrary [O III]λ5007 flux levels. Spaxels with S/N ≤ 3 are masked. Emission lines have been corrected for dust attenuation. |
To trace regions of high ionisation we also computed the R3 line ratio map shown in Fig. 7. Due to the difference in ionisation potential of [O III]λ5007 and Hβ, this ratio is a fairly good indicator of the strength of radiation field, with peaks associated to burst of SF or AGN. Interestingly, Fig. 7 shows a peak of the ratio on CR7-B towards the south, which corresponds to the location where Sobral et al. (2019) detected He IIλ1640 emission at 2σ, possibly indicating the presence of an AGN (see also Sobral et al. 2015). Additionally, as also shown in Fig. 4, the southern region of CR7-B shows enhanced velocity dispersion in the broad component and blueshifted extended ionised emission which in Sect. 3.3 we attributed to the hypothetical presence of an outflow (see also Fig. 5). Overall, such region could be ionised by the presence of an AGN, and thus points towards the presence on an AGN-driven outflow, consistent with previous works (Sobral et al. 2019). Similarly to the result inferred from Fig. 6 for CR7-A, and consistently with the findings of Kiyota et al. (2025), we observe an enhancement of the line ratio towards the south with peaks of log(R3) ∼ 1 at S/N ≥ 5, suggesting the presence of gas ionised by an AGN. Finally, CR7-C shows low values of R3, consistent with SF ionisation.
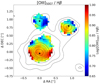 |
Fig. 7. [O III]λ5007/Hβ emission line ratio in CR7 in logarithmic scale. Black solid lines are arbitrary [O III]λ5007 flux levels. Spaxels with S/N ≤ 5 are masked. Emission lines have been corrected for dust attenuation. Black contours are arbitrary [O III]λ5007 flux levels. |
3.5. Low-resolution data: Emission line fitting
To analyse the low-resolution data cube we adopted the same methodology described in Sect. 3.1, with a few modifications. In particular, we performed the Voronoi binning on the continuum level between 1100 and 6900 Å rest-frame, requiring a minimum S/N in each spectral channel of three. Then, to account for the continuum shape of the prism spectrum we used PPXF, simultaneously fitting multiple templates. The best fit is obtained with a linear combination of stellar templates, single Gaussians templates to account for emission line features, and a separate single Gaussian template for the Lyα emission line. To reproduce the observed steep continuum shape (see Fig. 3) we used as input in PPXF the simple stellar population spectra from the stellar-population synthesis tool FSPS (Conroy et al. 2009; Conroy & Gunn 2010), covering the total observed spectral range. We used MIST isochrones (Choi et al. 2016) and MILES stellar library with fixed solar abundances (Sánchez-Blázquez et al. 2006; Falcón-Barroso et al. 2011). Then, we included a third order additive polynomial and a sixth order multiplicative polynomial to adjust the continuum shape of the stellar templates to the observed spectra. These polynomials are necessary to fully capture the continuum shape (e.g. Bezanson et al. 2018), but we do not physically interpret the resulting continuum fits. Then, similarly to the routine described in Sect. 3.1, we subtracted the best-fit continuum from the observed spectrum in each spaxel and proceed to fit the emission lines. Due to the low spectral resolution of the prism data we only adopted a single Gaussian component to reproduce the emission line features. Finally, due to the asymmetric profile of Lyα we performed the fit of this emission line with a combination of two Gaussians. Fig. 8 shows the integrated spectrum extracted from CR7-A between 1100–1800 Å rest-frame, with the best-fit continuum and multi-Gaussian model. The continuum subtraction highlighted the presence of multiple high-ionisation emission lines, most of them detected at the level of only 2 σ. We measured a total Lyα integrated flux of 6.4 ± 0.8 × 10⁻¹⁷ erg s−1 cm−2, which is smaller by a factor of ∼1.6 compared to MUSE observations (Matthee et al. 2020). We remark that the flux of O Iλ1302 and C IVλλ1548,1551 is degenerate with the underlying stellar absorption at the same wavelength. In this work we found no evidence for He IIλ1640 with high equivalent width in any of the satellites. In particular, we estimated an upper limit on the non-detection in CR7-A of ≤0.3 × 10⁻¹⁸ erg s−1 cm−2, which is consistent with the upper limit of ≤0.27 × 10⁻¹⁸ erg s−1 cm−2 provided by Sobral et al. (2019). On the other hand, Sobral et al. (2019) also reported a 2σ detection of He IIλ1640 over CR7-C with an integrated flux of 0.11 ±0.5 × 10⁻¹⁸ erg s−1 cm−2, which is in contrast with our non-detection. For completeness, from the integrated spectrum of CR7-C we estimated a 3σ upper limit on the non-detection of ≤0.1 × 10⁻¹⁸ erg s−1 cm−2, which is consistent with the value estimated by Sobral et al. (2019).
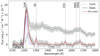 |
Fig. 8. Fit of the integrated R100 spectrum of CR7-A extracted from the aperture shown in Fig. 1 and focused on the wavelength range between 1100–1800 Å rest-frame. Data before and after continuum subtraction are in grey and solid black, respectively. Single Gaussians used to fit the Lyα emission line are in dashed blue and purple. Best-fit continuum and emission line models are in green and red, respectively. (For details of the spectrum fit see Sect. 3.6.) |
3.6. Low-resolution data: Continuum fitting
In this section we describe the methodology we adopted to fit the continuum emission in CR7, to finally provide spatially resolved stellar population properties. We follow the methodology developed in Marconcini et al. (2024). We performed the continuum fitting of the low-resolution data cube in three different manners, i.e. spaxel by spaxel, by fitting the total integrated spectrum and fitting the spectra of CR7-A, CR7-B, and CR7-C, separately. To fit the spectrum we used PROSPECTOR (Johnson et al. 2021), a Bayesian spectral energy distribution (SED) modelling framework built around the stellar-population synthesis tool FSPS (Conroy et al. 2009; Conroy & Gunn 2010). We performed SED modelling of the observed spectrum from 0.6 to 5.27 μm following the procedure described in Tacchella et al. (2023) and Pérez-González et al. (2023). In order to fit the spectrum with PROSPECTOR we assumed a 2-d Gaussian kernel, with different full-width half-maximum values along and across slices, as a function of wavelength and performed a spatial smoothing, in order to obtain approximately the same point spread function at all wavelengths (D’Eugenio et al. 2024).
For the modelling, we configured FSPS to use the MILES stellar atmospheres (Falcón-Barroso et al. 2011) and MIST isochrones (Choi et al. 2016). The nebular emission is modelled using pre-computed grids from CLOUDY (Ferland et al. 1998), as described in Byler et al. (2017); this approach takes into account possible stellar absorption at the wavelength of emission lines (see e.g. Pérez-González et al. 2003, 2008). Finally, we accounted for dust attenuation using a flexible dust attenuation law, consisting of a modified Calzetti law (Calzetti et al. 2000) with a variable power-law index and UV-bump strength (Noll et al. 2009; Kriek & Conroy 2013). Stars younger than 10 Myr are further attenuated by an extra dust screen, parametrised as a simple power law (Charlot & Fall 2000). The SFH uses nine fixed time bins between z = 6.60425 and z = 20; the first three bins are at 10 Myr, 30 Myr, and 100 Myr, the remaining 6 bins are logarithmically spaced in time. We use a continuity prior to relate the log ratio of the SFRs between adjacent time bins (Leja et al. 2019). The model free parameters and their prior probability distributions for CR7-A, CR7-B, and CR7-C are listed in Table 2. Fig. 9 shows the spatially resolved stellar mass surface density ( ) estimated with this method, with a clear peak of stellar mass formed in CR7-A.
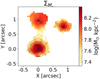 |
Fig. 9. Map of the stellar mass surface density derived with PROSPECTOR. The black crosses mark the positions of the three UV bright components of CR7. Black contours are arbitrary [O III]λ5007 flux levels. |
3.6.1. Stellar population properties
From the integrated spectrum of the entire CR7 system, we found a total stellar mass budget of  which is consistent with the value we obtain from modelling the spectrum in each spaxel and then adding up the resulting stellar masses (which gives log(M★/M⊙) = 9.44). From the integrated spectrum of each component, instead, we found
  ,
,  , and
, and  (see Tab. 2). The estimated stellar mass of CR7-A is consistent with a previous SED fitting estimate of
  based on broad-band photometry (Bowler et al. 2017) and lies within 2 σ from the recent results of Kiyota et al. (2025), who performed SED fitting based on NIRCam photometry.
From the SED fitting of the integrated spectrum we derived a SFR M⊙ yr−1 and SFR
 M⊙ yr−1, integrating the SFH of the past 10 and 100 Myr, respectively. Combining the result for the total stellar mass formed and the SFR, we computed the sSFR within the last 10 and 100 Myr. The resulting spatially resolved maps are shown in Fig. 10. From the integrated spectrum, instead, we derived a specific SFR (sSFR) of sSFR10 = 29
 Gyr−1 and sSFR100 = 4.91
  Gyr−1. The sSFR maps show extremely different values among the components of CR7, with a higher sSFR surrounding CR7-A and lower values in the satellites; this is consistent with the photometric SED fitting presented in Kiyota et al. (2025). This pattern is evident both in the sSFR10 and sSFR100 maps. Nonetheless, we observed higher sSFR over CR7-C integrating over the last 100 Myr, compared to the last 10 Myr only, indicating that most mass of CR7-C is formed more than 10 Myr ago.
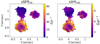 |
Fig. 10. Specific SFR within the past 10 Myr (Left) and 100 Myr (Right). Black contours are arbitrary [O III]λ5007 flux levels, as in Fig. 11. |
As a comparison with the SFR derived via SED fitting, we measured the Hα flux from the low-resolution data to provide a direct estimate of the SFR in CR7. We assumed a Case B recombination scenario (Osterbrock & Ferland 2006) and based on the measured Hα flux of 4.4 ± 0.2 × 10⁻¹⁷ erg s−1 cm−2, we computed the SFR following the relation proposed by (Murphy et al. 2011) as
Then, we derived the spatially resolved SFRHα density map (Σ(SFRHα)) as shown on the left panel of Fig. 11. On average, we found a log(SFRHα/M⊙ yr−1) = 1.5 ± 0.4. Similarly as for the Hα, we traced the SFR via Hβ emission and found log(SFRHβ/M⊙ yr−1) = 1.4 ± 0.5, which is consistent both with SFRHα and the SFR derived via SED fitting (see Table 2).
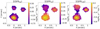 |
Fig. 11. CR7 properties derived from the emission line and SED fitting of the low-resolution data cube. From left to right, the surface SFR density derived from the Hα spatially resolved emission (see Eq. (3.6.1)) and the SFR within the past 10 Myr and 100 Myr derived with prospector are shown (see Sect. 3.6). Black contours are arbitrary [O III]λ5007 flux levels. |
Figure 12 shows the SFH and the fraction of stellar mass formed as a function of look-back time in CR7. The SFH of the integrated spectrum of CR7 shows that the SFR is slightly decreasing towards higher redshift. Interestingly, we noticed that the SFH of CR7-A and CR7-C anti-correlate at z ≥ 8, potentially indicating an interaction-driven star formation. Indeed, between look-back times of ∼200 and 150 Myr ago, the SFRs of CR7-A and CR7-C decrease and increase, respectively, following a mirrored trend. Such mirrored SF is consistent with predictions from simulations, which suggest that strong interactions among merging companions can lead to out-of-phase SF due to alternating gas inflows and feedback suppression effects (Hani et al. 2020; Renaud et al. 2022). Then, from ∼100 up to 10 Myr ago, their SFRs are consistent within the uncertainties. We interpret such a mirrored trend of the SFH of CR7-A and CR7-C in Fig. 12 as due to gas transfer among these two components. In particular, as already discussed in Sec. 3.3, we clearly observe a strong interaction between CR7-A and CR7-C due to elongated structures of ionised gas connecting them. Therefore, a scenario consistent with the observed SFH (Fig. 12) and with previous findings would be that gas is accreted from CR7-C onto CR7-A, boosting the SFR at early times. Conversely, due to the loss of gas the SFR in CR7-C is low. Such a scenario suggests a strong interaction between CR7-A and CR7-C at look-back times ≥200 Myr, followed by a less extreme interaction at recent times, as supported by the ionised gas kinematics and elongated morphology (see Fig. 4). The SFH of CR7-B instead has an approximately constant SFR throughout all its history. The fraction of the stellar mass formed shows an average identical trend for all the components of CR7. In particular, CR7-A already formed ≥80% of its total stellar mass more than 300 Myr ago, followed by a drastic decrease of star formation within the last ∼200 Myr. Overall, the total fraction of stellar mass formed shows a slightly increasing trend, up to z ∼ 9.3, where ∼25% of the total stellar mass of CR7 was already formed.
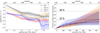 |
Fig. 12. Star formation history (left) and fraction of the stellar mass fraction formed per bin of time as a function of the look-back time (right) in CR7. The properties of the total spectrum of CR7, and for CR7-A, CR7-B, and CR7-C are shown in black, orange, red, and blue, respectively. Error bars represent the 84th and 16th percentiles. Horizontal black dashed lines in the right panel mark the level when 50 % and 25 % of the stellar mass was formed in CR7. |
3.6.2. The escape fraction of ionising photons
Ionising LyC photons can escape the galaxy through cavities of the ISM and ionise the neutral gas or be absorbed by dust. There is a strong connection between the escape fraction of such ionising photons and the Lyα flux. Here we estimate the fraction of escaping LyC photons in CR7 following the methodology described in Matthee et al. (2017c). Adopting the dust fraction (fdust) derived via SED fitting (see Sec. 3.6) and assuming case B recombination we can write the fraction of escaping LyC photons as
where α is a parameter that depends on the absorption of ionising photons, the average energy of ionising photons, and the Hα emission coefficient (for details see Matthee et al. 2017c). LHα and LLyα are the Hα and Lyα luminosities, respectively. In this work from low-resolution data fitting we estimated LHα = 2.31 ± 0.01 ×1043 erg s−1 and LLyα = 3.34 ± 0.04 ×1043 erg s−1, which is slightly lower than the LLyα estimated by previous MUSE observations (Matthee et al. 2020). The ratio of Hα/Lyα and the derived LyC escape fraction in each spaxel are shown in Fig. 13. In contrast to previous works (Matthee et al. 2020), we detect Lyα emission only surrounding CR7-A. We observe a north-south gradient of fesc, with values up to 6% towards the south in CR7-A, which has to be ascribed to a gradient in the ratio of Hα/Lyα. On average, we estimated a fraction of escaping LyC photons of fesc = 3.4 ± 0.9%. Fig. 13 shows a remarkable maximum of the escape of LyC photons towards the southern part of CR7-A, which is interestingly co-spatial to the region of enhanced [O III]λ5007/Hβ ratio (Fig. 7). We recall from Sec. 3.3.2 that the broad emission is elongated in the NE-SW direction with enhanced velocity dispersion directed north-south and was plausibly associated with an outflow, driven either by SF or an AGN, pushing the ambient gas towards the outskirts of CR7-A. Such spatial agreement could indicate a potential causal relationship between the outflow activity and the enhanced ionising photon escape. The observed correlation can be understood in the context of feedback mechanisms, where outflows are known to impact the ISM by injecting energy and momentum, creating low-density cavities within the ISM, and thus reducing the optical depth along these paths. This decrease in gas, and hence in the column density, might ease the escape of ionising photons within outflow regions. Such a mechanism is suggested both in theoretical models and simulations, where AGN-driven winds are expected not only to clear the gas content of the ISM but to propagate along the path of least resistance, allowing ionising radiation to escape more efficiently into the IGM (Murray et al. 2011; Hopkins et al. 2012). Additionally, the kinetic energy injected by the outflow into the ISM can evacuate the outflow cavity, further diminishing the covering fraction of dense material along the line of sight. As a consequence, the average column density of the gas decreases, thereby increasing the transparency of the ISM to ionising photons. Such an outcome is consistent with the scenario where AGN activity not only quenches star formation by heating and expelling gas but also contributes to the reionisation of the IGM by increasing the escape of ionising radiation (Costa et al. 2014; Gabor & Bournaud 2014).
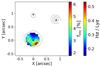 |
Fig. 13. Resolved map of ionising photon production. Different colour bars indicate the Hα/Lyα emission line ratio in logarithmic scale and the escape fraction of LyC ionising photons as derived from the Hα/Lyα ratio with the method outlined in Sect. 3.6.2. |
3.7. Gas metallicity
Investigating the gas metallicity in a merging system such as CR7 is crucial to comprehend how the distribution of metals results from the gas exchange among the components, which leads to bursts of SF and thus further metal enrichment. Unfortunately, we do not detect the [S II]λλ6716,6731 doublet neither in the high- or low-resolution data and the spectral coverage of the G395H data does not include the [O II]λλ3726,3729 doublet. As a consequence, we cannot estimate the electron density from observed emission lines ratios. Therefore, we assumed an average electron density of 400 cm−3 based on estimates from sources at similar redshift and on the observed electron density redshift evolution (Isobe et al. 2023; Abdurro’uf et al. 2024; Marconcini et al. 2024) and then used Pyneb to derive the collision strengths of oxygen ions with the default atomic dataset PYNEB_21_01. We computed the electron temperature of the [O III]-emitting regions (Te) from the [O III]λ5007/[O III]λ4363 line ratio measured from the high-resolution data. Then, we used Te to estimate the temperature of the [O II]-emitting regions (T2), using the relation T2 = –0.744 + Te × (2.338 – 0.610× Te) from Izotov et al. (2006). We found a spatially averaged temperature T2 = 1.37 ± 0.08 × 10⁴ K. Finally, we computed the abundances of the oxygen ions O2+ and O+ using the getIonAbundance routine of PYNEB and the flux ratio of [O III]λ5007/Hβ and ([O II]λ3726+[O II]λ3729)/Hβ, from the high- and low-resolution data, respectively. To estimate the gas-phase metallicity we neglected higher ionisation species of O and assumed that the oxygen abundance is representative of the total gas metallicity (for a detailed discussion on the underlying assumptions see Maiolino & Mannucci 2019).
Figure 14 shows spatially resolved maps of the [O III]-emitting regions electron temperature (left) and the gas-phase metallicity derived with the direct Te method (middle) and with prospector (right; the latter uses pre-computed photoionisation grids, see Sect. 3.6). The average electron temperature estimated from the integrated spectra of CR7-A and CR7-B are 1.6 and 0.9 × 10⁴ K, respectively. As shown on the right panel in Fig. 14, CR7-A has the lowest metal content in the entire system, with an average metallicity of 12 + log(O/H) = 8.0, i.e Z = 0.2 Z⊙, consistently with previous works (Matthee et al. 2017a; Dors et al. 2018). On the other hand, CR7-B and CR7-C have average metallicities from direct Te method of 8.08 and 8.26, respectively (see also Table 2). Due to the low S/N of the [O III]λ4363 emission line in CR7-C, we could not resolve its emission from the high-resolution data cube. Therefore, we computed the [O III]λ4363 integrated line profile and estimated an average direct-Te-method gas phase metallicity of 12 + log(O/H) = 8.0 ± 0.5. In contrast with the gas-phase metallicity distribution derived with the direct-Te method (middle panel), the PROSPECTOR fit (right panel) in Fig. 14 does not show any metallicity gradient in CR7-A. We ascribe such a different pattern to the different methods used to derive the gas-phase metallicity. In the central panel the metallicity is derived from the ‘direct’ Te method. In the right panel the metallicity is derived by PROSPECTOR, which relies on CLOUDY models to derive the nebular emission (Ferland et al. 1998). In the latter case, it is important to note that in order to perform the fit with PROSPECTOR, we convolved the low-resolution data cube with the wavelength-dependent point spread function (see D’Eugenio et al. 2024, and Sect. 3.6), which can possibly result in a loss of spatial information. Such differences regarding the method to derive the gas metallicity plausibly cause the observed difference.
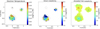 |
Fig. 14. Physical properties of the ISM of CR7. From left to right, the electron temperature, gas-phase metallicity derived with the direct method (Te method), and the gas-phase metallicity derived with PROSPECTOR performing an SED fitting are shown (see Sect. 3.4 and Sect. 3.6 for details). Spaxels at S/N ≤ 3 for the [O III]λ4363 are masked. Black contours are arbitrary [O III]λ5007 flux levels. The black crosses mark the positions of the three components. |
Nevertheless, we observe that considering the average gas-phase metallicity estimated with the direct-Te method and the Prospector fitting analysis provide consistent values for each satellites in the system. Moreover, from the total integrated spectrum of CR7 we found an average metallicity of Z = 0.2 ± 0.08 Z⊙ and Z = 0.26 ± 0.01 Z⊙ from direct Te method and SED fitting, respectively. Overall, our findings for both the direct Te and the gas phase metallicity estimated with PROSPECTOR are consistent with the analysis of Matthee et al. (2017a) and Dors et al. (2018) that measured an integrated metallicity of Z = 0.05–0.2 Z⊙ based on multiple methodologies employing [C II]λ158μm luminosity and UV lines, SFR and photoionisation modelling, respectively.
We observed a metallicity gradient across CR7-A, showing higher values towards the south-west edge, opposite to the electron temperature trend (see Fig. 14). This region of enhanced metal content in CR7-A is co-spatial with the hypothetical high-excitation region (see Fig. 6) and the region of high [O III]λ5007/Hβ ratio. As discussed in Sec. 3.4, the presence of an outflow emerging from CR7-A is consistent with the observed features. Interestingly, both models and simulations predict higher values of metal content co-spatial to AGN-driven outflows, under the scenario of a wind pushing the inner metal-rich gas towards the outskirts of the galaxy, thus causing the enhanced metal content within the outflow (Moll et al. 2007; Germain et al. 2009; Shen et al. 2010; Taylor & Kobayashi 2015; Choi et al. 2020). As discussed in Sect. 3.4, in this work we cannot conclusively state or rule-out the presence of an AGN in the centre of CR7-A, which in case would make our estimates of the gas-phase metallicity unreliable.
Interestingly, the right panel in Fig. 14, showing the metallicity measured with PROSPECTOR, reports a higher gas-phase metallicity in CR7-C, with an average value of 12 + log(O/H) = 8.12 ± 0.02. As we discuss in the following section, our findings show unambiguous evidence of vigorous interaction between CR7-A and CR7-C, with gas being transferred towards the most massive galaxy, i.e., CR7-A. In such a scenario, preferential accretion of gas onto CR7-A instead of CR7-C would lower the metal content of CR7-A, by diluting the average gas-phase metallicity, as observed. On the other hand, the metallicity in CR7-C should increase due to weak cosmic gas accretion, thus the ISM is enriched in metals as a by-product of stellar evolution that is not counteracted by dilution.
4. Discussion
In this paper, we have presented the spatially resolved and integrated properties of CR7, leveraging the high spectral resolution of the G395H grating and the broad spectral coverage of the low-resolution prism from NIRSpec/IFS data. Here, we summarise and discuss the interaction among the various components in CR7 as a result of our analysis, comparing our findings with previous works.
4.1. Multiple satellites in CR7
As outlined in Sect. 3, multiple lines of evidence, including the ionised gas kinematics, gas-phase metallicity and SFH via continuum fitting, are consistent with a scenario of interaction between the UV-bright components CR7-B, and CR7-C and the most massive galaxy in CR7, i.e. CR7-A, suggesting they all form a merging system. Specifically, as shown in Figs. 2, 4 and in agreement with the findings of Matthee et al. (2017a), we detected multiple components in CR7 that exhibit different projected systemic velocities. To summarise, CR7-C, and CR7-D display narrow emission lines (σ ≤ 130 km s−1), consistent with the interpretation of these clumps as detached satellites falling into the gravitational centre of CR7. CR7-B shows a narrow emission line profile with a blueshifted wing extending southward, possibly indicative of gas inflow or outflow. The presence of at least one sub-structure, which is likely interacting with the main UV-bright galaxy in CR7, aligns well with theoretical models and simulations of structure formation via clump aggregation in the early Universe (Dekel et al. 2009a; Mandelker et al. 2014; Oklopčić et al. 2017). Moreover, there is growing observational evidence of satellite aggregation towards central galaxies at high redshift, which significantly contributes to the total stellar mass of the main galaxy (Carniani et al. 2017, 2018a,b; Zanella et al. 2019; Duan et al. 2024; Messa et al. 2025; Vanzella et al. 2024, see also Cresci et al. in prep for the Himiko galaxy). Based on dynamical mass estimates and stellar mass content (see Sect. 3.3 and Table 2), CR7-A is likely to be the central and most massive galaxy within the system, as previously concluded by several studies (Sobral et al. 2015; Bowler et al. 2017; Matthee et al. 2017a, 2020). Moreover, the SFH and the fraction of stellar mass formed as a function of the look-back time (see Fig. 12) suggest that CR7-C and CR7-A began influencing their mutual evolution as early as 600 Myr ago, probably through gas inflow from CR7-C towards CR7-A. By analysing the SFH of the individual satellites, we propose that such a merger caused the transfer of a substantial amount of gas mass until approximately 150 Myr ago, when the SFR of CR7-C and CR7-A began to converge (see Fig. 11).
4.2. Resolved FMR
Many works have provided evidence of a three-dimensional relationship between M★–Zgas-SFR (Tremonti et al. 2004; Mannucci et al. 2010; Maiolino & Mannucci 2019; Cresci et al. 2019), called the ‘fundamental metallicity relation’ (FMR) due to its independence from redshift at least up to z ∼ 3 (Cresci et al. 2019). In a recent work, Baker et al. (2023) provided evidence for a spatially resolved version of this relationship, highlighting that local metallicity is primarily influenced by  and present an inverse relationship with ΣSFR.
In this work, we utilised the resolved maps of SFR100 density and gas-phase metallicity as provided by PROSPECTOR to investigate an observed anti-correlation in CR7 at z ≥ 6.6. Fig. 15 shows the observed anti-correlation between the gas-phase metallicity and SFR100 in CR7. As shown in Fig. 15, a Spearman correlation test revealed a correlation coefficient of ρ = –0.4 with a statistical significance of 8σ, indicating moderate anti-correlation between SFR100 density and gas metallicity. Additionally, we computed the partial correlation coefficient at fixed stellar mass density to further investigate the observed trend. We found a significant negative partial correlation of ρ = –0.40 , confirming that at fixed stellar mass density, higher values of SFR density are associated with lower gas-phase metallicities.
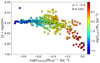 |
Fig. 15. Distribution of the spatially resolved gas-phase metallicity and SFR surface density colour-coded with the surface density of the total stellar mass formed in CR7. All properties are derived with PROSPECTOR (see Sect. 3.6 and Figs. 14, 9). |
Our findings qualitatively align with the scenario in which a gas stream flows from one component of CR7 to the other (see Sect. 3.3). In this case, the inflowing gas reduces the metal content of the ISM, thereby lowering the metallicity (see middle and right panels in Fig. 14) and replenishing the gas reservoir of the accreting galaxy, thus increasing the SFR (see Fig. 11). This scenario is consistent with significant amount of gas being dragged from CR7-C to CR7-A, as shown by extended ionised gas emission among these two satellites (see Figs. 4, 5). As a consequence, we observed a drastic decline of the gas reservoir and thus of the SFR in CR7-C (see Fig. 11), with a net increase of the total gas-phase metallicity (see Fig. 14). On the other hand, the effect on CR7-A, which is the main attractor of the gas mass inflowing from CR7-C, is that of an overall lower metal content and higher SFR. CR7-B appears not to be influenced by such interacting phenomena, showing an intermediate metal content and SFR (Table 2 and Fig. 11).
Similarly to the feature we observe in CR7-A, Arribas et al. (2024) found a metallicity gradient in a merging system at z ∼ 6.9 and interpreted it as due to accretion of metal poor circumgalactic medium (CGM) onto the main galaxy (see also Dekel et al. 2009b; Cresci et al. 2010; Rodríguez Del Pino et al. 2024; Sarkar et al. 2025; Venturi et al. 2024). Additionally, Marconcini et al. (2024) reported a north-south metallicity gradient and a corresponding anti-correlation between  – ΣSFR in a star-forming galaxy at z ∼ 9.1 which could potentially be explained by the same scenario we propose here. Finally, Tripodi et al. (2024), studied a sample of galaxies using NIRSpec/MSA data and observed similar trends in compact galaxies, further supporting this interpretation. From a theoretical perspective, Bahé & McCarthy (2015) studied the quenching of star formation in galaxy clusters from the GIMIC suite (Crain et al. 2009) of cosmological hydrodynamical simulations and stated that quenching occurs earlier for satellite galaxies orbiting massive galaxies, due to tidal forces inducing gas loss.
4.3. Origin of the intense Lyα emission
As discussed in Sect. 3.6.2 the CR7 system is characterised by intense Lyα emission (see also Matthee et al. 2020) primarily originating from the most massive galaxy in the system, CR7-A. As shown in Fig. 12, CR7-A experienced a peak of SF approximately 200 Myr ago, followed by a secondary, ongoing burst. This most recent stellar population is expected to produce significant amounts of ionising photons, which could drive the observed Lyα emission (for other tentative physical mechanisms that could sustain the extended Lyα emission see Kiyota et al. 2025). However, the bright observed Lyα also requires some mechanism facilitating photon escape.
Recent theoretical results suggest that Lyα photon escape at high redshift may be enhanced in mergers (Witten et al. 2024). The complex, multi-component nature of CR7 certainly resonates with this possible explanation. Furthermore, in Sects. 3.4–3.7 we presented multiple hints of a possible AGN within CR7-A. If present, the AGN could have sustained an ionised outflow, clearing a path for ionising photons to escape more efficiently towards the galaxy's outskirts (Sect. 3.6.2). The observed spatially extended Lyα emission (see Fig. 13) suggests that Lyα photons are scattered through a partially ionised medium and are free to escape efficiently along cavities in the CGM, reducing resonant absorption and boosting the observed luminosity. Future observations in mid-IR wavelengths could provide definitive evidence for or against the AGN nature of CR7-A, further constraining the mechanisms driving the intense Lyα emission.
5. Conclusions
We have studied the ionised gas kinematics and excitation properties through emission line fitting in the z = 6.60425 system CR7 using JWST/NIRSpec high- and low-resolution IFU data cubes. We have also performed an SED analysis of the integrated continuum emission of the three main UV bright companions, obtaining their stellar masses, SFHs, and gas metallicities. The main results are summarised as follows:
-
The emission line multi-Gaussian fit of the high-resolution G395H data cube revealed the peculiar ionised gas morphology and kinematics of the three main satellites. Moment maps in Fig. 4 show blueshifted extended emission of ionised gas connecting CR7-C and CR7-A, with projected velocities between ∼-200 km s−1 and 0 km s−1. From our gas kinematic analysis, we confirm that CR7-A, CR7-B, and CR7-C have relative velocities less than 200 km s−1 within a projected distance of ≤6 kpc, and therefore we confirm that they likely represent an ongoing merging system. We also discovered the presence of a smaller satellite with distinct narrow-line emission, possibly associated with interactions within this merging system, at a projected distance of ≤7 kpc. In particular, two galaxies, CR7-A and CR7-C, show clear evidence of gravitational interactions, with tidal tails connecting their main structures.
-
We computed spatially resolved maps of emission line ratios and used tailored diagnostic diagrams to specifically discriminate the ionisation source at high redshift by employing the [O III]λ5007/[O III]λ4363 versus [O III]λ4363/Hγ line ratios. We find tentative evidence of AGN excitation southwards of CR7-A co-spatial with enhanced values of [O III]λ5007/Hβ, further supporting the AGN ionisation scenario. In contrast to previous works, we find that CR7-B is entirely associated with SF excitation, with no evidence of AGN ionisation, based on diagnostic diagrams. On the other hand, from the gas kinematic and line ratios (see Fig. 5, 7) emerged the possibility of a high-ionisation source that possibly powers an outflow.
-
From the high-resolution data, we computed the electron temperature (Te) and found an average temperature of 1.6 × 10⁴ K. We estimated the gas-phase metallicity both with the direct Te-method and SED fitting of low-resolution data and inferred a higher metal content co-spatial with the AGN-ionised region, likely indicating the presence of a cavity emptied by an AGN-driven wind and then enriched with metals.
-
We performed a detailed SED fitting analysis of the low-resolution data and re-constructed the SFH of CR7. Our findings suggest a tight interaction between CR7-A and CR7-C that occurred between 600 and 150 Myrs earlier and impacted the evolution of both components. This interpretation is also supported by signs of gas exchange between CR7-C and CR7-A, as shown by extended emission between these satellites.
-
We traced the Lyα emission line from the low-resolution data and compared to the Hα emission to compute spatially resolved maps of the ionising photon escape fraction. We find that ionising photons are more likely to escape in the region where we found evidence of an outflow, consistent with the scenario of the wind clearing the gas along its path and thus favouring the escape of LyC photons towards the IGM and ultimately contributing to the re-ionisation.
Our spatially resolved analysis of the CR7 system reveals how merger driven gas flows between CR7-A, B, C, and the newly identified CR7-D can regulate both the star formation and metal enrichment at high-redshift. These findings showcase the power of JWST/NIRSpec IFS in constraining the ionisation mechanisms, gas kinematics, and ISM conditions in the early Universe.
Data availability
The JWST/NIRSpec data used in this work has been obtained within the NIRSpec-IFU GTO programme (program ID 1217, Observation 6) and have been publicly available since May 2, 2024. The data presented in this work will be shared upon reasonable request to the corresponding author.
Acknowledgments
CM, FDE, and RM acknowledge support by the Science and Technology Facilities Council (STFC), by the ERC Advanced Grant 695671 “QUENCH”, and by the UKRI Frontier Research grant RISEandFALL. CM also acknowledge the support of the INAF Large Grant 2022 “The metal circle: a new sharp view of the baryon cycle up to Cosmic Dawn with the latest generation IFU facilities” and of the grant PRIN-MUR 2020ACSP5K_002 financed by European Union – Next Generation EU. RM is further supported by a research professorship from the Royal Society. SA, BRdP, and MP acknowledge support from the research project PID2021-127718NB-I00 of the Spanish Ministry of Science and Innovation/State Agency of Research (MICIN/AEI). HÜ acknowledges support through the ERC Starting Grant 101164796 “APEX”. GCJ, AJB acknowledges funding from the “FirstGalaxies” Advanced Grant from the European Research Council (ERC) under the European Union's Horizon 2020 research and innovation programme (Grant agreement No. 789056). SC, EP, and GV acknowledge support by European Union's HE ERC Starting Grant No. 101040227 – WINGS. IL acknowledges support from grant PRIN-MUR 2020ACSP5K_002 financed by European Union – Next Generation EU. GC acknowledges the support of the INAF Large Grant 2022 “The metal circle: a new sharp view of the baryon cycle up to Cosmic Dawn with the latest generation IFU facilities”. PGP-G acknowledges support from Spanish Ministerio de Ciencia e Innovación MCIN/AEI/10.13039/501100011033 through grant PGC2018-093499-B-I00.
GA-NIFS website: https://ga-nifs.github.io
For completeness, we also estimated the dust attenuation assuming a Cardelli extinction law (Cardelli et al. 1989). Nevertheless, we observed that adopting such an attenuation law only varies the resulting extinction by ≤10%, which does not alter our conclusions.
References
- Abdurro’uf, Larson, R. L., Coe, D., et al. 2024, ApJ, 973, 47 [Google Scholar]
- Agarwal, B., Johnson, J. L., Zackrisson, E., et al. 2016, MNRAS, 460, 4003 [NASA ADS] [CrossRef] [Google Scholar]
- Agarwal, B., Johnson, J. L., Khochfar, S., et al. 2017, MNRAS, 469, 231 [Google Scholar]
- Arribas, S., Perna, M., Rodríguez Del Pino, B., et al. 2024, A&A, 688, A146 [NASA ADS] [CrossRef] [EDP Sciences] [Google Scholar]
- Bahé, Y. M., & McCarthy, I. G. 2015, MNRAS, 447, 969 [Google Scholar]
- Baker, W. M., Maiolino, R., Belfiore, F., et al. 2023, MNRAS, 519, 1149 [Google Scholar]
- Baldwin, J. A., Phillips, M. M., & Terlevich, R. 1981, PASP, 93, 5 [Google Scholar]
- Bezanson, R., van der Wel, A., Pacifici, C., et al. 2018, ApJ, 858, 60 [NASA ADS] [CrossRef] [Google Scholar]
- Blanc, G. A., Adams, J. J., Gebhardt, K., et al. 2011, ApJ, 736, 31 [CrossRef] [Google Scholar]
- Böker, T., Arribas, S., Lützgendorf, N., et al. 2022, A&A, 661, A82 [NASA ADS] [CrossRef] [EDP Sciences] [Google Scholar]
- Bowler, R. A. A., McLure, R. J., Dunlop, J. S., et al. 2017, MNRAS, 469, 448 [NASA ADS] [CrossRef] [Google Scholar]
- Brinchmann, J. 2023, MNRAS, 525, 2087 [NASA ADS] [CrossRef] [Google Scholar]
- Bunker, A. J., Saxena, A., Cameron, A. J., et al. 2023, A&A, 677, A88 [NASA ADS] [CrossRef] [EDP Sciences] [Google Scholar]
- Byler, N., Dalcanton, J. J., Conroy, C., & Johnson, B. D. 2017, ApJ, 840, 44 [Google Scholar]
- Calzetti, D., Armus, L., Bohlin, R. C., et al. 2000, ApJ, 533, 682 [NASA ADS] [CrossRef] [Google Scholar]
- Cappellari, M. 2023, MNRAS, 526, 3273 [NASA ADS] [CrossRef] [Google Scholar]
- Cappellari, M., & Copin, Y. 2003, MNRAS, 342, 345 [Google Scholar]
- Cappellari, M., & Emsellem, E. 2004, PASP, 116, 138 [Google Scholar]
- Cardelli, J. A., Clayton, G. C., & Mathis, J. S. 1989, ApJ, 345, 245 [Google Scholar]
- Carniani, S., Maiolino, R., Pallottini, A., et al. 2017, A&A, 605, A42 [NASA ADS] [CrossRef] [EDP Sciences] [Google Scholar]
- Carniani, S., Maiolino, R., Smit, R., & Amorín, R. 2018a, ApJ, 854, L7 [Google Scholar]
- Carniani, S., Maiolino, R., Amorin, R., et al. 2018b, MNRAS, 478, 1170 [NASA ADS] [CrossRef] [Google Scholar]
- Charlot, S., & Fall, S. M. 2000, ApJ, 539, 718 [Google Scholar]
- Chen, Z., Stark, D. P., Endsley, R., et al. 2023, MNRAS, 518, 5607 [Google Scholar]
- Choi, J., Dotter, A., Conroy, C., et al. 2016, ApJ, 823, 102 [Google Scholar]
- Choi, E., Brennan, R., Somerville, R. S., et al. 2020, ApJ, 904, 8 [NASA ADS] [CrossRef] [Google Scholar]
- Ciardi, B., Ferrara, A., & White, S. D. M. 2003, MNRAS, 344, L7 [NASA ADS] [CrossRef] [Google Scholar]
- Conroy, C., & Gunn, J. E. 2010, ApJ, 712, 833 [Google Scholar]
- Conroy, C., Gunn, J. E., & White, M. 2009, ApJ, 699, 486 [Google Scholar]
- Costa, T., Sijacki, D., Trenti, M., & Haehnelt, M. G. 2014, MNRAS, 439, 2146 [NASA ADS] [CrossRef] [Google Scholar]
- Crain, R. A., Theuns, T., Dalla Vecchia, C., et al. 2009, MNRAS, 399, 1773 [Google Scholar]
- Cresci, G., Mannucci, F., Maiolino, R., et al. 2010, Nature, 467, 811 [Google Scholar]
- Cresci, G., Mannucci, F., & Curti, M. 2019, A&A, 627, A42 [NASA ADS] [CrossRef] [EDP Sciences] [Google Scholar]
- Curti, M., D’Eugenio, F., Carniani, S., et al. 2023, MNRAS, 518, 425 [Google Scholar]
- Curti, M., Witstok, J., Jakobsen, P., et al. 2025, A&A, 697, A89 [Google Scholar]
- Dekel, A., Sari, R., & Ceverino, D. 2009a, ApJ, 703, 785 [Google Scholar]
- Dekel, A., Birnboim, Y., Engel, G., et al. 2009b, Nature, 457, 451 [Google Scholar]
- D’Eugenio, F., Pérez-González, P. G., Maiolino, R., et al. 2024, Nat. Astron., 8, 1443 [CrossRef] [Google Scholar]
- Dijkstra, M., Gronke, M., & Sobral, D. 2016, ApJ, 823, 74 [NASA ADS] [CrossRef] [Google Scholar]
- Dors, O. L., Agarwal, B., Hägele, G. F., et al. 2018, MNRAS, 479, 2294 [NASA ADS] [CrossRef] [Google Scholar]
- Duan, Q., Conselice, C. J., Li, Q., et al. 2024, ArXiv e-prints [arXiv:2407.09472] [Google Scholar]
- Endsley, R., Stark, D. P., Whitler, L., et al. 2023, MNRAS, 524, 2312 [NASA ADS] [CrossRef] [Google Scholar]
- Falcón-Barroso, J., Sánchez-Blázquez, P., Vazdekis, A., et al. 2011, A&A, 532, A95 [Google Scholar]
- Fan, X., Carilli, C. L., & Keating, B. 2006, ARA&A, 44, 415 [Google Scholar]
- Feltre, A., Charlot, S., & Gutkin, J. 2016, MNRAS, 456, 3354 [Google Scholar]
- Ferland, G. J., Korista, K. T., Verner, D. A., et al. 1998, PASP, 110, 761 [Google Scholar]
- Gabor, J. M., & Bournaud, F. 2014, MNRAS, 441, 1615 [CrossRef] [Google Scholar]
- Germain, J., Barai, P., & Martel, H. 2009, ApJ, 704, 1002 [Google Scholar]
- Goovaerts, I., Thai, T. T., Pello, R., et al. 2024, A&A, 690, A302 [NASA ADS] [CrossRef] [EDP Sciences] [Google Scholar]
- Hani, M. H., Gosain, H., Ellison, S. L., Patton, D. R., & Torrey, P. 2020, MNRAS, 493, 3716 [Google Scholar]
- Hartwig, T., Latif, M. A., Magg, M., et al. 2016, MNRAS, 462, 2184 [Google Scholar]
- Hopkins, P. F., Quataert, E., & Murray, N. 2012, MNRAS, 421, 3522 [Google Scholar]
- Isobe, Y., Ouchi, M., Nakajima, K., et al. 2023, ApJ, 956, 139 [NASA ADS] [CrossRef] [Google Scholar]
- Izotov, Y. I., Stasińska, G., Meynet, G., Guseva, N. G., & Thuan, T. X. 2006, A&A, 448, 955 [CrossRef] [EDP Sciences] [Google Scholar]
- Izotov, Y. I., Chisholm, J., Worseck, G., et al. 2022, MNRAS, 515, 2864 [NASA ADS] [CrossRef] [Google Scholar]
- Jakobsen, P., Ferruit, P., Alves de Oliveira, C., et al. 2022, A&A, 661, A80 [NASA ADS] [CrossRef] [EDP Sciences] [Google Scholar]
- Johnson, B. D., Leja, J., Conroy, C., & Speagle, J. S. 2021, ApJS, 254, 22 [NASA ADS] [CrossRef] [Google Scholar]
- Jones, G. C., Bunker, A. J., Saxena, A., et al. 2024, A&A, 683, A238 [NASA ADS] [CrossRef] [EDP Sciences] [Google Scholar]
- Kiyota, T., Ouchi, M., Xu, Y., et al. 2025, ArXiv e-prints [arXiv:2504.03156] [Google Scholar]
- Kocevski, D. D., Onoue, M., Inayoshi, K., et al. 2023, ApJ, 954, L4 [NASA ADS] [CrossRef] [Google Scholar]
- Kriek, M., & Conroy, C. 2013, ApJ, 775, L16 [NASA ADS] [CrossRef] [Google Scholar]
- Kumari, N., Smit, R., Witstok, J., et al. 2024, ArXiv e-prints [arXiv:2406.11997] [Google Scholar]
- Leja, J., Carnall, A. C., Johnson, B. D., Conroy, C., & Speagle, J. S. 2019, ApJ, 876, 3 [Google Scholar]
- Levesque, E. M., & Richardson, M. L. A. 2014, ApJ, 780, 100 [Google Scholar]
- Ma, X., Quataert, E., Wetzel, A., et al. 2020, MNRAS, 498, 2001 [Google Scholar]
- Maiolino, R., & Mannucci, F. 2019, A&ARv, 27, 3 [Google Scholar]
- Maiolino, R., Scholtz, J., Curtis-Lake, E., et al. 2024, A&A, 691, A145 [NASA ADS] [CrossRef] [EDP Sciences] [Google Scholar]
- Maji, M., Verhamme, A., Rosdahl, J., et al. 2022, A&A, 663, A66 [NASA ADS] [CrossRef] [EDP Sciences] [Google Scholar]
- Mandelker, N., Dekel, A., Ceverino, D., et al. 2014, MNRAS, 443, 3675 [NASA ADS] [CrossRef] [Google Scholar]
- Mannucci, F., Cresci, G., Maiolino, R., Marconi, A., & Gnerucci, A. 2010, MNRAS, 408, 2115 [NASA ADS] [CrossRef] [Google Scholar]
- Marasco, A., Cresci, G., Nardini, E., et al. 2020, A&A, 644, A15 [EDP Sciences] [Google Scholar]
- Marconcini, C., D’Eugenio, F., Maiolino, R., et al. 2024, MNRAS, 533, 2488 [NASA ADS] [CrossRef] [Google Scholar]
- Matthee, J., Sobral, D., Santos, S., et al. 2015, MNRAS, 451, 400 [Google Scholar]
- Matthee, J., Sobral, D., Boone, F., et al. 2017a, ApJ, 851, 145 [NASA ADS] [CrossRef] [Google Scholar]
- Matthee, J., Sobral, D., Darvish, B., et al. 2017b, MNRAS, 472, 772 [Google Scholar]
- Matthee, J., Sobral, D., Best, P., et al. 2017c, MNRAS, 465, 3637 [NASA ADS] [CrossRef] [Google Scholar]
- Matthee, J., Pezzulli, G., Mackenzie, R., et al. 2020, MNRAS, 498, 3043 [Google Scholar]
- Mazzolari, G., Übler, H., Maiolino, R., et al. 2024, A&A, 691, A345 [NASA ADS] [CrossRef] [EDP Sciences] [Google Scholar]
- Messa, M., Vanzella, E., Loiacono, F., et al. 2025, A&A, 694, A59 [NASA ADS] [CrossRef] [EDP Sciences] [Google Scholar]
- Moll, R., Schindler, S., Domainko, W., et al. 2007, A&A, 463, 513 [NASA ADS] [CrossRef] [EDP Sciences] [Google Scholar]
- Muñoz, J. B., Mirocha, J., Chisholm, J., Furlanetto, S. R., & Mason, C. 2024, MNRAS, 535, L37 [CrossRef] [Google Scholar]
- Murphy, E. J., Condon, J. J., Schinnerer, E., et al. 2011, ApJ, 737, 67 [Google Scholar]
- Murray, N., Ménard, B., & Thompson, T. A. 2011, ApJ, 735, 66 [NASA ADS] [CrossRef] [Google Scholar]
- Nagao, T., Maiolino, R., & Marconi, A. 2006, A&A, 459, 85 [NASA ADS] [CrossRef] [EDP Sciences] [Google Scholar]
- Nakajima, K., & Maiolino, R. 2022, MNRAS, 513, 5134 [NASA ADS] [CrossRef] [Google Scholar]
- Noll, S., Pierini, D., Cimatti, A., et al. 2009, A&A, 499, 69 [NASA ADS] [CrossRef] [EDP Sciences] [Google Scholar]
- Oklopčić, A., Hopkins, P. F., Feldmann, R., et al. 2017, MNRAS, 465, 952 [CrossRef] [Google Scholar]
- Osterbrock, D. E., & Ferland, G. J. 2006, Astrophysics of gaseous nebulae and active galactic nuclei (Sausalito, California: University Science Books) [Google Scholar]
- Pacucci, F., Pallottini, A., Ferrara, A., & Gallerani, S. 2017, MNRAS, 468, L77 [Google Scholar]
- Pallottini, A., Ferrara, A., Pacucci, F., et al. 2015, MNRAS, 453, 2465 [NASA ADS] [Google Scholar]
- Partridge, R. B., & Peebles, P. J. E. 1967, ApJ, 147, 868 [Google Scholar]
- Pérez-González, P. G., Gil de Paz, A., Zamorano, J., et al. 2003, MNRAS, 338, 508 [CrossRef] [Google Scholar]
- Pérez-González, P. G., Rieke, G. H., Villar, V., et al. 2008, ApJ, 675, 234 [Google Scholar]
- Pérez-González, P. G., Barro, G., Annunziatella, M., et al. 2023, ApJ, 946, L16 [CrossRef] [Google Scholar]
- Perna, M., Arribas, S., Marshall, M., et al. 2023, A&A, 679, A89 [NASA ADS] [CrossRef] [EDP Sciences] [Google Scholar]
- Planck Collaboration VI. 2020, A&A, 641, A6 [NASA ADS] [CrossRef] [EDP Sciences] [Google Scholar]
- Renaud, F., Segovia Otero, Á., & Agertz, O. 2022, MNRAS, 516, 4922 [NASA ADS] [CrossRef] [Google Scholar]
- Rhoads, J. E., Wold, I. G. B., Harish, S., et al. 2023, ApJ, 942, L14 [NASA ADS] [CrossRef] [Google Scholar]
- Rigby, J., Perrin, M., McElwain, M., et al. 2023, PASP, 135, 048001 [NASA ADS] [CrossRef] [Google Scholar]
- Robertson, B. E., Furlanetto, S. R., Schneider, E., et al. 2013, ApJ, 768, 71 [Google Scholar]
- Rodríguez Del Pino, B., Perna, M., Arribas, S., et al. 2024, A&A, 684, A187 [NASA ADS] [CrossRef] [EDP Sciences] [Google Scholar]
- Sánchez-Blázquez, P., Peletier, R. F., Jiménez-Vicente, J., et al. 2006, MNRAS, 371, 703 [Google Scholar]
- Santini, P., Fontana, A., Castellano, M., et al. 2023, ApJ, 942, L27 [NASA ADS] [CrossRef] [Google Scholar]
- Sarkar, A., Chakraborty, P., Vogelsberger, M., et al. 2025, ApJ, 978, 136 [Google Scholar]
- Saxena, A., Bunker, A. J., Jones, G. C., et al. 2024, A&A, 684, A84 [NASA ADS] [CrossRef] [EDP Sciences] [Google Scholar]
- Schaerer, D., Marques-Chaves, R., Barrufet, L., et al. 2022, A&A, 665, L4 [NASA ADS] [CrossRef] [EDP Sciences] [Google Scholar]
- Scholtz, J., Maiolino, R., D’Eugenio, F., et al. 2025, A&A, 697, A175 [NASA ADS] [CrossRef] [EDP Sciences] [Google Scholar]
- Shen, S., Wadsley, J., & Stinson, G. 2010, MNRAS, 407, 1581 [NASA ADS] [CrossRef] [Google Scholar]
- Sobral, D., Matthee, J., Darvish, B., et al. 2015, ApJ, 808, 139 [Google Scholar]
- Sobral, D., Matthee, J., Brammer, G., et al. 2019, MNRAS, 482, 2422 [Google Scholar]
- Stark, D. P. 2016, ARA&A, 54, 761 [Google Scholar]
- Tacchella, S., Finkelstein, S. L., Bagley, M., et al. 2022, ApJ, 927, 170 [NASA ADS] [CrossRef] [Google Scholar]
- Tacchella, S., Johnson, B. D., Robertson, B. E., et al. 2023, MNRAS, 522, 6236 [NASA ADS] [CrossRef] [Google Scholar]
- Tang, M., Stark, D. P., Chen, Z., et al. 2023, MNRAS, 526, 1657 [NASA ADS] [CrossRef] [Google Scholar]
- Taylor, P., & Kobayashi, C. 2015, MNRAS, 452, L59 [NASA ADS] [CrossRef] [Google Scholar]
- Taylor, A. J., Barger, A. J., & Cowie, L. L. 2022, ApJ, 939, L3 [NASA ADS] [CrossRef] [Google Scholar]
- Topping, M. W., Stark, D. P., Endsley, R., et al. 2024, MNRAS, 529, 4087 [NASA ADS] [CrossRef] [Google Scholar]
- Tremonti, C. A., Heckman, T. M., Kauffmann, G., et al. 2004, ApJ, 613, 898 [Google Scholar]
- Treu, T., Calabrò, A., Castellano, M., et al. 2023, ApJ, 942, L28 [CrossRef] [Google Scholar]
- Tripodi, R., D’Eugenio, F., Maiolino, R., et al. 2024, A&A, 692, A184 [NASA ADS] [CrossRef] [EDP Sciences] [Google Scholar]
- Übler, H., Maiolino, R., Curtis-Lake, E., et al. 2023, A&A, 677, A145 [NASA ADS] [CrossRef] [EDP Sciences] [Google Scholar]
- Übler, H., Maiolino, R., Pérez-González, P. G., et al. 2024, MNRAS, 531, 355 [CrossRef] [Google Scholar]
- van der Wel, A., van Houdt, J., Bezanson, R., et al. 2022, ApJ, 936, 9 [NASA ADS] [CrossRef] [Google Scholar]
- Vanzella, E., Loiacono, F., Messa, M., et al. 2024, A&A, 691, A251 [NASA ADS] [CrossRef] [EDP Sciences] [Google Scholar]
- Venturi, G., Carniani, S., Parlanti, E., et al. 2024, A&A, 691, A19 [NASA ADS] [CrossRef] [EDP Sciences] [Google Scholar]
- Visbal, E., Haiman, Z., & Bryan, G. L. 2016, MNRAS, 460, L59 [Google Scholar]
- Weibel, A., Oesch, P. A., Barrufet, L., et al. 2024, MNRAS, 533, 1808 [NASA ADS] [CrossRef] [Google Scholar]
- Whitler, L., Endsley, R., Stark, D. P., et al. 2023, MNRAS, 519, 157 [Google Scholar]
- Witstok, J., Smit, R., Maiolino, R., et al. 2021, MNRAS, 508, 1686 [NASA ADS] [CrossRef] [Google Scholar]
- Witten, C., Laporte, N., Martin-Alvarez, S., et al. 2024, Nat. Astron., 8, 384 [Google Scholar]
- Xu, X., Henry, A., Heckman, T., et al. 2022, ApJ, 933, 202 [NASA ADS] [CrossRef] [Google Scholar]
- Yuan, Y., Martin-Alvarez, S., Haehnelt, M. G., Garel, T., & Sijacki, D. 2024, MNRAS, 532, 3643 [NASA ADS] [CrossRef] [Google Scholar]
- Zanella, A., Le Floc’h, E., Harrison, C. M., et al. 2019, MNRAS, 489, 2792 [Google Scholar]
Appendix A: Line ratios
At z>9.4, [O III]λλ4959,5007 is redshifted outside of the wavelength range covered by NIRSpec, preventing the use of these lines in various diagnostics of gas metallicity and ionisation. In this context, [Ne III]λ3869 and [O II]λλ3726,3729 can be used as substitutes (e.g. Nagao et al. 2006; Levesque & Richardson 2014; Witstok et al. 2021). In the context of JWST observations, Tripodi et al. (2024) found that the [Ne III]λ3869/[O II]λλ3726,3729 ratio in a sample of galaxies at 4<z<10 decreases with galaxy radius, which could be due to inverse radial gradients in the gas metallicity. However, a complication of using [Ne III]λ3869 in the context of JWST observations is that, with the spectral resolution of the NIRSpec prism, this line is blended with He Iλ3888 and Hζ(Tripodi et al. 2024), which could also vary with radius, thus confounding the interpretation of the radial trends in [Ne III]λ3869/[O II]λλ3726,3729 (which are actually radial trends in the ratio between the blend [Ne III]λ3869+He Iλ3888+Hζ and [O II]λλ3726,3729). It is then useful to characterise the (He Iλ3888+Hζ)/[Ne III]λ3869 ratio in cases like CR7, where we have both the spectral and spatial information necessary to study spatial variations. Fig. A.1 shows the (He Iλ3888 + Hζ)/[Ne III]λ3869 line ratio in CR7. It can be seen that the ratio increases outward. If this increase is common at 4<z<10, then the results of Tripodi et al. (2024) would make the radial gradient in deblended [Ne III]λ3869/[O II]λλ3726,3729 even more negative. While a single galaxy as CR7-A is clearly not sufficient to draw general conclusion, this shows the potential of in-depth studies of well resolved galaxies to address questions raised by larger samples obtained with 1-d NIRSpec spectroscopy.
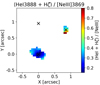 |
Fig. A.1. He Iλ3888+Hζ/[Ne III]λ3869 emission line ratio in CR7. Black solid lines are arbitrary [O III]λ5007 levels. Spaxels with S/N ≤ 3 are masked. Emission lines are corrected for dust attenuation. |
All Tables
All Figures
|
Fig. 1. JWSTNIRSpec images from collapsed [O III]λ5007 emission in the high-resolution G395H (top) and low-resolution prism (bottom) data cubes. Sub-cubes with the selected and labelled clumps are shown on the right. The yellow circle is the fiducial point spread function of ∼0.15″. Magenta contours represent the selected regions for the integrated analysis of the three main satellites described in Sect. 3.2. North is up and east to the left. |
| In the text | |
|
Fig. 2. Three-colour emission line image of CR7 derived from the G395H data cube. The emission line maps are obtained by integrating the continuum-subtracted data-cube around the [O III]λ5007 emission line in the velocity ranges v ≤ – 150 km s−1 (blue), – 150 km s−1 ≤ v ≤ 150 km s−1 (green) and v ≥ 150 km s−1 (red), with respect to the systemic redshift z = 6.60425 (see Sect. 3.3). The black stars mark the positions of the three main components shown in Fig. 1. White crosses mark the positions of the two brightest additional [C II]λ158μm components detected by Matthee et al. (2017a). The right panels show the normalised [O III]λ5007 line profile (black), with the best-fit multi-Gaussian fit (red) composed of the narrow (blue) and broad (green) components, extracted from circular apertures of 0.1 ″ in radius. |
| In the text | |
|
Fig. 3. JWST/NIRSpec G395H (left) and prism (right) integrated spectra from CR7-A, CR7-B, and CR7-C, from top to bottom panels, respectively. The high-resolution spectra cover the wavelength range from 2.7 to 5.27 μm. The low-resolution background-subtracted spectra show a prominent Lyα emission line in CR7-A. |
| In the text | |
|
Fig. 4. Moment maps of [O III]λ5007 from G395H data. From left to right, the integrated emission line flux in logarithmic scale, the flux-weighted LOS velocity, and the velocity dispersion maps are shown. All moment maps are calculated from the total best-fit model. Contours highlight the blueshifted emission v ≤ – 150 km s−1 (magenta), – 150 km s−1 ≤ v ≤ 150 km s−1 (black), and redshifted v ≥ 150 km s−1 (red), with respect to the systemic velocity of CR7-A defined by the redshift z = 6.60425 (see Sect. 3.3). Moment maps are masked when the S/N is less than five. The black stars mark the positions of the three main components and are labelled in the left panel for clarity. North is up, east to the left. |
| In the text | |
|
Fig. 5. Moment maps of the ionised gas in CR7 traced by the [O III]λ5007 emission line for two disentangled kinematic components. From left to right, the integrated emission, the line of sight velocity, and velocity dispersion maps are shown. From top to bottom, moments maps for the narrow and broad components are shown (see Sect. 3.3 for the method used to discriminate between different components). The first order momentum is computed with respect to z = 6.60425. A S/N cut of five on the flux of each component was applied to the maps of the narrow and broad components. The black stars mark the positions of the three main components of CR7. Dashed black contours are arbitrary [O III]λ5007 flux levels. The moment maps are not corrected for dust attenuation. |
| In the text | |
|
Fig. 6. Left: Diagnostic diagram based on Mazzolari et al. (2024) for the excitation source in CR7 based on the [O III]λ4363/Hγ versus [O III]λ5007/[O III]λ4363 line ratio. The dashed black line is the discriminator between AGN or SF excitation source, respectively. Right: Spatially resolved map of CR7 with spaxels colour-coded based on their position on the diagram on the left. For visualisation, we report error-bars only for half of the points. Black solid lines show arbitrary [O III]λ5007 flux levels. Spaxels with S/N ≤ 3 are masked. Emission lines have been corrected for dust attenuation. |
| In the text | |
|
Fig. 7. [O III]λ5007/Hβ emission line ratio in CR7 in logarithmic scale. Black solid lines are arbitrary [O III]λ5007 flux levels. Spaxels with S/N ≤ 5 are masked. Emission lines have been corrected for dust attenuation. Black contours are arbitrary [O III]λ5007 flux levels. |
| In the text | |
|
Fig. 8. Fit of the integrated R100 spectrum of CR7-A extracted from the aperture shown in Fig. 1 and focused on the wavelength range between 1100–1800 Å rest-frame. Data before and after continuum subtraction are in grey and solid black, respectively. Single Gaussians used to fit the Lyα emission line are in dashed blue and purple. Best-fit continuum and emission line models are in green and red, respectively. (For details of the spectrum fit see Sect. 3.6.) |
| In the text | |
|
Fig. 9. Map of the stellar mass surface density derived with PROSPECTOR. The black crosses mark the positions of the three UV bright components of CR7. Black contours are arbitrary [O III]λ5007 flux levels. |
| In the text | |
|
Fig. 10. Specific SFR within the past 10 Myr (Left) and 100 Myr (Right). Black contours are arbitrary [O III]λ5007 flux levels, as in Fig. 11. |
| In the text | |
|
Fig. 11. CR7 properties derived from the emission line and SED fitting of the low-resolution data cube. From left to right, the surface SFR density derived from the Hα spatially resolved emission (see Eq. (3.6.1)) and the SFR within the past 10 Myr and 100 Myr derived with prospector are shown (see Sect. 3.6). Black contours are arbitrary [O III]λ5007 flux levels. |
| In the text | |
|
Fig. 12. Star formation history (left) and fraction of the stellar mass fraction formed per bin of time as a function of the look-back time (right) in CR7. The properties of the total spectrum of CR7, and for CR7-A, CR7-B, and CR7-C are shown in black, orange, red, and blue, respectively. Error bars represent the 84th and 16th percentiles. Horizontal black dashed lines in the right panel mark the level when 50 % and 25 % of the stellar mass was formed in CR7. |
| In the text | |
|
Fig. 13. Resolved map of ionising photon production. Different colour bars indicate the Hα/Lyα emission line ratio in logarithmic scale and the escape fraction of LyC ionising photons as derived from the Hα/Lyα ratio with the method outlined in Sect. 3.6.2. |
| In the text | |
|
Fig. 14. Physical properties of the ISM of CR7. From left to right, the electron temperature, gas-phase metallicity derived with the direct method (Te method), and the gas-phase metallicity derived with PROSPECTOR performing an SED fitting are shown (see Sect. 3.4 and Sect. 3.6 for details). Spaxels at S/N ≤ 3 for the [O III]λ4363 are masked. Black contours are arbitrary [O III]λ5007 flux levels. The black crosses mark the positions of the three components. |
| In the text | |
|
Fig. 15. Distribution of the spatially resolved gas-phase metallicity and SFR surface density colour-coded with the surface density of the total stellar mass formed in CR7. All properties are derived with PROSPECTOR (see Sect. 3.6 and Figs. 14, 9). |
| In the text | |
|
Fig. A.1. He Iλ3888+Hζ/[Ne III]λ3869 emission line ratio in CR7. Black solid lines are arbitrary [O III]λ5007 levels. Spaxels with S/N ≤ 3 are masked. Emission lines are corrected for dust attenuation. |
| In the text | |
Current usage metrics show cumulative count of Article Views (full-text article views including HTML views, PDF and ePub downloads, according to the available data) and Abstracts Views on Vision4Press platform.
Data correspond to usage on the plateform after 2015. The current usage metrics is available 48-96 hours after online publication and is updated daily on week days.
Initial download of the metrics may take a while.