Fig. 5.
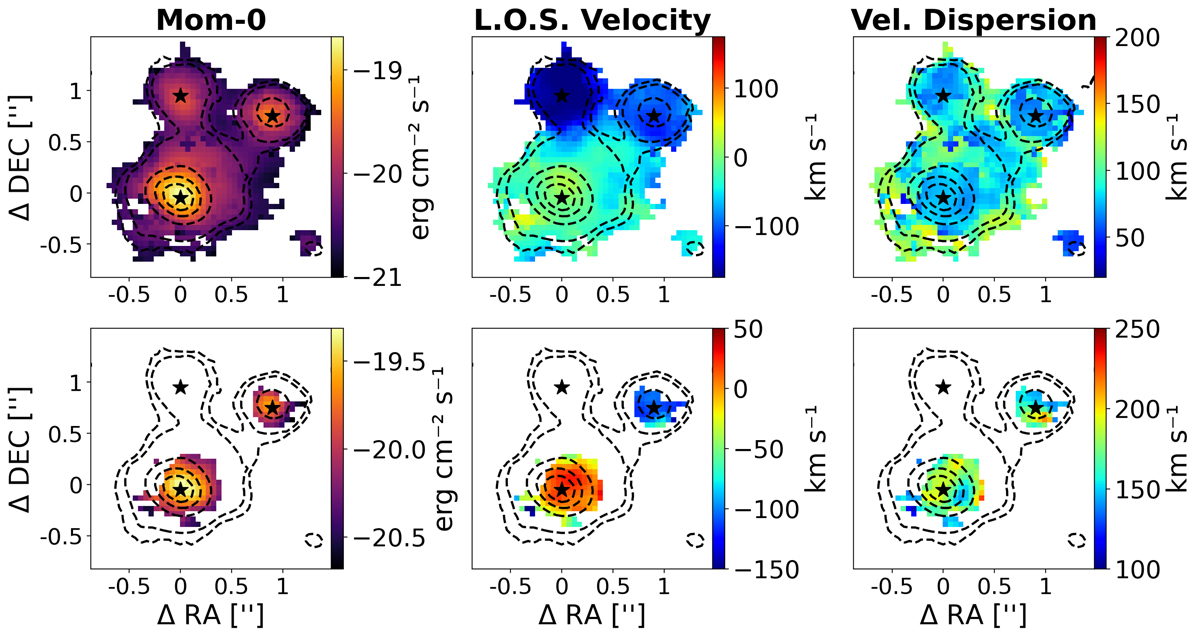
Download original image
Moment maps of the ionised gas in CR7 traced by the [O III]λ5007 emission line for two disentangled kinematic components. From left to right, the integrated emission, the line of sight velocity, and velocity dispersion maps are shown. From top to bottom, moments maps for the narrow and broad components are shown (see Sect. 3.3 for the method used to discriminate between different components). The first order momentum is computed with respect to z = 6.60425. A S/N cut of five on the flux of each component was applied to the maps of the narrow and broad components. The black stars mark the positions of the three main components of CR7. Dashed black contours are arbitrary [O III]λ5007 flux levels. The moment maps are not corrected for dust attenuation.
Current usage metrics show cumulative count of Article Views (full-text article views including HTML views, PDF and ePub downloads, according to the available data) and Abstracts Views on Vision4Press platform.
Data correspond to usage on the plateform after 2015. The current usage metrics is available 48-96 hours after online publication and is updated daily on week days.
Initial download of the metrics may take a while.