Fig. 6.
Download original image
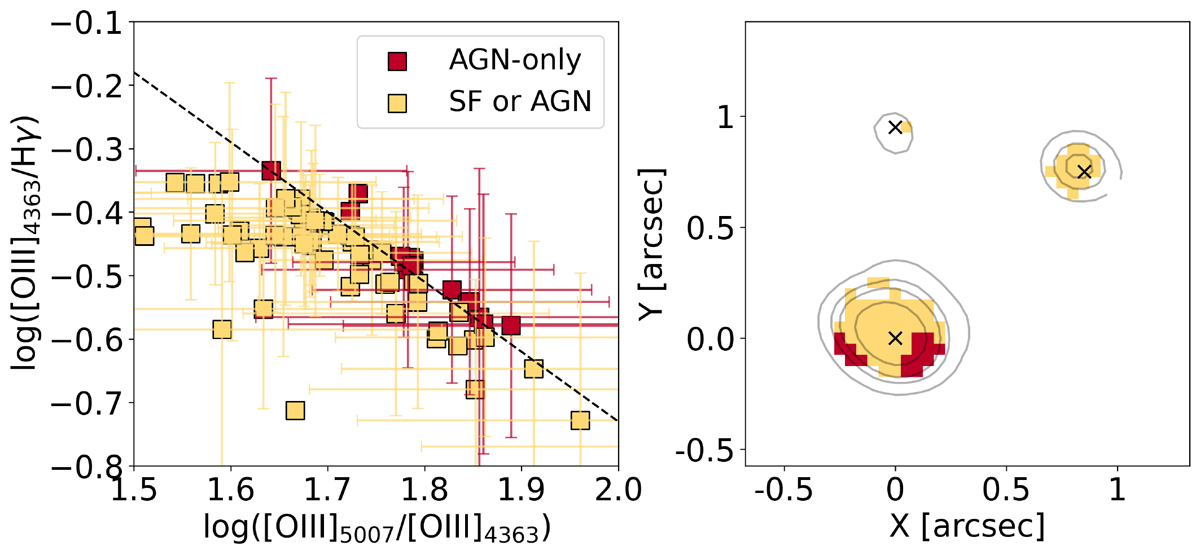
Left: Diagnostic diagram based on Mazzolari et al. (2024) for the excitation source in CR7 based on the [O III]λ4363/Hγ versus [O III]λ5007/[O III]λ4363 line ratio. The dashed black line is the discriminator between AGN or SF excitation source, respectively. Right: Spatially resolved map of CR7 with spaxels colour-coded based on their position on the diagram on the left. For visualisation, we report error-bars only for half of the points. Black solid lines show arbitrary [O III]λ5007 flux levels. Spaxels with S/N ≤ 3 are masked. Emission lines have been corrected for dust attenuation.
Current usage metrics show cumulative count of Article Views (full-text article views including HTML views, PDF and ePub downloads, according to the available data) and Abstracts Views on Vision4Press platform.
Data correspond to usage on the plateform after 2015. The current usage metrics is available 48-96 hours after online publication and is updated daily on week days.
Initial download of the metrics may take a while.