Fig. 12.
Download original image
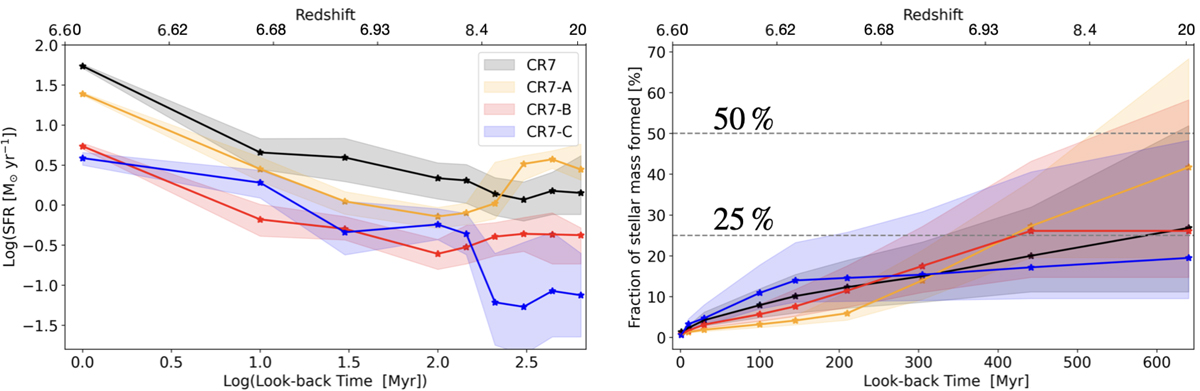
Star formation history (left) and fraction of the stellar mass fraction formed per bin of time as a function of the look-back time (right) in CR7. The properties of the total spectrum of CR7, and for CR7-A, CR7-B, and CR7-C are shown in black, orange, red, and blue, respectively. Error bars represent the 84th and 16th percentiles. Horizontal black dashed lines in the right panel mark the level when 50 % and 25 % of the stellar mass was formed in CR7.
Current usage metrics show cumulative count of Article Views (full-text article views including HTML views, PDF and ePub downloads, according to the available data) and Abstracts Views on Vision4Press platform.
Data correspond to usage on the plateform after 2015. The current usage metrics is available 48-96 hours after online publication and is updated daily on week days.
Initial download of the metrics may take a while.