Open Access
Fig. 13.
Download original image
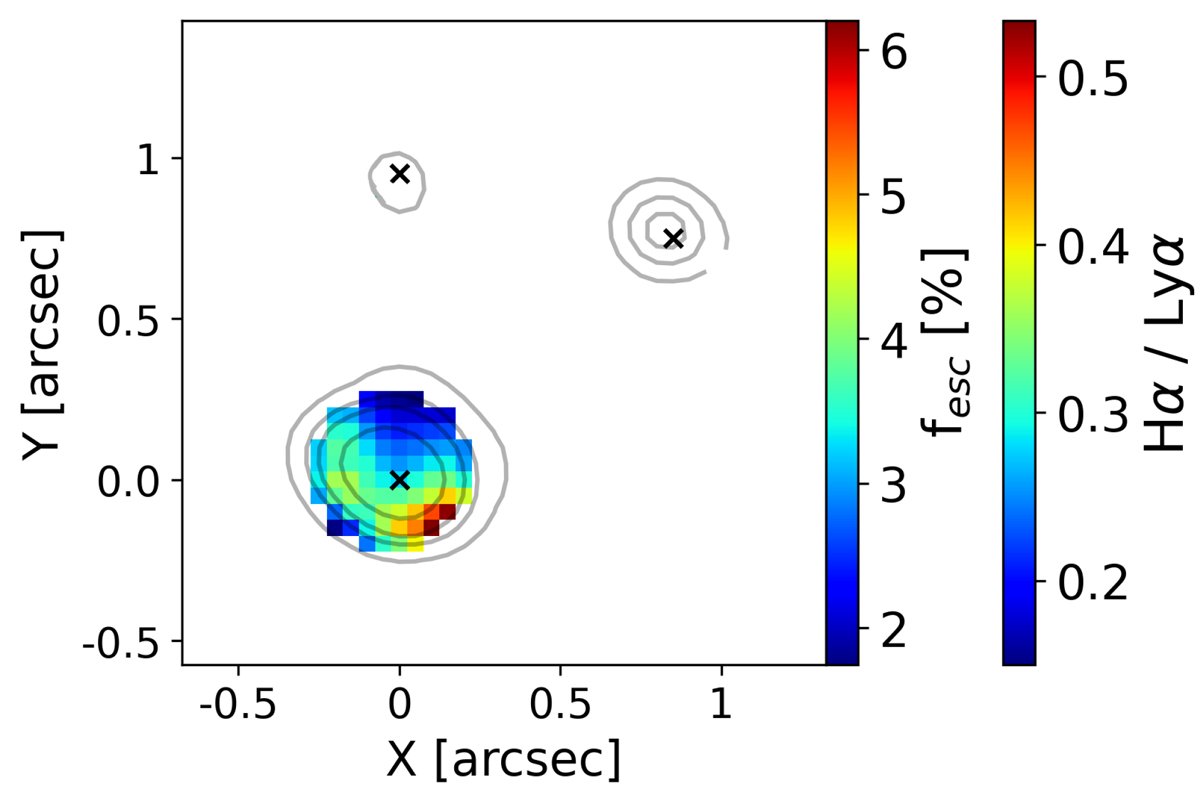
Resolved map of ionising photon production. Different colour bars indicate the Hα/Lyα emission line ratio in logarithmic scale and the escape fraction of LyC ionising photons as derived from the Hα/Lyα ratio with the method outlined in Sect. 3.6.2.
Current usage metrics show cumulative count of Article Views (full-text article views including HTML views, PDF and ePub downloads, according to the available data) and Abstracts Views on Vision4Press platform.
Data correspond to usage on the plateform after 2015. The current usage metrics is available 48-96 hours after online publication and is updated daily on week days.
Initial download of the metrics may take a while.