Fig. 2.

Download original image
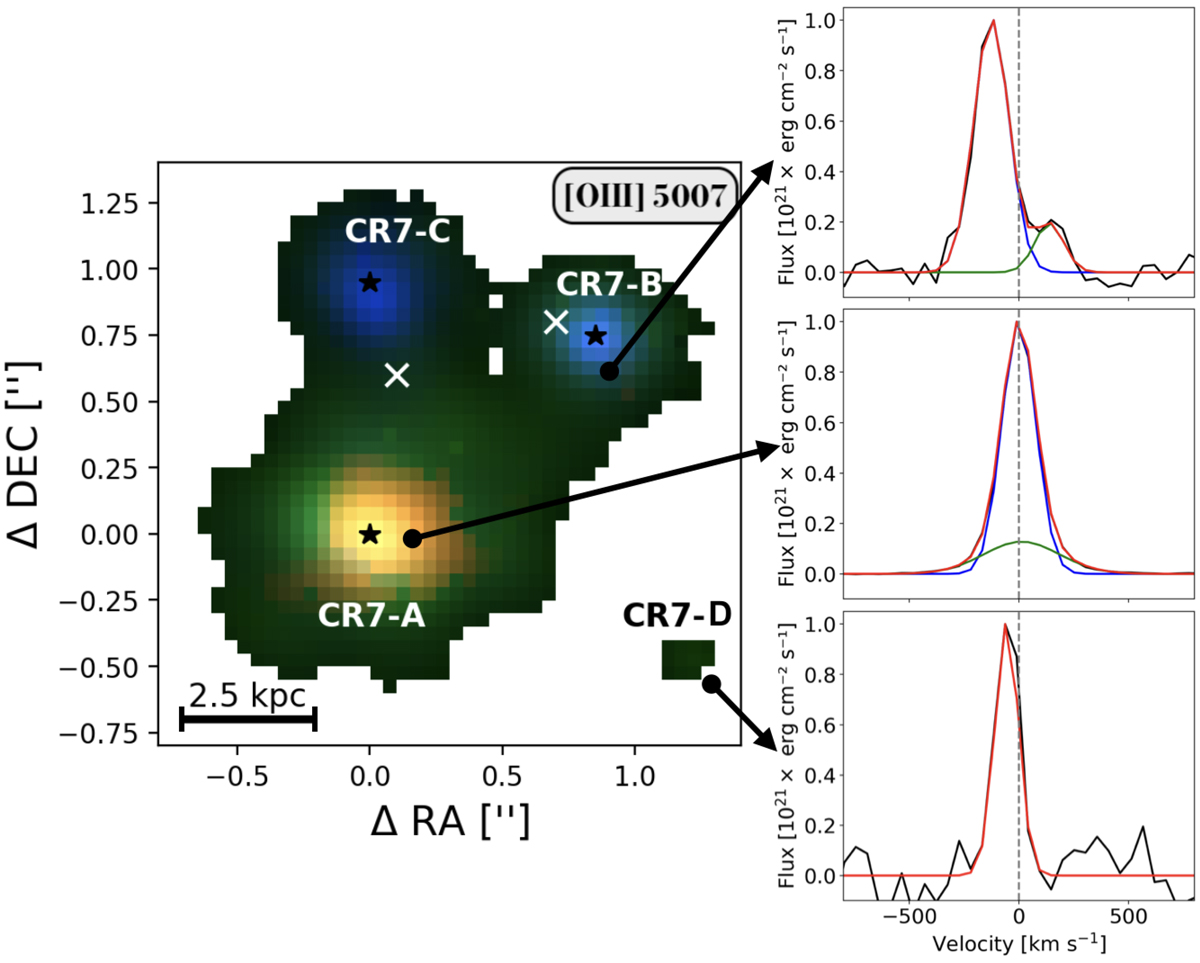
Three-colour emission line image of CR7 derived from the G395H data cube. The emission line maps are obtained by integrating the continuum-subtracted data-cube around the [O III]λ5007 emission line in the velocity ranges v ≤ – 150 km s−1 (blue), – 150 km s−1 ≤ v ≤ 150 km s−1 (green) and v ≥ 150 km s−1 (red), with respect to the systemic redshift z = 6.60425 (see Sect. 3.3). The black stars mark the positions of the three main components shown in Fig. 1. White crosses mark the positions of the two brightest additional [C II]λ158μm components detected by Matthee et al. (2017a). The right panels show the normalised [O III]λ5007 line profile (black), with the best-fit multi-Gaussian fit (red) composed of the narrow (blue) and broad (green) components, extracted from circular apertures of 0.1 ″ in radius.
Current usage metrics show cumulative count of Article Views (full-text article views including HTML views, PDF and ePub downloads, according to the available data) and Abstracts Views on Vision4Press platform.
Data correspond to usage on the plateform after 2015. The current usage metrics is available 48-96 hours after online publication and is updated daily on week days.
Initial download of the metrics may take a while.


