Fig. 11.
Download original image
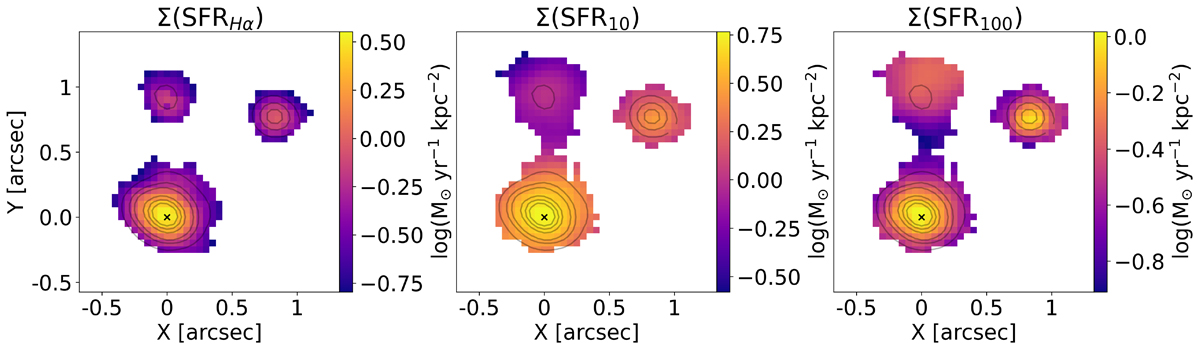
CR7 properties derived from the emission line and SED fitting of the low-resolution data cube. From left to right, the surface SFR density derived from the Hα spatially resolved emission (see Eq. (3.6.1)) and the SFR within the past 10 Myr and 100 Myr derived with prospector are shown (see Sect. 3.6). Black contours are arbitrary [O III]λ5007 flux levels.
Current usage metrics show cumulative count of Article Views (full-text article views including HTML views, PDF and ePub downloads, according to the available data) and Abstracts Views on Vision4Press platform.
Data correspond to usage on the plateform after 2015. The current usage metrics is available 48-96 hours after online publication and is updated daily on week days.
Initial download of the metrics may take a while.