Open Access
Fig. 9.
Download original image
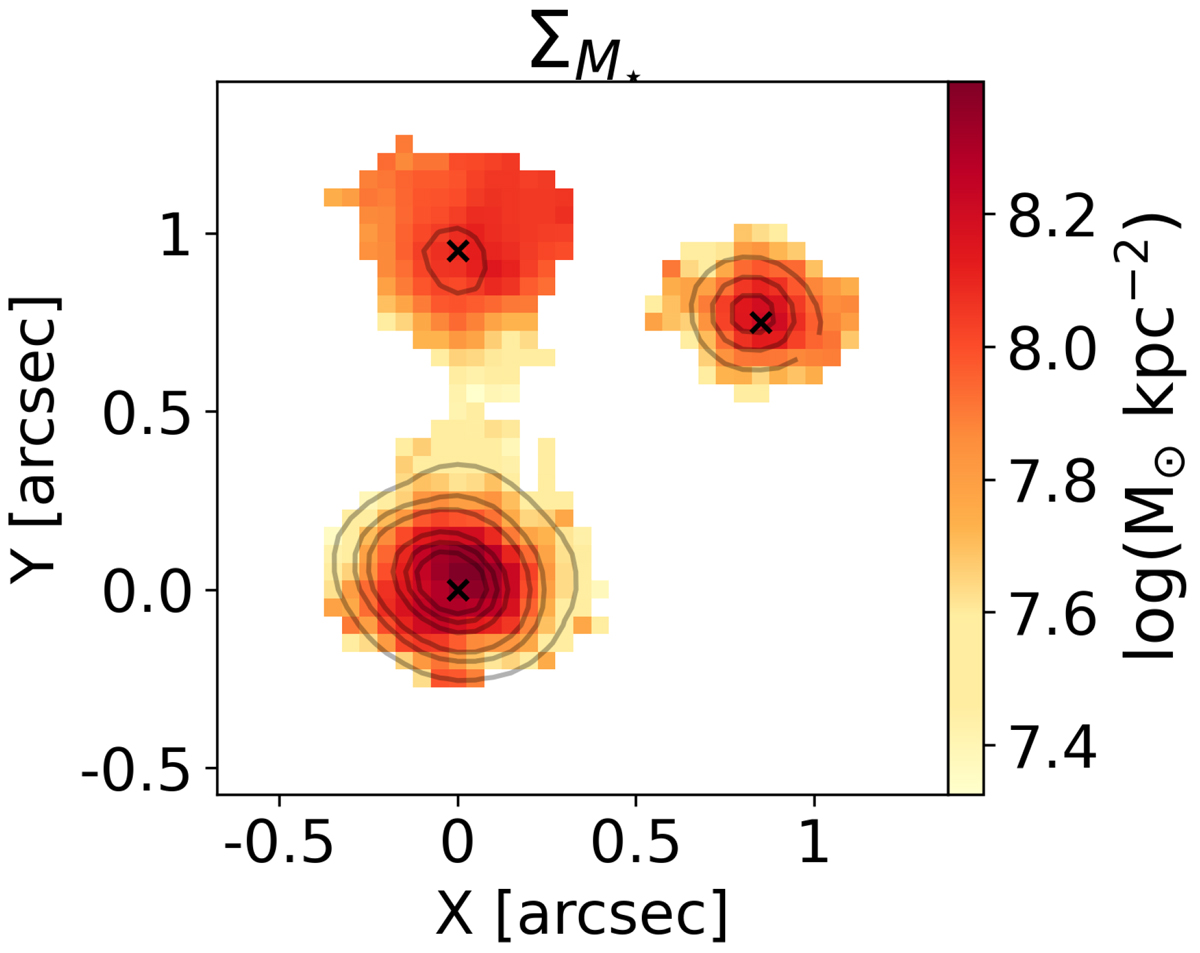
Map of the stellar mass surface density derived with PROSPECTOR. The black crosses mark the positions of the three UV bright components of CR7. Black contours are arbitrary [O III]λ5007 flux levels.
Current usage metrics show cumulative count of Article Views (full-text article views including HTML views, PDF and ePub downloads, according to the available data) and Abstracts Views on Vision4Press platform.
Data correspond to usage on the plateform after 2015. The current usage metrics is available 48-96 hours after online publication and is updated daily on week days.
Initial download of the metrics may take a while.