Fig. 4.
Download original image
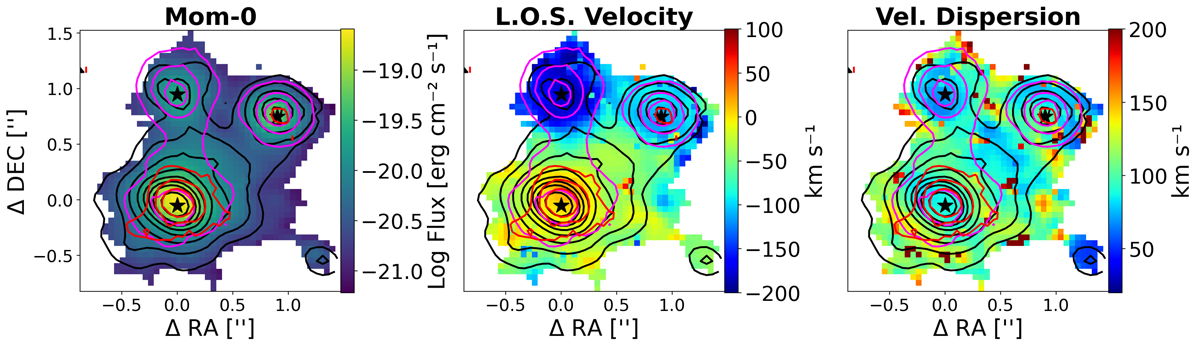
Moment maps of [O III]λ5007 from G395H data. From left to right, the integrated emission line flux in logarithmic scale, the flux-weighted LOS velocity, and the velocity dispersion maps are shown. All moment maps are calculated from the total best-fit model. Contours highlight the blueshifted emission v ≤ – 150 km s−1 (magenta), – 150 km s−1 ≤ v ≤ 150 km s−1 (black), and redshifted v ≥ 150 km s−1 (red), with respect to the systemic velocity of CR7-A defined by the redshift z = 6.60425 (see Sect. 3.3). Moment maps are masked when the S/N is less than five. The black stars mark the positions of the three main components and are labelled in the left panel for clarity. North is up, east to the left.
Current usage metrics show cumulative count of Article Views (full-text article views including HTML views, PDF and ePub downloads, according to the available data) and Abstracts Views on Vision4Press platform.
Data correspond to usage on the plateform after 2015. The current usage metrics is available 48-96 hours after online publication and is updated daily on week days.
Initial download of the metrics may take a while.