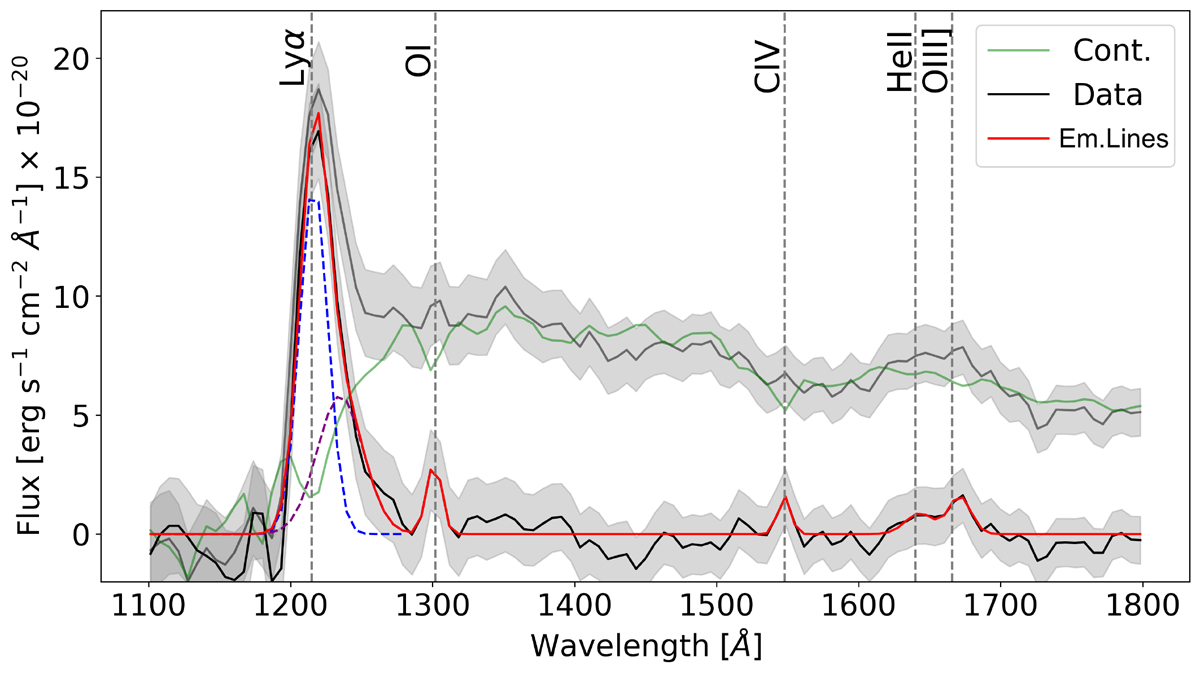
Fig. 8.
Download original image
Fit of the integrated R100 spectrum of CR7-A extracted from the aperture shown in Fig. 1 and focused on the wavelength range between 1100–1800 Å rest-frame. Data before and after continuum subtraction are in grey and solid black, respectively. Single Gaussians used to fit the Lyα emission line are in dashed blue and purple. Best-fit continuum and emission line models are in green and red, respectively. (For details of the spectrum fit see Sect. 3.6.)
Current usage metrics show cumulative count of Article Views (full-text article views including HTML views, PDF and ePub downloads, according to the available data) and Abstracts Views on Vision4Press platform.
Data correspond to usage on the plateform after 2015. The current usage metrics is available 48-96 hours after online publication and is updated daily on week days.
Initial download of the metrics may take a while.