| Issue |
A&A
Volume 687, July 2024
|
|
|---|---|---|
| Article Number | A270 | |
| Number of page(s) | 14 | |
| Section | Cosmology (including clusters of galaxies) | |
| DOI | https://doi.org/10.1051/0004-6361/202449872 | |
| Published online | 18 July 2024 | |
Dianoga SIDM: Galaxy cluster self-interacting dark matter simulations
1
INAF-Osservatorio di Astrofisica e Scienza dello Spazio di Bologna, Via Piero Gobetti 93/3, 40129 Bologna, Italy
e-mail: This email address is being protected from spambots. You need JavaScript enabled to view it.
2
Dipartimento di Fisica e Astronomia “Augusto Righi”, Alma Mater Studiorum Università di Bologna, Via Gobetti 93/2, 40129 Bologna, Italy
3
IFPU – Institute for Fundamental Physics of the Universe, Via Beirut 2, 34014 Trieste, Italy
4
INFN-Sezione di Bologna, Viale Berti Pichat 6/2, 40127 Bologna, Italy
5
Universitäts-Sternwarte, Fakultät für Physik, Ludwig-Maximilians-Universität München, Scheinerstr. 1, 81679 München, Germany
6
Max-Planck-Institut für Astrophysik, Karl-Schwarzschild-Str. 1, 85748 Garching, Germany
7
Excellence Cluster ORIGINS, Boltzmannstrasse 2, 85748 Garching, Germany
Received:
6
March
2024
Accepted:
10
May
2024
Abstract
Context. Self-interacting dark matter (SIDM) can tackle or alleviate small-scale issues within the cosmological standard model ΛCDM, and diverse flavours of SIDM can produce unique astrophysical predictions, resulting in different possible signatures which can be used to test these models with dedicated observations of galaxy clusters.
Aims. This work aims to assess the impact of dark matter self-interactions on the properties of galaxy clusters. In particular, the goal is to study the angular dependence of the cross section by testing rare (large angle scattering) and frequent (small angle scattering) SIDM models with velocity-dependent cross sections.
Methods. We re-simulated six galaxy cluster zoom-in initial conditions with a dark matter-only run and with full-physics set-up simulations that include a self-consistent treatment of baryon physics. We tested the dark matter-only setup and the full physics setup with the collisionless cold dark matter, rare self-interacting dark matter, and frequent self-interacting dark matter models. We then studied their matter density profiles as well as their subhalo population.
Results. Our dark matter-only SIDM simulations agree with theoretical models, and when baryons are included in simulations, our SIDM models substantially increase the central density of galaxy cluster cores compared to full-physics simulations using collisionless dark matter. SIDM subhalo suppression in full-physics simulations is milder compared to the one found in the dark matter-only simulations because of the cuspier baryonic potential that prevents subhalo disruption. Moreover, SIDM with small-angle scattering significantly suppresses a larger number of subhaloes compared to large-angle scattering SIDM models. Additionally, SIDM models generate a broader range of subhalo concentration values, including a tail of more diffuse subhaloes in the outskirts of galaxy clusters and a population of more compact subhaloes in the cluster cores.
Key words: methods: numerical / galaxies: clusters: general / dark matter
© The Authors 2024
 Open Access article, published by EDP Sciences, under the terms of the Creative Commons Attribution License (https://creativecommons.org/licenses/by/4.0), which permits unrestricted use, distribution, and reproduction in any medium, provided the original work is properly cited.
This article is published in open access under the Subscribe to Open model. This email address is being protected from spambots. You need JavaScript enabled to view it. to support open access publication.
1. Introduction
Galaxy clusters, recognised as the most extensive gravitationally bound systems of galaxies (see Kravtsov & Borgani 2012, for a comprehensive review), play a pivotal role as cosmic laboratories for investigating the large-scale structures within our Universe. The underlying cosmological model impacts their masses (Tinker et al. 2008; Spergel & Steinhardt 2000; Despali et al. 2016; Despali & Vegetti 2017), their lensing signal (Natarajan & Kneib 1997; Moore et al. 1998), the abundance of the substructures within them (Tormen et al. 1998; Natarajan & Springel 2004), and their concentration (Giocoli et al. 2012, 2013; Ragagnin et al. 2021).
The current standard concordance cosmological model ΛCDM assumes the presence of a cosmological constant and a type of dark matter (DM) that is cold and collisionless. Numerical simulations performed within this paradigm currently show tension with observational data. For instance simulations of galaxy cluster cores (as in Meneghetti et al. 2020) reveal subhaloes that are considerably less compact than their observed counterparts (as illustrated in Bergamini et al. 2019; Granata et al. 2022).
Specifically, the galaxy-galaxy strong lensing (GGSL) signal resulting from simulated substructures of mass M ≈ 1011 M⊙ can be up to a factor of two lower than observed values (Meneghetti et al. 2022, 2023; Ragagnin et al. 2022). Concerning the higher-mass range of satellites (M > 1011 M⊙), hydrodynamic simulations can indeed reproduce high-mass subhaloes with compactness as high as the one from scaling relations (see the simulations presented in Bahé 2021; Robertson 2021). This can be achieved, for instance, by assuming particularly low active galactic nuclei (AGN) efficiencies. However, it is noteworthy that the lensing signal derived from observational data is predominantly influenced by satellites with lower masses (Ragagnin et al. 2022). The study conducted by Ragagnin et al. (2022) indicates that relying solely on AGN physics does not allow for a solution to be found for the compactness mismatch without compromising the consistency with observed properties related to stellar mass.
Furthermore, ΛCDM simulations face challenges in reproducing ultra-diffuse galaxies (UDGs, as studied by van Dokkum et al. 2015; Mowla et al. 2017; Greco et al. 2018), whose origin and low concentration parameter may be explained by satellites with cored DM profiles (Carleton et al. 2019). Although baryonic processes can also play a crucial role in lowering subhalo compactness (Di Cintio et al. 2019), ΛCDM simulations still fall short in reproducing the low circular velocity of UDG haloes (see Sales et al. 2020, particularly their Fig. 5).
In this paper, we explore the impact of a type of DM that is not collisionless. In particular, we studied self-interacting DM (SIDM, Spergel & Steinhardt 2000) in the context of hydrodynamical simulations of galaxy clusters. Motivated by particle physics, SIDM models consider interactions between DM elementary particles and a massive mediator through, for instance, a Yukawa potential (Feng et al. 2010; Loeb & Weiner 2011; Tulin et al. 2013). SIDM maintains the theoretical expectations of cold and collisionless DM at large scales while significantly influencing subhalo properties, see, for example, Spergel & Steinhardt (2000), Tulin & Yu (2018), Adhikari et al. (2022), Mastromarino et al. (2023), resulting in objects with a broader range in the concentration parameter compared to collisionless CDM.
Notably, DM self-interactions smooth out the density distribution in the central regions of DM subhaloes, leading to profiles that are more cored than their collisionless counterparts, lowering the subhalo compactness (see, for instance, Carleton et al. 2019; Nadler et al. 2023; Kong et al. 2022). Moreover, SIDM subhaloes that formed with an initially high concentration eventually reveal, after the core expansion reaches its minimum, a core-collapse stage that makes them much more compact than their analogues in the ΛCDM model (Outmezguine et al. 2023; Zeng et al. 2022), thus explaining the excess of subhalo compactness observed in galaxy clusters (Yang & Yu 2021).
In this work, we compare two classes of SIDM models. The first is the so-called rare SIDM (rSIDM) model, which refers to differential cross sections with typical scattering angles that are large. We consider rSIDM with an isotropic cross section. Many previous studies have investigated isotropic cross sections in the literature (see e.g. Vogelsberger et al. 2012; Robertson et al. 2019; Despali et al. 2019; Correa 2021; Mastromarino et al. 2023). The second model is the so-called frequent SIDM (fSIDM, Fischer et al. 2021) model, which assumes small-angle scattering, in the limit of keeping the momentum transfer cross section fixed but decreasing the scattering angles. Under these conditions, scattering events are much more frequent in the fSIDM than in the rSIDM model, which motivates the prefixes of frequent and rare. Simulations with a self-consistent treatment of baryonic physics (hereafter FP, as full physics) are necessary to properly study and capture the evolution of galaxy cluster substructures (Kimmig et al. 2023). Therefore, in this work, we plan to re-simulate our galaxy clusters, both considering DM only (DMO) and FP ones.
The studies of Sagunski et al. (2021), Andrade et al. (2022), Harvey et al. (2019), and Eckert et al. (2022) established a lower limit on the impact of SIDM on cluster scales. Specifically, considering that clusters adhere to an Einasto profile (Einasto 1965), the work of Eckert et al. (2022) shows that the total cross section per unit DM particle mass mχ should be constrained to σ/mχ < 0.19 g−1 cm2. This value is notably low when compared to the typical values found in theoretical studies, which hover around σ/mχ ≈ 1 g−1 cm2 as used in Mastromarino et al. (2023).
While this might initially appear as a challenge for SIDM, it is important to note that elementary particle interactions, such as those governed by the Yukawa potential, exhibit cross sections which depend on the relative velocity of the particles. The cross section decreases as a function of the relative velocity, making it applicable for constraining both the possibly high value required in dwarf spheroidal profiles and the low one expected from group cores (Correa 2021). Consequently, in this study, our focus will be solely on SIDM models with a velocity-dependent cross section.
The paper is structured as follows: we present our suite of zoom-in simulations with collisionless DM and SIDM in Sect. 2; we investigate the overall DM distribution in the cluster cores in Sect. 3; we study the cluster subhalo population in Sect. 4; we draw our conclusions in Sect. 5. Throughout this paper, we use the term “collisionless” to describe the cold and collisionless DM assumed in the standard ΛCDM, distinguishing it from SIDM, which is also a type of cold DM.
2. Numerical setup
Our simulations are performed using OpenGadget3, a code derived from P-Gadget3, a successor of P-Gadget2 (Springel 2005). The initial conditions mirror those employed in the Dianoga simulations (as utilised, for instance, in Bonafede et al. 2011; Rasia et al. 2015). These conditions are generated from a parent DMO box with a side length of 1 comoving h−1 Gpc and are specifically tailored for conducting hydrodynamic simulations of galaxy clusters. The power spectrum assumed in the parent box corresponds to a ΛCDM model with cosmological parameters Ωm = 0.241, Ωb = 0.04, ns = 0.96, σ8 = 0.8, and h = 0.72. In this work, we re-simulated the initial conditions for six galaxy cluster regions2 that encompass virial masses in the range 1014 − 1015 M⊙ and analyse the results in 15 redshift slices between z = 0.2 − 0.63.
We maintain the same resolution level as presented in Ragagnin et al. (2022). Specifically our simulations employ a gravitational softening of ϵDM = 3.7 h−1 ckpc for DM particles and ϵ⋆ = 2.0 h−1 ckpc as the softening parameter for stellar gravitational interactions. The DM particle masses are set to mDM = 8.3 × 10⁸ h−1 M⊙.
2.1. Baryon physics
To follow the baryon physics, we simulate the hydrodynamics of gas using an enhanced smoothed particle hydrodynamics (SPH) solver presented in Beck et al. (2016)4. The stellar evolution scheme from Tornatore et al. (2007) which follows 11 chemical elements (H, He, C, N, O, Ne, Mg, Si, S, Ca, Fe) with input cooling tables generated using the CLOUDY photo-ionisation code (Ferland et al. 1998). For a comprehensive understanding of the modelling of supermassive black holes and energy feedback, readers can refer to Springel et al. (2005), Fabjan et al. (2010) and Hirschmann et al. (2014), where prescriptions for black hole growth and feedback from AGNs are thoroughly described. The identification of haloes and their member galaxies is accomplished using the friends-of-friends halo finder (Davis et al. 1985) and an improved version of the subhalo finder SUBFIND (Springel et al. 2001), which accounts for the presence of baryons (Dolag et al. 2009).
Our feedback scheme is based on the Magneticum subgrid physics model (e.g. Teklu et al. 2015). The Magneticum AGN model is derived from Hirschmann et al. (2014) and, with a calibration similar to the Magneticum suite of simulations, we set a radiative efficiency of ϵr = 0.2 to regulate the luminosity of the radiative component, and we set the feedback energy per unit time to have a contribution of ϵf = 0.075 of the luminosity, as detailed in Eqs. (7)–(12) in Steinborn et al. (2015).
2.2. Dark matter models
As mentioned in the introduction, we test three models of cold DM; in addition to the standard collisionless DM, we explore the SIDM models implemented in Fischer et al. (2024a): rSIDM and fSIDM. Our rSIDM model is similar to the most widely used variation of the model used in the literature, where the scattering is isotropic, while fSIDM applies in the regime of small-angle scattering. The two models can alter the DM distribution in different ways, with fSIDM being more efficient in generating DM-galaxy offsets during mergers because of its small-angle dependency (Fischer et al. 2021). We use the implementation presented in Fischer et al. (2021, 2022), a technique that relies on describing the self-interaction between DM particles through an effective drag force, as presented in Kahlhoefer et al. (2014). The implementation considers scattering that is elastic in contrast to inelastic or dissipative SIDM models.
In our SIDM models, DM interactions occur via a light-scalar mediator or a Yukawa potential. In this work, we use a functional form of the velocity-dependent cross section σ(v), that is a simplified version of the corresponding Born approximation. We express our momentum transfer cross section σT as
 (1)
(1)
Here, mχ is the DM particle mass, v represents the relative velocity between particles, σT0 denotes a low-velocity plateau normalisation, and vc represents the knee position before a v−4 dependency of the cross section comes into play.
We choose the parameters σT0 and vc in order for the cross section to impact mainly low mass subhaloes (thus σ must be high for objects with mass M < 2 × 10¹⁰ M⊙). Moreover, we want the cross section to be relatively small for high mass subhaloes (for masses as M > 4 × 10¹¹ M⊙, as we are not interested in modifying their properties), and it has to be negligible at cluster scales.
Given these constraints we decided to use the functional form of Eq. (1) with σT0/mχ = 40 g−1 cm2 and vc = 200 km s−1, similar to the constraints from dwarf spheroidal galaxies proposed in Correa (2021). In Fig. 1, we present our velocity-dependent cross section, together with the relevant mass scales. Here it is easy to appreciate the decreasing importance of the cross section for increasing object masses: small subhaloes (v ≈ 100 km s−1) will be greatly impacted by SIDM (σ/mχ ≈ 40 cm2 g−1), while galaxy clusters (v ≈ 1000 km s−1) will be only slightly affected by SIDM (σ/mχ ≲ 0.1 cm2 g−1).
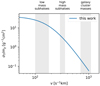 |
Fig. 1. SIDM cross section as in Eq. (1). The blue curve reports the cross section with the parameters chosen for this work (σT0 = 40 g−1 cm2 and v0 = 200 km s−1). Vertical shaded area corresponds to the median velocity dispersion for low mass subhaloes (M < 2 × 10¹⁰ M⊙) in cluster cores, high mass subhaloes (M > 4 × 10¹¹ M⊙) in cluster cores, and the typical velocity dispersion for haloes with Mvir ∈ [2 − 10]×1014 M⊙. |
2.3. Halo sample
We re-simulate the initial conditions of the regions with DMO and FP simulations and with three DM types: collisionless DM, rSIDM (in our case referring to an isotropic cross section), and fSIDM, which means that each galaxy cluster is resimulated six times. We report the main characteristics of our galaxy cluster sample masses and concentration at the lowest redshift available (z = 0.2) in Table 1. Here, we estimate the dynamical state of haloes by computing the so-called concentration parameter (which is known to be a good proxy for it, see e.g. Ludlow et al. 2012), with objects with higher concentration being mostly early formed and more relaxed. We compute the concentration parameter by assuming a Navarro–Frank–White (NFW, Navarro et al. 1997) profile ρNFW so that
 (2)
(2)
Regions re-simulated in this work.
where ρ0 and rs are free parameters and the concentration is defined as c ≡ Rvir/rs5. We see that our haloes have concentrations in the range c ∈ [2.8, 5.5] (we used the predictions from Ragagnin et al. 2021). It is important to note that region D5 has a higher than average concentration, implying that it is a relaxed system (Ludlow et al. 2012). We report the concentration for both the DMO and FP runs as they are known to differ (see e.g. Duffy et al. 2010), with DMO concentration being slightly lower than FP concentration. Regarding the concentration difference between collisionless DM and SIDM, we found no significant changes as expected SIDM affect the matter distribution mainly on small scales.
Figure 2 shows the projected density maps of the central region (where SIDM has the most impact) of the most massive region (D16) at z = 0.2 for the corresponding six re-simulations (three DM models with and without baryon physics). The central halo of collisionless DMO simulations is visually more dense with respect to the SIDM counterparts (both frequent and rare). Moving from DMO to FP, we note that the introduction of baryons produces rounder haloes and more peaked central regions as well as their substructures, independently of the DM model. Visually, we notice that in general, SIDM models tend to have substructures that are displaced differently compared to the CDM model due to the expected different trajectories during mergers (as shown in Sabarish et al. 2024).
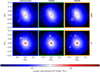 |
Fig. 2. Projected density maps of central region (within r < 0.15 Rvir) of the D16 region re-simulations at our lowest redshift slice of z = 0.2. The upper row shows DMO simulations, while the bottom row refers to FP simulations. Columns from left to right show collisionless DM simulations, rSIDM simulations, and fSIDM simulations, respectively. |
3. Galaxy cluster matter density profiles
In this section, we concentrate on the distribution of matter and subhaloes within the cluster cores, specifically within a cluster-centric distance r < 0.15 Rvir. The reason behind this choice is twofold: on these small scales, the effect of SIDM is expected to be largest, as it is a region sensitive to the nature of DM models (see, e.g. Natarajan et al. 2007; Yang & Yu 2021); moreover, this is the typical field of view of galaxy-galaxy strong lensing analyses from Hubble Frontier Field data (see, e.g. Bergamini et al. 2019; Granata et al. 2022, 2023).
Figure 3 presents the stacked density profiles within the central regions of our DMO simulations, encompassing redshift slices between 0.2 < z < 0.6. Given the broad virial mass range across our six regions, we opted to stack all haloes together by rescaling their profiles using the virial radius and virial mass. As expected, SIDM simulations yield cored profiles (see, e.g. Kamada & Kim 2020), in particular, our SIDM DMO simulations form a core at radii r < 2 × 10⁻² Rvir. The ratio between collisionless and self-interacting DM (see bottom panel of Fig. 3) becomes significantly different from unity at cluster centric distances ≲2 × 10⁻² Rvir (approximately corresponding to a cluster-centric distance of ≈100 kpc). It is worth noting that the profiles are different at distances larger than the fiducial DM softening (2.8ϵDM, indicated by the grey vertical band). Consequently, we can conclude that in DMO SIDM simulations, both SIDM models produce indistinguishable core features, and the impact of SIDM extends across the entire cluster of central regions, with both SIDM variants (rSIDM and fSIDM) exhibiting ≈20%−40% lower density compared to collisionless DM.
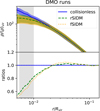 |
Fig. 3. Comparison between stacked central density profile in the DMO runs. We report collisionless DM density profile as a blue solid line, rSIDM as a green dashed line, and fSIDM as an orange dotted line (note that rSIDM and fSIDM lines almost overlap visually). Shaded areas correspond to one standard deviation of the six regions. The upper panel shows the central density, normalised by the average density at Rvir for our six regions, while the bottom panel shows the ratio between the profiles of the SIDM runs and the collisionless DM runs. The grey shaded area covers one standard deviation around the fractional fiducial DM softening 2.8 × ϵ/Rvir. |
We present results for the FP simulations in Fig. 4 (top row), where the stacked density profiles of DM, stellar, and total density for our six Dianoga regions are shown. We note that similar to the case of DMO simulations, cluster central profiles exhibit remarkable similarity between rSIDM and fSIDM. As we show in the next section, their differences are primarily maximised in the properties of the satellite population. Notably, both rare and frequent scenarios tend to exhibit DM central densities that are more pronounced than those observed in the corresponding FP collisionless DM simulations. Notice that Robertson et al. (2019) reported an opposing result, demonstrating that their hydrodynamic SIDM simulations produced cluster cores that, while less cored than the DMO run, still retained a degree of core structure compared to the collisionless run. The reason for this difference remains unclear. In fact, the value of σ(v)/mχ at cluster scale velocity dispersion (e.g. v = 103 km s−1) is higher in their simulations (see their Fig. 1). Noteworthy, the increase of density happens at scales (r ≲ 10−2 Rrvir) that are below the range of their plot (r > 20 − 30 kpc ≈ 2 × 10⁻² Rrvir). We can speculate that, since this happens in a region where the cluster density profile is dominated by the stellar component, and since the central potential is known to impact the central density evolution (see e.g. Elbert et al. 2018), then the different results may be attributed to the high central baryon density that we find in our clusters.
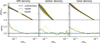 |
Fig. 4. Comparison between stacked central density profiles in the FP runs. DM models are represented as in Fig. 3. Columns refer to the results for DM, stellar, and total matter components, respectively. Upper panels show DM density profiles, while lower panels show the ratio with respect to the collisionless DM profiles. The grey shaded area represents one standard deviation around the fractional fiducial stellar softening 2.8 × ϵ⋆/Rvir. |
To verify this statement, we conduct the following two analyses: (I) in order to ensure we have our FP collisionless DM profile under control in Sect. 3.1 we first verify that the increased DM cuspiness in collisionless DM runs is due to adiabatic contraction; then (II) in Sect. 3.2 we will compare our SIDM central densities with analytical models of gravothermal solutions of SIDM haloes in the literature to understand if our increased central density agrees with gravothermal evolution models.
3.1. Adiabatic contraction
FP simulations (compared to DMO ones) produce a heightened concentration of DM close to the cluster centre (as in Despali et al. 2020) due to adiabatic contraction (as found above and, for example, in Gnedin et al. 2004), where the baryon density in halo cores is high enough to generate a back reaction on the DM component and increase its central density significantly compared to DMO runs, see, for instance, Fig. 5 in Duffy et al. (2010).
In this subsection we will verify that we have under control the results of our collisionless DM simulations, we will use only collisionless DM runs (both FP and DMO), and estimate the contribution to the central baryon density from adiabatic contraction following the theoretical model proposed by Blumenthal et al. (1986). They derive that the halo radius r times mass within it is a constant, namely
![Mathematical equation: $$ \begin{aligned} r M_{\rm dm,i}({<}r) = r\left[M_{\rm dm,f}({ < }r) + M_{\rm b}\right], \end{aligned} $$](/articles/aa/full_html/2024/07/aa49872-24/aa49872-24-eq3.gif) (3)
(3)
where Mdm, i is the initial DM mass, Mdm, f is the final DM mass and Mb, f is the final baryon mass. In our work, we estimate Mdm, i as the DM mass from DMO runs, Mdm, f as the DM mass in the FP runs, and Mb, f as the baryon mass in the same FP runs. We cross-matched the DMO and FP masses of each halo in all available snapshots and computed the adiabatic contraction factor using the software contra (Gnedin et al. 2004).
We report our finding in Fig. 5 (top panel), where we show the stacked DM mass profile of our haloes from collisionless DM simulations from both the DMO and FP runs. The bottom panel of Fig. 5 reports their ratio together with the median prediction from the model by Blumenthal et al. (1986) for each of the cross-matched haloes (the size of the shaded area represents the error on the mean). We can see that the model by Blumenthal et al. (1986) correctly predicts the increased central density of the FP simulations, and we therefore confirmed that the increased DM density found in our collisionless FP (compared to collisionless DMO) simulations is due to adiabatic contraction produced by baryons.
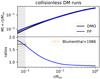 |
Fig. 5. Comparison between DM mass profiles of collisionless DM runs. The top panel shows the stacked DM mass profile of DMO runs (black) and FP runs (blue), while the bottom panel shows their ratio and the central value predicted by the adiabatic contraction model presented in Blumenthal et al. (1986) as light-orange shaded blue area. The vertical grey shaded area corresponds to one standard deviation of the DM gravitational softening. |
3.2. Gravothermal solution
We will compare the central density of our haloes with the gravothermal solution for SIDM haloes proposed in Yang et al. (2023). Their model is based on the assumption that the evolution of central density and core radius of SIDM NFW haloes can be described by a single parameter β once variables are rescaled as follows:  , radii by factor r0 = rs, densities by a factor ρ0 = ρs, and cross sections by a factor (σ/mχ)0 = 1/(ρsrs). We denote rescaled quantities with a hat.
We then estimate the core size of our DM haloes of SIDM simulations using the DM profile proposed in their Eq. (A.5), that is a quasi-NFW profile with a possible core radius rc and a truncation rout, namely
 (4)
(4)
where  is the re-scaled central density, and we use s = 2.19 as proposed by Yang & Yu (2021).
We note that the time rescaling factor t0 proposed by Yang et al. (2023) does not take into account that FP SIDM simulations have a much shorter evolution time compared to DMO ones (as shown in Zhong et al. 2023). Therefore, for FP simulations, we follow the approach of Zhong et al. (2023), and we rescale the time variable by combining Eqs. (15) and (16) in Zhong et al. (2023), namely by a factor of  , where Φ(0)DMO and Φ(0)FP are the central gravitational potential for the DMO and FP counterpart of a halo, and ρeff is an effective density that captures the contraction effect due to the baryonic potential. To this end, for each halo, we estimate ρeff as the central density of baryons, and we estimate it using their Eq. (17), namely ρeff ≈ ρs + αMb/(2πrsrh), where Mb is the baryon mass of the halo, and they set α = 0.4. Following their procedure, we compute rh by fitting an Hernquist (Hernquist 1990) profile to the baryonic component (see Appendix A for the fit details).
We then estimate the cross section acting on the galaxy cluster core by computing the effective cross section σeff similarly to Yang & Yu (2022), where the average cross section is weighted with fifth power of the velocity and assuming that the velocities are well described by a Maxwell-Boltzmann distribution (with a characteristic velocity  , see their Eq. (4.2)):
 (5)
(5)
where σv is the viscosity cross section given by
 (6)
(6)
We compute the rescaled time variable  as proposed in Yang et al. (2023), where β is the free parameter of their model that should vary around one; therefore we keep it as β = 1 for simplicity. In Fig. 6 we compare our DM central densities
  for both the DMO (grey stars) and FP (red circles) SIDM runs with the prediction of
  from Yang et al. (2023). We can see that DMO
  lies in the core-formation phase of Yang et al. (2023) central density evolution, namely in the left part of the plot.
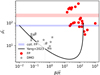 |
Fig. 6. Rescaled DM central density |


For what concerns the FP simulation, we present mean values (with their one standard deviation) for  in the case of SIDM (red shaded area) and collisionless FP (blue shaded area) simulations. The mean value of
  for collisionless FP simulations exceeds the corresponding value in the case of DMO, consistently with expectations from adiabatic contraction. On the other hand, the SIDM FP values of
  are higher than the central densities found in collisionless DM FP simulations. This increase is due to the baryonic potential even if the haloes are not in a core-collapse phase. In support of this hypothesis, we illustrate the velocity dispersion profiles of our clusters in Fig. 7, which reveals that the central region of SIDM clusters exhibits an increasing profile. A halo that is undergoing a gravothermal collapse is expected to have a decreasing velocity dispersion profile, see for instance Fig. 2 in Yang et al. (2023). therefore, even if the profile is less steep than their collisionless FP counterpart, the FP SIDM clusters are still in their core formation phase (see Appendix A for more details on the density and velocity dispersion time evolution).
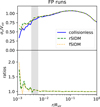 |
Fig. 7. Comparison between stacked velocity dispersion profiles. The top panel presents the stacked velocity dispersion profiles for our FP simulations of galaxy clusters in units of virial velocity |

4. Subhalo population
In this section, we analyse the subhalo population in the central regions of our simulated clusters. In particular, we focus first on comparing SIDM subhalo abundances, then we explore whether these values agree with theoretical models on tidal stripping, and finally, we study subhalo compactness as this has potential value for future lensing analyses.
4.1. Subhalo abundance
Our subhalo abundance analyses are specifically focused on subhaloes within a cluster-centric distance of < 0.15Rvir as the central part of the cluster is the one most affected by SIDM properties. Moreover, the central region of clusters is also relevant for strong lensing investigations, as highlighted in Meneghetti et al. (2023). However, more precise comparisons are needed in the future, for instance, considering projection effects and precise computation of the reduced shear to compare simulated and observed data correctly.
In the top panel of Fig. 8, we present the cumulative Subhalo Mass Function (SHMF) for our sample at low redshift in the DMO simulations. Notably, there is a pronounced suppression of low-mass subhaloes in these simulations. Satellite suppression is expected in SIDM simulations because of the enhanced self-interactions of satellites with the host (Nadler et al. 2020). In the remaining top panels of Fig. 8, we depict the FP SHMF and dissect it based on the different matter components, including stars and DM. The relative values of the cumulative mass function are presented in the bottom panels of Fig. 8, revealing that SIDM has a smaller impact on the subhalo population in FP simulations compared to DMO simulations. In general, the total DMO SHMF (leftmost panel) is much lower than the total FP SMHF (rightmost panel). The reason is that we are looking at subhaloes near the cluster centre, which are mainly post-stripping subhaloes. Since the DMO substructures should have a central density that is less steep than the FP simulations (because of the high density of baryons at the centre), we expect a larger suppression in DMO subhaloes (Peñarrubia et al. 2010). The suppression of satellites in DMO simulations can be substantial, reaching approximately ≈50% for rSIDM runs and going as high as ≈65% for fSIDM simulations. In FP simulations, the suppression of satellites is more moderate, though still significant, with approximately ≈10% for rSIDM and ≈25% for fSIDM in terms of total masses. An increased suppression of satellites in fSIDM models compared to rSIDM is expected; see, for instance, Fischer et al. (2022); Fischer et al. (2024a). In general, the smaller satellite suppression produced by SIDM in FP simulations is due to the presence of a stellar component that makes subhaloes more resistant to disruption.
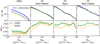 |
Fig. 8. Cumulative SHMFs in units of the virial mass for subhaloes with a cluster centric distance < 0.15 Rvir. The leftmost panel focus on DMO run with collisionless DM and rare and frequent SIDM; the other panels refer to FP simulations and show the results for different mass components: from left to right, DM, stellar matter and total matter. Colours and line styles are as in Fig. 3. The panels in the bottom row show the ratio between the SHMFs in the SIDM models and the one for the collisionless DM model. The shaded area corresponds to one standard deviation of the mean value. |
4.2. Tidal stripping
We now investigate the subhalo suppression that we found in SIDM simulations in the light of other theoretical studies. In particular, we want to test if this suppression of substructures is consistent with theoretical works as Peñarrubia et al. (2010), which shows that the suppression details are strongly dependent on the inner log-slope γ of their matter profiles.
In the left panel of Fig. 9, we present the stacked cumulative density profiles of subhaloes in the outskirt of galaxy clusters (outside r > 0.5 Rvir) for our three DM models in DMO simulations, that we assume to be in an infalling phase. We fitted the internal log-slope of the total matter profile and assume it equals to (3 − γ) between the softening and 20 ckpc. We opted for this radial range because it is large enough to capture the internal log-slope and small enough not to encounter the flattening in the tail of the profile. To show that our radial range is small, we over-plot the mean half mass radius as vertical lines, where we can notice that they are larger than 20 ckpc. We can see that the DMO collisionless run has γ ≈ 1, which corresponds to an NFW-like core, as expected from theory. The DMO SIDM runs have a significantly lower profile, with fSIDM having a flatter profile than rSIDM, in agreement with the SHMF that we presented in Fig. 8, where fSIDM has a larger suppression than rSIDM.
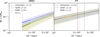 |
Fig. 9. Stacked cumulative matter profiles of subhaloes in the outskirts of galaxy clusters (outside r > 0.5 Rvir), for DMO (left panel) and FP (right panel) simulations for collisionless (dotted blue lines), rSIDM (dashed green line), and fSIDM (dotted orange line) models. The solid lines show the profile fitted in the internal region (r < 20 ckpc). The labels also report the value of the fit of the NFW external logslope parameter γ. The vertical dashed lines correspond to the mean half-mass radius. |
In the right panel of Fig. 9, we present the same results but for FP simulations. Our γ values correspond to a cusp (as expected, baryons dominate the central part), and both SIDM and collisionless runs have very close values that are in agreement with the much milder SIDM suppression of satellites that we found in the SHMF shown in Fig. 8. It is important to stress that here we are looking at a subhalo population (that is, in the cluster outskirt) that is different with respect to the one studied in the previous section (on the SHMF, which was in cluster cores).
The significant subhalo suppression of fSIDM with respect to rSIDM in FP simulations may be due to a different effect than tidal stripping; in fact, the two models have similar density profiles (see Fig. 9). Therefore, one can speculate that the different SMHFs could be attributed to the differences in the host potential (Peñarrubia et al. 2010); the fact that the tests performed in Peñarrubia et al. (2010) assume a static host halo; or the effect of DM self-interactions between the infalling subhalo and the host.
4.3. Subhaloes compactness
We will now investigate how SIDM impacts the compactness of subhaloes in galaxy cluster cores, as it is the region that is most affected by SIDM. The work of Peñarrubia et al. (2010) shows that the circular velocity of cuspy subhaloes that infall in clusters is affected much less than one of cored subhaloes (see the upper panel of their Fig. 6). As central substructures are supposed to experience earlier infall, it is expected that they would have undergone substantial DM loss while maintaining a circular velocity closely resembling that at the time of infall. The net consequence of this mechanism is an increased circular velocity at fixed subhalo mass.
To verify this, we present the circular velocity profiles in Fig. 10. We observe an increase in the circular velocity of SIDM Vcirc (up to approximately ≈20%−30%) with respect to the collisionless DM Vmax. In order to understand the mechanism that increased the compactness of these low-mass subhaloes, we dissect them and analyse the circular velocity profiles of their stellar (central column) and DM component (right column). Here, it is clear that the circular velocity stellar component of the SIDM runs is higher than that of collisionless DM runs. To prove this point better, in Fig. 11, we show the subhalo maximum of circular velocity (upper panels) and stellar fraction (lower panels) versus MSH mean relations for each of our six re-simulated regions
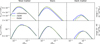 |
Fig. 10. Circular velocity profiles for FP simulations with a cluster centric distance < 0.15 Rvir. Each column shows a different matter component: total matter on the left, stellar component in the middle and the DM component on the right. Top panel: low mass regime [1, 2]×1010 h−1 M⊙, bottom panel: high mass regime [10, 40]×1010 h−1 M⊙. Line styles are as in Fig. 3. |
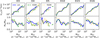 |
Fig. 11. Subhalo compactness and stellar fraction for subhaloes for cluster centric distances < 0.15 Rvir. The upper panels show the average circular velocity per subhalo mass bin, while the bottom panels refer to the stellar fraction. Each column reports the results for a given re-simulated region (see Table 1). Colour codes and line styles are as in Fig. 3. |
Therefore, we confirm that the increase in the circular velocity of subhaloes in SIDM simulations is associated with an increase in the stellar fraction. In particular, tidal stripping lowers the total mass while the circular velocity decreases only slightly, therefore bringing the data points closer to the observational scaling relation from Bergamini et al. (2019).
It is interesting to note in Fig. 10 that SIDM can produce subhaloes with higher compactness in the low-mass regime of subhaloes. This result reduces the tension between observed and simulated low-mass subhalo compactness Ragagnin et al. (2022) without changing baryon physics.
We now tackle the problem of the BCG stellar masses being overly massive compared to observations. To this end, in Fig. 12, we show the BCG stellar mass vs. the total mass of the halo, where we see that the mass of the BCG is only slightly affected by the inclusion of SIDM models. This is mainly related to the BCG being supposedly accreted by ex situ material (see, e.g. Montenegro-Taborda et al. 2023). If subhaloes formed their stars in the field, then the subhalo stellar mass would be influenced very little by SIDM.
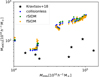 |
Fig. 12. Stellar mass of the BCG as a function of the halo mass M200c. The colour data points are the same as in Fig. 3. The black stars represent points from Kravtsov et al. (2018). |
4.4. Subhaloes with low circular velocity
In this section, we examine how SIDM models impact the low-concentration tail of subhaloes. To investigate this, we analyse the distribution of Vmax for subhaloes within the mass range [1, 2]×1010 h−1 M⊙ and located between 0.15 Rvir and Rvir. We exclude subhaloes in the central regions of clusters, as we are aware from Sect. 4.3 that stripping in this region may result in higher compactness. In Fig. 13, we present the PDF of Vmax for these subhaloes, revealing that SIDM simulatons exhibit significantly lower median values of Vmax. This result is compatible with the decrease in circular velocity found in DMO simulations (see Fig. 14 in Fischer et al. 2024a), and in this work, we confirm that this effect is still present in hydrodynamic simulations.
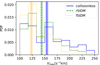 |
Fig. 13. Peak of circular velocity for all galaxies with a mass cut of 1 < MSH < 2 [1011 h−1 M⊙] for subhaloes with the cluster centric distance in the range [0.15, 1] Rvir. Colour lines and styles are the same as in Fig. 3. The shaded vertical bands correspond to the median and one standard deviation on the mean. |
We now study if SIDM models are capable of producing an increased fraction of UDGs compared to collisionless DM. We define these objects as in Sales et al. (2020), namely as systems with M⋆/Reff < 2.6 × 10⁷ [h kpc−2 M⊙], where M⋆ is the galaxy stellar mass and Reff is the projected half light radius respectively (defined as in Sales et al. 2020, namely as 4/3 times the 3D half mass radius). We also use the same resolution cut used in Sales et al. (2020), which imposes a lower limit of ten DM particles per subhalo. In the upper panel of Fig. 14, we show the fraction of UDGs per mass bin. We notice that SIDM models produce systematically more diffuse objects, as the fraction of SIDM UDGs at M⋆ ≈ 0.3 × 10¹⁰ h−1 M⊙ is more than twice as the amount in collisionless DM, in agreement with the fact that SIDM subhaloes in cluster outskirts tend to have lower circular velocities (see e.g. Fig. 6 in Peñarrubia et al. 2010).
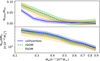 |
Fig. 14. Number of objects per mass stellar mass bins (upper panel) and the fraction above ΣUDG defined in Sales et al. (2020) for a given stellar mass bin. Here, we consider only objects outside the main halo Rvir and inside the main halo FoF group. The colours are organised as in Fig. 3; the shaded area corresponds to the error of the mean in each bin. |
To conclude the section, we verify if the increase in UDGs can be due to an overall increased number of substructures. Therefore, in the bottom panel of Fig. 14, we show the total number of galaxies per stellar mass bin, where we can see that SIDM models have systematically significantly fewer subhaloes compared to collisionless DM (stellar masses span eight log-spaced bins in the range [0.2, 1]×1010 h−1 M⊙).
5. Conclusions
In this study, we conducted a comparative analysis of the impact of rare and frequent velocity-dependent SIDM models within the cores of massive galaxy clusters (with masses around ≈1014 − 1015 M⊙). Additionally, we examined the influence of incorporating baryons in these simulations. We obtained the following main results:
-
DMO simulations of rare and frequent SIDM models form cored galaxy cluster profiles in agreement with other theoretical studies. In contrast, SIDM FP simulations show a significantly (≈20%) higher central matter density compared to collisionless DM. This is in contrast with other SIDM simulations (Robertson et al. 2019); however, we are not able to pin the underlying reason. Future studies are needed to understand better the interplay between SIDM and baryon models. Therefore we warn that it is not straightforward to observationally constrain SIDM cross section by just estimating galaxy cluster cores.
-
While SIDM DMO simulation strongly suppresses subhaloes in cluster cores compared to collisionless DM, this suppression is dampened in FP simulations (Fig. 8); however, it is still significant, corresponding to a factor ≈20% for rSIDM and ≈25% for fSIDM. The high satellite suppression that we find fSIDM runs (compared to rSIDM) was already studied in Fischer et al. (2022); it is possible that the higher satellite disruption is related to the fact that during mergers, rSIDM and fSIDM produce different substructure offsets (Sabarish et al. 2024).
-
We found that SIDM produces cluster cores with substructures in the low-mass regime (< 1011 h−1 M⊙) that are more compact and that this increase is due to an enhanced stripping of their DM component. Here, we do not see significant differences between fSIDM and rSIDM (see Fig. 10): it is possible that, since they are mainly post-stripping subhaloes, both SIDM models had enough time to strip a similar amount of DM.
-
SIDM simulations produce a significantly higher fraction of low surface brightness galaxies in cluster outskirts compared to collisionless DM. Interestingly, the fSIDM models produce subhaloes in the outskirt that have lower compactness compared to rSIDM one (Fig. 13). This could be related to the slight decrease in the internal log-slope γ (see Fig. 9).
To summarise, our SIDM models yield similar central density profiles but significantly different satellite abundances, with fSIDM suppressing more satellites. Nonetheless, we observed that the circular profile of the central substructures remains highly similar due to the substantial stripping of DM. However, infalling subhaloes located in the cluster outskirts demonstrate differences in compactness (with fSIDM producing less compact subhaloes).
We showed that while adding hydrodynamic to galaxy cluster simulations washes out some of SIDM (both rare and frequent) signatures (as the core formation), it still leaves significant imprints in the subhalo population. Moreover, different SIDM models are affecting the subhalo abundance and compactness differently. In the future, it would be interesting to run and study cluster simulations with a resolution that is high enough to study subhalo core collapse. Recent studies show that properly resolving the core-collapse up to redshift z = 0 is challenging, as they require a large number of particles (compared to typical cosmological simulations) and small time steps to reproduce theoretical gravothermal evolution models as Yang & Yu (2021), Zhong et al. (2023), Palubski et al. (2024), Mace et al. (2024); to properly resolve the mean free path and they also need relatively high accuracy of gravitational interactions to deal with energy conservation issues of current numerical schemes Fischer et al. (2024b).
Note that Ωm represents the total matter density parameter. In DMO simulations, Ωm corresponds to the DM density parameter, whereas in FP simulations, Ωm denotes the sum of baryonic and DM components.
Note that SIDM is a type of collisional, cold DM; therefore the three DM models (collisionless DM, rSIDM, fSIDM) can consistently share the same initial conditions (as opposed to what would happen with warm DM).
Note that the virial mass Mvir is defined as the mass within the so-called virial radius Rvir, that encloses an average density of  , where ρc is the critical density of the Universe and Δvir is the overdensity coming from the top-hat spherical collapse model (see Kravtsov et al. 2018, for a review) and has a value of Δvir ≈ 100 for our cosmological parameters (Eke et al. 1996; Bryan & Norman 1998).
We used a space-filling curve-aware neighbour search (Ragagnin et al. 2016).
The fit is performed by minimising the sum of squared log-residuals over 20 logarithmically spaced bins in the range [0.01, 1] Rvir.
Acknowledgments
We thank the anonymous referee for the useful comments, and we thank Hai-Bo Yu for the useful comments on the arXiv draft. We acknowledge support from the grant PRIN-MIUR 2017 WSCC32. A.R. acknowledges support by MIUR-DAAD contract number 34843 “The Universe in a Box”. We carried out our simulations using the INAF-Pleiadi project SIDM vs CDM allocated in the Trieste IT framework (Taffoni et al. 2020; Bertocco et al. 2020). We are especially grateful for the support by M. Petkova through the Computational centre for Particle and Astrophysics (C2PAP). L.M. acknowledges the support from the grants PRIN-MIUR 2022 20227RNLY3 and ASI n.2018-23-HH.0. K.D. acknowledges support by the COMPLEX project from the European Research Council (ERC) under the European Union’s Horizon 2020 research and innovation programme grant agreement ERC-2019-AdG 882679. M.S.F. is support by the Deutsche Forschungsgemeinschaft (DFG, German Research Foundation) under Germany’s Excellence Strategy – EXC-2094 “Origins” – 390783311. G.D. acknowledges the funding by the European Union – NextGenerationEU, in the framework of the HPC project – “National Centre for HPC, Big Data and Quantum Computing” (PNRR – M4C2 – I1.4 – CN00000013 – CUP J33C22001170001). A.R. and F.C. acknowledge co-funding by the European Union – NextGenerationEU within PRIN 2022 project n.20229YBSAN – Globular clusters in cosmological simulations and in lensed fields: from their birth to the present epoch. We thank all participants of the Darkium SIDM https://www.darkium.org/ Journal Club for helpful discussions. The authors thank the organisers of the Pollica 2023 SIDM workshop for the interesting discussions. A.R. and G.C. thank the support from INAF theory Grant 2022: Illuminating Dark Matter using Weak Lensing by Cluster Satellites, PI: Carlo Giocoli.
References
- Adhikari, S., Banerjee, A., Boddy, K. K., et al. 2022, ArXiv e-prints [arXiv:2207.10638] [Google Scholar]
- Andrade, K. E., Fuson, J., Gad-Nasr, S., et al. 2022, MNRAS, 510, 54 [Google Scholar]
- Bahé, Y. M. 2021, MNRAS, 505, 1458 [CrossRef] [Google Scholar]
- Beck, A. M., Murante, G., Arth, A., et al. 2016, MNRAS, 455, 2110 [Google Scholar]
- Bergamini, P., Rosati, P., Mercurio, A., et al. 2019, A&A, 631, A130 [NASA ADS] [CrossRef] [EDP Sciences] [Google Scholar]
- Bertocco, S., Goz, D., Tornatore, L., et al. 2020, in ASP Conf. Ser., eds. R. Pizzo, E. R. Deul, J. D. Mol, J. de Plaa, & H. Verkouter, 527, 303 [NASA ADS] [Google Scholar]
- Blumenthal, G. R., Faber, S. M., Flores, R., & Primack, J. R. 1986, ApJ, 301, 27 [Google Scholar]
- Bonafede, A., Dolag, K., Stasyszyn, F., Murante, G., & Borgani, S. 2011, MNRAS, 418, 2234 [NASA ADS] [CrossRef] [Google Scholar]
- Bryan, G. L., & Norman, M. L. 1998, ApJ, 495, 80 [NASA ADS] [CrossRef] [Google Scholar]
- Carleton, T., Errani, R., Cooper, M., et al. 2019, MNRAS, 485, 382 [NASA ADS] [CrossRef] [Google Scholar]
- Correa, C. A. 2021, MNRAS, 503, 920 [NASA ADS] [CrossRef] [Google Scholar]
- Davis, M., Efstathiou, G., Frenk, C. S., & White, S. D. M. 1985, ApJ, 292, 371 [Google Scholar]
- Despali, G., & Vegetti, S. 2017, MNRAS, 469, 1997 [NASA ADS] [CrossRef] [Google Scholar]
- Despali, G., Giocoli, C., Angulo, R. E., et al. 2016, MNRAS, 456, 2486 [NASA ADS] [CrossRef] [Google Scholar]
- Despali, G., Sparre, M., Vegetti, S., et al. 2019, MNRAS, 484, 4563 [NASA ADS] [CrossRef] [Google Scholar]
- Despali, G., Lovell, M., Vegetti, S., Crain, R. A., & Oppenheimer, B. D. 2020, MNRAS, 491, 1295 [NASA ADS] [CrossRef] [Google Scholar]
- Di Cintio, A., Brook, C. B., Macciò, A. V., Dutton, A. A., & Cardona-Barrero, S. 2019, MNRAS, 486, 2535 [NASA ADS] [CrossRef] [Google Scholar]
- Dolag, K., Borgani, S., Murante, G., & Springel, V. 2009, MNRAS, 399, 497 [Google Scholar]
- Duffy, A. R., Schaye, J., Kay, S. T., et al. 2010, MNRAS, 405, 2161 [NASA ADS] [Google Scholar]
- Eckert, D., Ettori, S., Robertson, A., et al. 2022, A&A, 666, A41 [NASA ADS] [CrossRef] [EDP Sciences] [Google Scholar]
- Einasto, J. 1965, Trudy Astrofizicheskogo Instituta Alma-Ata, 5, 87 [NASA ADS] [Google Scholar]
- Eke, V. R., Cole, S., & Frenk, C. S. 1996, MNRAS, 282, 263 [CrossRef] [Google Scholar]
- Elbert, O. D., Bullock, J. S., Kaplinghat, M., et al. 2018, ApJ, 853, 109 [CrossRef] [Google Scholar]
- Fabjan, D., Borgani, S., Tornatore, L., et al. 2010, MNRAS, 401, 1670 [Google Scholar]
- Feng, J. L., Kaplinghat, M., & Yu, H.-B. 2010, Phys. Rev. Lett., 104, 151301 [NASA ADS] [CrossRef] [Google Scholar]
- Ferland, G. J., Korista, K. T., Verner, D. A., et al. 1998, PASP, 110, 761 [Google Scholar]
- Fischer, M. S., Brüggen, M., Schmidt-Hoberg, K., et al. 2021, MNRAS, 505, 851 [NASA ADS] [CrossRef] [Google Scholar]
- Fischer, M. S., Brüggen, M., Schmidt-Hoberg, K., et al. 2022, MNRAS, 516, 1923 [NASA ADS] [CrossRef] [Google Scholar]
- Fischer, M. S., Kasselmann, L., Brüggen, M., et al. 2024a, MNRAS, 529, 2327 [NASA ADS] [CrossRef] [Google Scholar]
- Fischer, M. S., Dolag, K., & Yu, H.-B. 2024b, A&A, submitted [arXiv:2403.00739] [Google Scholar]
- Giocoli, C., Tormen, G., & Sheth, R. K. 2012, MNRAS, 422, 185 [NASA ADS] [CrossRef] [Google Scholar]
- Giocoli, C., Marulli, F., Baldi, M., Moscardini, L., & Metcalf, R. B. 2013, MNRAS, 434, 2982 [NASA ADS] [CrossRef] [Google Scholar]
- Gnedin, O. Y., Kravtsov, A. V., Klypin, A. A., & Nagai, D. 2004, ApJ, 616, 16 [Google Scholar]
- Granata, G., Mercurio, A., Grillo, C., et al. 2022, A&A, 659, A24 [NASA ADS] [CrossRef] [EDP Sciences] [Google Scholar]
- Granata, G., Bergamini, P., Grillo, C., et al. 2023, A&A, 679, A124 [NASA ADS] [CrossRef] [EDP Sciences] [Google Scholar]
- Greco, J. P., Goulding, A. D., Greene, J. E., et al. 2018, ApJ, 866, 112 [NASA ADS] [CrossRef] [Google Scholar]
- Harvey, D., Robertson, A., Massey, R., & McCarthy, I. G. 2019, MNRAS, 488, 1572 [NASA ADS] [CrossRef] [Google Scholar]
- Hernquist, L. 1990, ApJ, 356, 359 [Google Scholar]
- Hirschmann, M., Dolag, K., Saro, A., et al. 2014, MNRAS, 442, 2304 [Google Scholar]
- Kahlhoefer, F., Schmidt-Hoberg, K., Frandsen, M. T., & Sarkar, S. 2014, MNRAS, 437, 2865 [CrossRef] [Google Scholar]
- Kamada, A., & Kim, H. J. 2020, Phys. Rev. D, 102, 043009 [NASA ADS] [CrossRef] [Google Scholar]
- Kaplinghat, M., Tulin, S., & Yu, H.-B. 2016, Phys. Rev. Lett., 116, 041302 [NASA ADS] [CrossRef] [Google Scholar]
- Kimmig, L. C., Remus, R.-S., Dolag, K., & Biffi, V. 2023, ApJ, 949, 92 [Google Scholar]
- Kong, D., Kaplinghat, M., Yu, H.-B., Fraternali, F., & Mancera Piña, P. E. 2022, ApJ, 936, 166 [NASA ADS] [CrossRef] [Google Scholar]
- Kravtsov, A. V., & Borgani, S. 2012, ARA&A, 50, 353 [Google Scholar]
- Kravtsov, A. V., Vikhlinin, A. A., & Meshcheryakov, A. V. 2018, Astron. Lett., 44, 8 [Google Scholar]
- Loeb, A., & Weiner, N. 2011, Phys. Rev. Lett., 106, 171302 [NASA ADS] [CrossRef] [Google Scholar]
- Ludlow, A. D., Navarro, J. F., Li, M., et al. 2012, MNRAS, 427, 1322 [NASA ADS] [CrossRef] [Google Scholar]
- Mace, C., Carton Zeng, Z., Peter, A. H. G., et al. 2024, ArXiv e-prints [arXiv:2402.01604] [Google Scholar]
- Mastromarino, C., Despali, G., Moscardini, L., et al. 2023, MNRAS, 524, 1515 [NASA ADS] [CrossRef] [Google Scholar]
- Meneghetti, M., Davoli, G., Bergamini, P., et al. 2020, Science, 369, 1347 [Google Scholar]
- Meneghetti, M., Ragagnin, A., Borgani, S., et al. 2022, A&A, 668, A188 [NASA ADS] [CrossRef] [EDP Sciences] [Google Scholar]
- Meneghetti, M., Cui, W., Rasia, E., et al. 2023, A&A, 678, L2 [NASA ADS] [CrossRef] [EDP Sciences] [Google Scholar]
- Montenegro-Taborda, D., Rodriguez-Gomez, V., Pillepich, A., et al. 2023, MNRAS, 521, 800 [NASA ADS] [CrossRef] [Google Scholar]
- Moore, B., Governato, F., Quinn, T., Stadel, J., & Lake, G. 1998, ApJ, 499, L5 [Google Scholar]
- Mowla, L., van Dokkum, P., Merritt, A., et al. 2017, ApJ, 851, 27 [CrossRef] [Google Scholar]
- Nadler, E. O., Banerjee, A., Adhikari, S., Mao, Y.-Y., & Wechsler, R. H. 2020, ApJ, 896, 112 [NASA ADS] [CrossRef] [Google Scholar]
- Nadler, E. O., Yang, D., & Yu, H.-B. 2023, ApJ, 958, L39 [NASA ADS] [CrossRef] [Google Scholar]
- Natarajan, P., & Kneib, J.-P. 1997, MNRAS, 287, 833 [Google Scholar]
- Natarajan, P., & Springel, V. 2004, ApJ, 617, L13 [NASA ADS] [CrossRef] [Google Scholar]
- Natarajan, P., De Lucia, G., & Springel, V. 2007, MNRAS, 376, 180 [Google Scholar]
- Navarro, J. F., Frenk, C. S., & White, S. D. M. 1997, ApJ, 490, 493 [Google Scholar]
- Newman, A. B., Treu, T., Ellis, R. S., et al. 2009, ApJ, 706, 1078 [NASA ADS] [CrossRef] [Google Scholar]
- Newman, A. B., Treu, T., Ellis, R. S., & Sand, D. J. 2011, ApJ, 728, L39 [NASA ADS] [CrossRef] [Google Scholar]
- Newman, A. B., Treu, T., Ellis, R. S., & Sand, D. J. 2013, ApJ, 765, 25 [NASA ADS] [CrossRef] [Google Scholar]
- Outmezguine, N. J., Boddy, K. K., Gad-Nasr, S., Kaplinghat, M., & Sagunski, L. 2023, MNRAS, 523, 4786 [NASA ADS] [CrossRef] [Google Scholar]
- Palubski, I., Slone, O., Kaplinghat, M., Lisanti, M., & Jiang, F. 2024, ArXiv e-prints [arXiv:2402.12452] [Google Scholar]
- Peñarrubia, J., Benson, A. J., Walker, M. G., et al. 2010, MNRAS, 406, 1290 [NASA ADS] [Google Scholar]
- Ragagnin, A., Tchipev, N., Bader, M., Dolag, K., & Hammer, N. J. 2016, in Advances in Parallel Computing, Volume 27: Parallel Computing: On the Road to Exascale, eds. G. R. Joubert, H. Leather, M. Parsons, F. Peters, & M. Sawyer (IOP Ebook), 411 [Google Scholar]
- Ragagnin, A., Saro, A., Singh, P., & Dolag, K. 2021, MNRAS, 500, 5056 [Google Scholar]
- Ragagnin, A., Meneghetti, M., Bassini, L., et al. 2022, A&A, 665, A16 [NASA ADS] [CrossRef] [EDP Sciences] [Google Scholar]
- Rasia, E., Borgani, S., Murante, G., et al. 2015, ApJ, 813, L17 [Google Scholar]
- Robertson, A. 2021, MNRAS, 504, L7 [NASA ADS] [CrossRef] [Google Scholar]
- Robertson, A., Harvey, D., Massey, R., et al. 2019, MNRAS, 488, 3646 [NASA ADS] [CrossRef] [Google Scholar]
- Sabarish, V. M., Brüggen, M., Schmidt-Hoberg, K., Fischer, M. S., & Kahlhoefer, F. 2024, MNRAS, 529, 2032 [NASA ADS] [CrossRef] [Google Scholar]
- Sagunski, L., Gad-Nasr, S., Colquhoun, B., Robertson, A., & Tulin, S. 2021, JCAP, 2021, 024 [CrossRef] [Google Scholar]
- Sales, L. V., Navarro, J. F., Peñafiel, L., et al. 2020, MNRAS, 494, 1848 [Google Scholar]
- Spergel, D. N., & Steinhardt, P. J. 2000, Phys. Rev. Lett., 84, 3760 [NASA ADS] [CrossRef] [Google Scholar]
- Springel, V. 2005, MNRAS, 364, 1105 [Google Scholar]
- Springel, V., White, S. D. M., Tormen, G., & Kauffmann, G. 2001, MNRAS, 328, 726 [Google Scholar]
- Springel, V., Di Matteo, T., & Hernquist, L. 2005, MNRAS, 361, 776 [Google Scholar]
- Steinborn, L. K., Dolag, K., Hirschmann, M., Prieto, M. A., & Remus, R.-S. 2015, MNRAS, 448, 1504 [Google Scholar]
- Taffoni, G., Becciani, U., Garilli, B., et al. 2020, in ASP Conf. Ser., eds. R. Pizzo, E. R. Deul, J. D. Mol, J. de Plaa, & H. Verkouter, 527, 307 [NASA ADS] [Google Scholar]
- Teklu, A. F., Remus, R.-S., Dolag, K., et al. 2015, ApJ, 812, 29 [Google Scholar]
- Tinker, J., Kravtsov, A. V., Klypin, A., et al. 2008, ApJ, 688, 709 [Google Scholar]
- Tormen, G., Diaferio, A., & Syer, D. 1998, MNRAS, 299, 728 [NASA ADS] [CrossRef] [Google Scholar]
- Tornatore, L., Borgani, S., Dolag, K., & Matteucci, F. 2007, MNRAS, 382, 1050 [Google Scholar]
- Tulin, S., & Yu, H.-B. 2018, Phys. Rep., 730, 1 [Google Scholar]
- Tulin, S., Yu, H.-B., & Zurek, K. M. 2013, Phys. Rev. D, 87, 115007 [NASA ADS] [CrossRef] [Google Scholar]
- van Dokkum, P. G., Abraham, R., Merritt, A., et al. 2015, ApJ, 798, L45 [NASA ADS] [CrossRef] [Google Scholar]
- Vogelsberger, M., Zavala, J., & Loeb, A. 2012, MNRAS, 423, 3740 [NASA ADS] [CrossRef] [Google Scholar]
- Yang, D., & Yu, H.-B. 2021, Phys. Rev. D, 104, 103031 [NASA ADS] [CrossRef] [Google Scholar]
- Yang, D., & Yu, H.-B. 2022, JCAP, 2022, 077 [CrossRef] [Google Scholar]
- Yang, S., Du, X., Zeng, Z. C., et al. 2023, ApJ, 946, 47 [NASA ADS] [CrossRef] [Google Scholar]
- Zeng, Z. C., Peter, A. H. G., Du, X., et al. 2022, MNRAS, 513, 4845 [NASA ADS] [CrossRef] [Google Scholar]
- Zhong, Y.-M., Yang, D., & Yu, H.-B. 2023, MNRAS, 526, 758 [NASA ADS] [CrossRef] [Google Scholar]
Appendix A: Profile evolution
In this Appendix, we provide additional details on the central increase of the DM density and velocity dispersion. First of all, we made sure that we have under control the computation of the central density  and of the central density of the baryons.
In Fig. A.1, we present the DM density profile of the FP run of the D16 galaxy cluster at the lowest redshift slice. There, we can see that the DM has a core and that the core is well fitted by the profile in Eq. 4 (notice how the vertical and horizontal orange dashed lines capture the core density and radius of the orange solid line). We also show that our NFW fits are properly capturing the DM profile (note how the blue dashed lines capture the orange solid line down to a few tens of kpc). Finally, we show that the core of baryons is well captured by a radius of ≈h−110 ckpc as stated in Sect. 3.2.
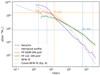 |
Fig. A.1. Density profile of D16 FP galaxy cluster at z = 0.2. We show its DM density profile (orange solid line); the corresponding NFW fit (dashed blue line) together with the values of rs and ρs (vertical and horizontal dashed blue lines respectively); the corresponding cored-NFW functional form (dashed orange line, see our Eq. 4 or Yang & Yu 2021, Eq. A.5), together with the values of ρc and rc (vertical and horizontal dashed orange lines respectively); the profile of baryons (solid purple line); the corresponding Hernquist profile (dotted purple line); and the DM profile of the corresponding DMO simulation (solid green line). |
It is noteworthy that both the SIDM and collisionless FP DM profiles exhibit a core at radii deviating from NFW for r ≳ 10 kpc. This small-scale deviation from NFW could stem from either adiabatic contraction or DM self-interaction. Intriguingly Newman et al. (2013) show hints that galaxy clusters possess a core smaller than those predicted by their simulations (see also Newman et al. 2009, 2011). We took the opportunity to conduct a similar analysis to the one performed in Kaplinghat et al. (2016) and examined the core radius distribution of our SIDM clusters.
Initially, we attempted to fit the cored NFW profile presented in Eq. 2 in Newman et al. (2013). However, with their functional form, we are not able to constrain the core radius parameter (the fit produces a core radius that tends to be zero). Nevertheless, since Yang & Yu (2021) provided a cored version of NFW capable of capturing our cores (see our Fig. A.1), we opted to estimate the core size using their profile (reported in our Eq. 4). We present our core sizes in Fig. A.2, and surprisingly, we found that SIDM simulations exhibit smaller core radii compared to CDM, with a distribution of core sizes closer to those observed by Newman et al. (2013). It is possible that cluster core sizes could be used in future to constrain DM profiles. In our case, a larger cross section at galaxy cluster scales (namely, at a relative velocity of ≈1000 s−1 km) could improve the match with observations even more. Moreover, note that while past works looked for SIDM signatures in core signatures Eckert et al. (2022), it is possible that the presence of a core is not the definitive test for SIDM, as some models, such as ours, produce cuspier profiles than CDM.
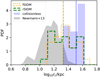 |
Fig. A.2. Central density DM core radius PDF. We compare our FP simulations with data from Newman et al. (2013) in the grey histogram. The solid blue histogram reports data from collisionless DM, the dotted orange histogram reports data from fSIDM, and the dashed green histogram reports data for rSIDM. |
We now provide more details on the time evolution of the central increase of DM density and circular velocity. The motivation behind this extended study is that in Section 3.2, we found that SIDM profiles on FP clusters have a higher central density compared to collisionless DM profiles of FP clusters. Therefore, we believe it is interesting to show the time evolution of both the velocity dispersion (Figure A.3 left panels) and density profiles (Figure A.3 right panels, for DM, stars and total matter, respectively) profile ratio of SIDM FP runs vs. the collisionless FP run values stacked for our six galaxy clusters. We see that at high redshift (z = 2.3), both SIDM and collisionless runs of FP clusters match both in terms of velocity dispersion and density profiles; therefore, SIDM and CDM produce similar high-redshift galaxy clusters. As time passes, both the central density and the central velocity dispersion of SIDM runs increase (compared to collisionless FP runs), as well as the relative central velocity dispersion.
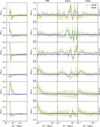 |
Fig. A.3. Relative velocity dispersion and density profiles of FP SIDM runs vs. FP collisionless DM runs. Each row represents a redshift slice. The left panel shows the relative dispersion profile, while the right panels report the relative density profiles (of DM, stars, and total matter, respectively). The dashed green lines report values for rSIDM, while dotted orange lines report values for fSIDM. The shaded area represents the error on the mean of the size regions. Note that the velocity dispersion relative difference has a different radial range compared to the density relative difference (see discussion). |
Note that the velocity dispersion relative difference has a radial range that starts at ckpc scale (see left column), while the radial range of the relative density starts at ≈10 ckpc (see right columns). We use two different radial ranges in order to better show the deviations of SIDM with respect to CDM. In fact, SIDM velocity dispersion deviates at sub-softening scales (see, e.g. Fig. 7), while density profiles deviate at much larger radii.
All Tables
All Figures
|
Fig. 1. SIDM cross section as in Eq. (1). The blue curve reports the cross section with the parameters chosen for this work (σT0 = 40 g−1 cm2 and v0 = 200 km s−1). Vertical shaded area corresponds to the median velocity dispersion for low mass subhaloes (M < 2 × 10¹⁰ M⊙) in cluster cores, high mass subhaloes (M > 4 × 10¹¹ M⊙) in cluster cores, and the typical velocity dispersion for haloes with Mvir ∈ [2 − 10]×1014 M⊙. |
| In the text | |
|
Fig. 2. Projected density maps of central region (within r < 0.15 Rvir) of the D16 region re-simulations at our lowest redshift slice of z = 0.2. The upper row shows DMO simulations, while the bottom row refers to FP simulations. Columns from left to right show collisionless DM simulations, rSIDM simulations, and fSIDM simulations, respectively. |
| In the text | |
|
Fig. 3. Comparison between stacked central density profile in the DMO runs. We report collisionless DM density profile as a blue solid line, rSIDM as a green dashed line, and fSIDM as an orange dotted line (note that rSIDM and fSIDM lines almost overlap visually). Shaded areas correspond to one standard deviation of the six regions. The upper panel shows the central density, normalised by the average density at Rvir for our six regions, while the bottom panel shows the ratio between the profiles of the SIDM runs and the collisionless DM runs. The grey shaded area covers one standard deviation around the fractional fiducial DM softening 2.8 × ϵ/Rvir. |
| In the text | |
|
Fig. 4. Comparison between stacked central density profiles in the FP runs. DM models are represented as in Fig. 3. Columns refer to the results for DM, stellar, and total matter components, respectively. Upper panels show DM density profiles, while lower panels show the ratio with respect to the collisionless DM profiles. The grey shaded area represents one standard deviation around the fractional fiducial stellar softening 2.8 × ϵ⋆/Rvir. |
| In the text | |
|
Fig. 5. Comparison between DM mass profiles of collisionless DM runs. The top panel shows the stacked DM mass profile of DMO runs (black) and FP runs (blue), while the bottom panel shows their ratio and the central value predicted by the adiabatic contraction model presented in Blumenthal et al. (1986) as light-orange shaded blue area. The vertical grey shaded area corresponds to one standard deviation of the DM gravitational softening. |
| In the text | |
|
Fig. 6. Rescaled DM central density |
| In the text | |
|
Fig. 7. Comparison between stacked velocity dispersion profiles. The top panel presents the stacked velocity dispersion profiles for our FP simulations of galaxy clusters in units of virial velocity |
| In the text | |
|
Fig. 8. Cumulative SHMFs in units of the virial mass for subhaloes with a cluster centric distance < 0.15 Rvir. The leftmost panel focus on DMO run with collisionless DM and rare and frequent SIDM; the other panels refer to FP simulations and show the results for different mass components: from left to right, DM, stellar matter and total matter. Colours and line styles are as in Fig. 3. The panels in the bottom row show the ratio between the SHMFs in the SIDM models and the one for the collisionless DM model. The shaded area corresponds to one standard deviation of the mean value. |
| In the text | |
|
Fig. 9. Stacked cumulative matter profiles of subhaloes in the outskirts of galaxy clusters (outside r > 0.5 Rvir), for DMO (left panel) and FP (right panel) simulations for collisionless (dotted blue lines), rSIDM (dashed green line), and fSIDM (dotted orange line) models. The solid lines show the profile fitted in the internal region (r < 20 ckpc). The labels also report the value of the fit of the NFW external logslope parameter γ. The vertical dashed lines correspond to the mean half-mass radius. |
| In the text | |
|
Fig. 10. Circular velocity profiles for FP simulations with a cluster centric distance < 0.15 Rvir. Each column shows a different matter component: total matter on the left, stellar component in the middle and the DM component on the right. Top panel: low mass regime [1, 2]×1010 h−1 M⊙, bottom panel: high mass regime [10, 40]×1010 h−1 M⊙. Line styles are as in Fig. 3. |
| In the text | |
|
Fig. 11. Subhalo compactness and stellar fraction for subhaloes for cluster centric distances < 0.15 Rvir. The upper panels show the average circular velocity per subhalo mass bin, while the bottom panels refer to the stellar fraction. Each column reports the results for a given re-simulated region (see Table 1). Colour codes and line styles are as in Fig. 3. |
| In the text | |
|
Fig. 12. Stellar mass of the BCG as a function of the halo mass M200c. The colour data points are the same as in Fig. 3. The black stars represent points from Kravtsov et al. (2018). |
| In the text | |
|
Fig. 13. Peak of circular velocity for all galaxies with a mass cut of 1 < MSH < 2 [1011 h−1 M⊙] for subhaloes with the cluster centric distance in the range [0.15, 1] Rvir. Colour lines and styles are the same as in Fig. 3. The shaded vertical bands correspond to the median and one standard deviation on the mean. |
| In the text | |
|
Fig. 14. Number of objects per mass stellar mass bins (upper panel) and the fraction above ΣUDG defined in Sales et al. (2020) for a given stellar mass bin. Here, we consider only objects outside the main halo Rvir and inside the main halo FoF group. The colours are organised as in Fig. 3; the shaded area corresponds to the error of the mean in each bin. |
| In the text | |
|
Fig. A.1. Density profile of D16 FP galaxy cluster at z = 0.2. We show its DM density profile (orange solid line); the corresponding NFW fit (dashed blue line) together with the values of rs and ρs (vertical and horizontal dashed blue lines respectively); the corresponding cored-NFW functional form (dashed orange line, see our Eq. 4 or Yang & Yu 2021, Eq. A.5), together with the values of ρc and rc (vertical and horizontal dashed orange lines respectively); the profile of baryons (solid purple line); the corresponding Hernquist profile (dotted purple line); and the DM profile of the corresponding DMO simulation (solid green line). |
| In the text | |
|
Fig. A.2. Central density DM core radius PDF. We compare our FP simulations with data from Newman et al. (2013) in the grey histogram. The solid blue histogram reports data from collisionless DM, the dotted orange histogram reports data from fSIDM, and the dashed green histogram reports data for rSIDM. |
| In the text | |
|
Fig. A.3. Relative velocity dispersion and density profiles of FP SIDM runs vs. FP collisionless DM runs. Each row represents a redshift slice. The left panel shows the relative dispersion profile, while the right panels report the relative density profiles (of DM, stars, and total matter, respectively). The dashed green lines report values for rSIDM, while dotted orange lines report values for fSIDM. The shaded area represents the error on the mean of the size regions. Note that the velocity dispersion relative difference has a different radial range compared to the density relative difference (see discussion). |
| In the text | |
Current usage metrics show cumulative count of Article Views (full-text article views including HTML views, PDF and ePub downloads, according to the available data) and Abstracts Views on Vision4Press platform.
Data correspond to usage on the plateform after 2015. The current usage metrics is available 48-96 hours after online publication and is updated daily on week days.
Initial download of the metrics may take a while.