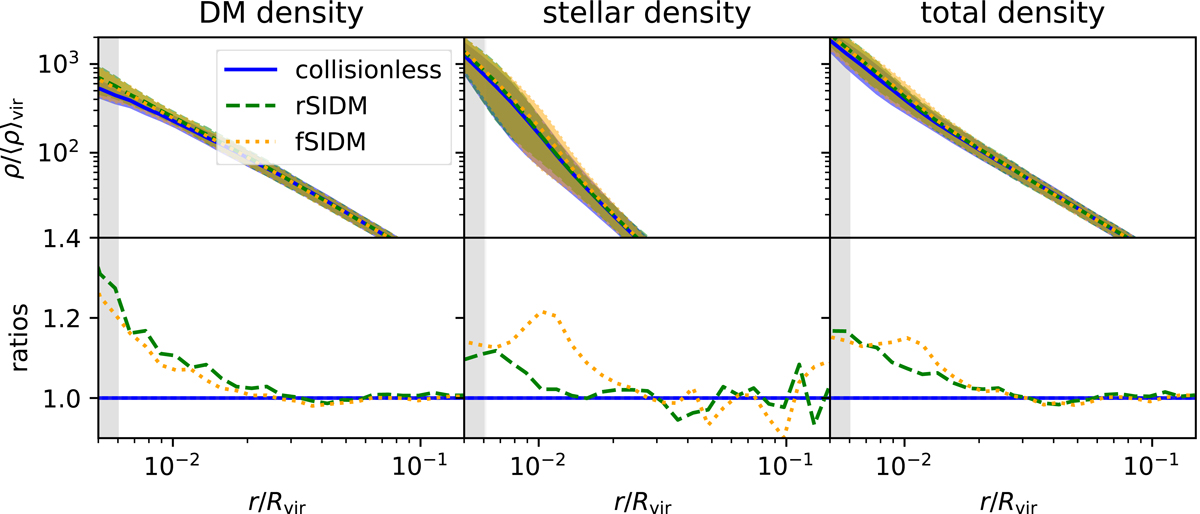
Fig. 4.
Download original image
Comparison between stacked central density profiles in the FP runs. DM models are represented as in Fig. 3. Columns refer to the results for DM, stellar, and total matter components, respectively. Upper panels show DM density profiles, while lower panels show the ratio with respect to the collisionless DM profiles. The grey shaded area represents one standard deviation around the fractional fiducial stellar softening 2.8 × ϵ⋆/Rvir.
Current usage metrics show cumulative count of Article Views (full-text article views including HTML views, PDF and ePub downloads, according to the available data) and Abstracts Views on Vision4Press platform.
Data correspond to usage on the plateform after 2015. The current usage metrics is available 48-96 hours after online publication and is updated daily on week days.
Initial download of the metrics may take a while.