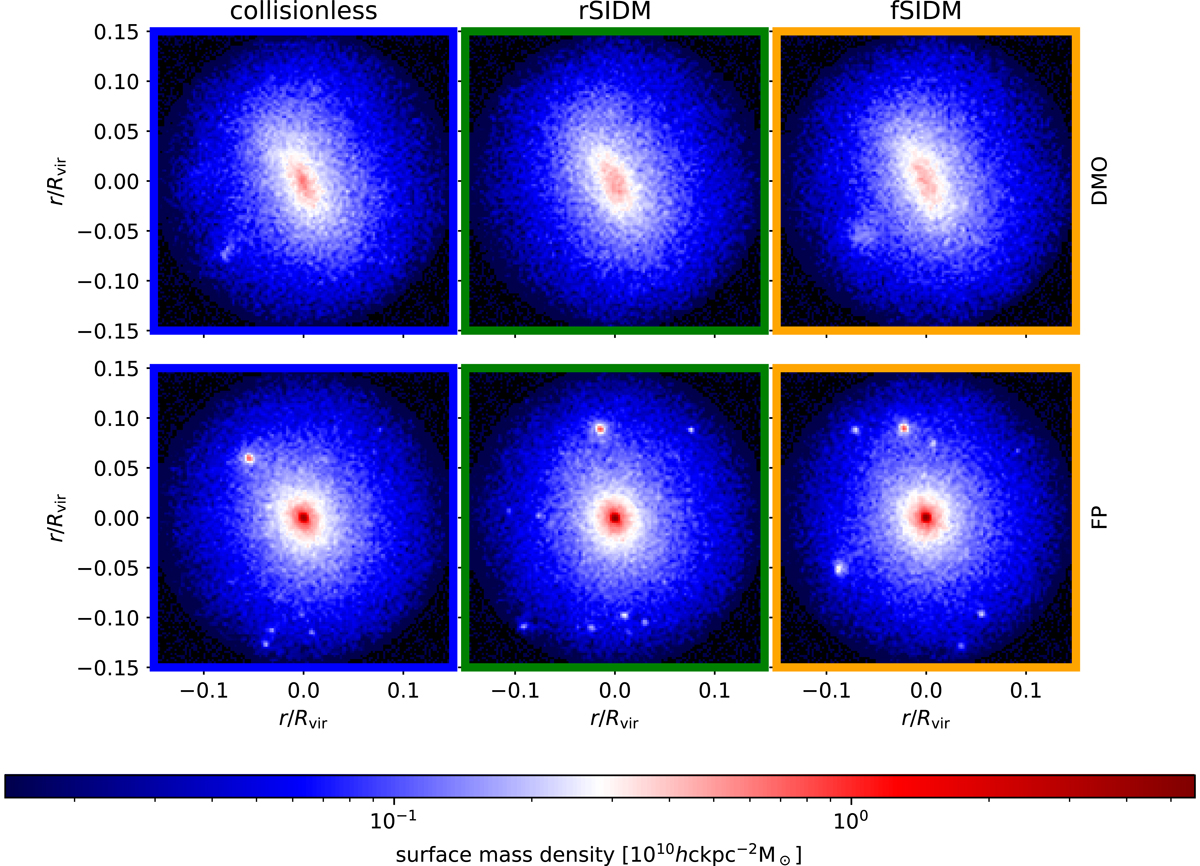
Fig. 2.
Download original image
Projected density maps of central region (within r < 0.15 Rvir) of the D16 region re-simulations at our lowest redshift slice of z = 0.2. The upper row shows DMO simulations, while the bottom row refers to FP simulations. Columns from left to right show collisionless DM simulations, rSIDM simulations, and fSIDM simulations, respectively.
Current usage metrics show cumulative count of Article Views (full-text article views including HTML views, PDF and ePub downloads, according to the available data) and Abstracts Views on Vision4Press platform.
Data correspond to usage on the plateform after 2015. The current usage metrics is available 48-96 hours after online publication and is updated daily on week days.
Initial download of the metrics may take a while.