Fig. 6.
Download original image
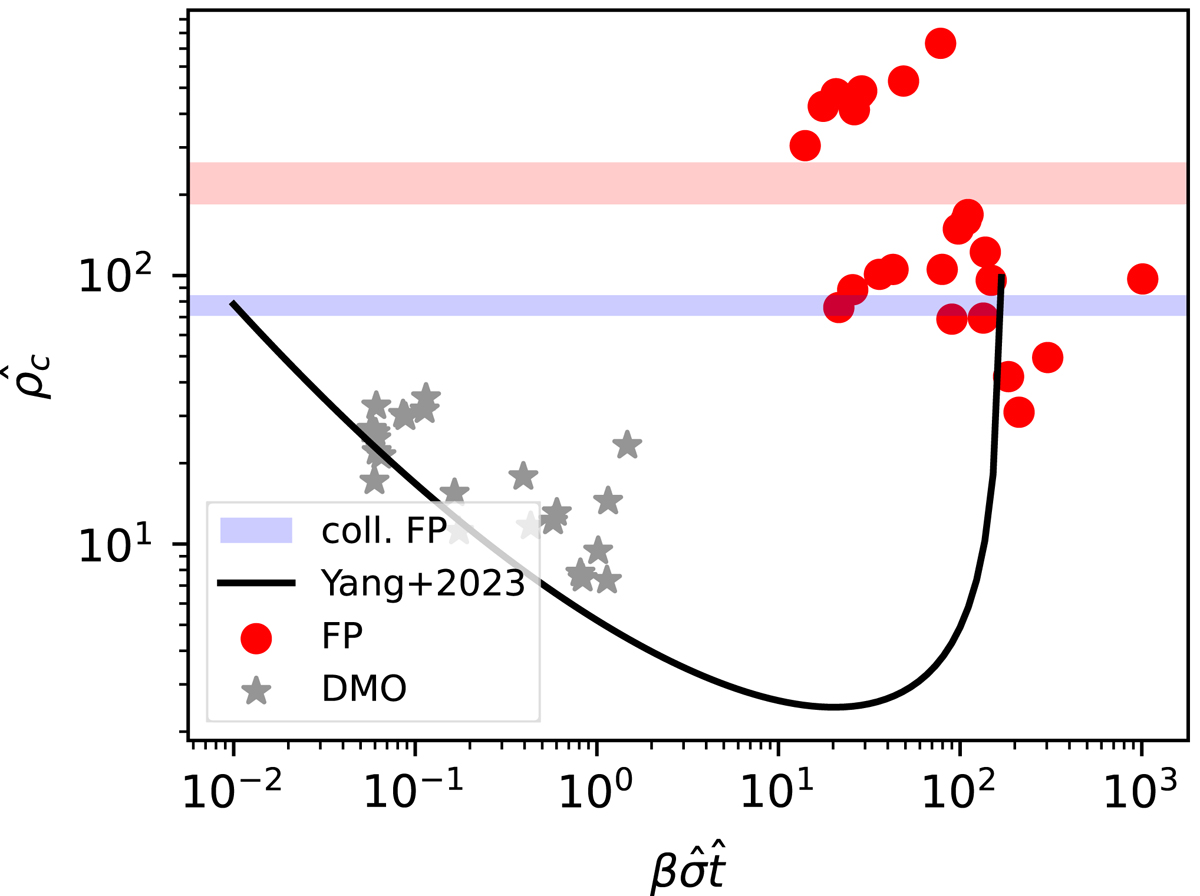
Rescaled DM central density ![]() as a function of rescaled time
as a function of rescaled time ![]() , for our FP SIDM (red circles) and DMO SIDM (grey stars) runs. We also overplot the model from Yang et al. (2023, black solid line). The red shaded area shows the mean value of the FP SIDM points with its one standard deviation, while the blue shaded area shows the same for collisionless FP runs.
, for our FP SIDM (red circles) and DMO SIDM (grey stars) runs. We also overplot the model from Yang et al. (2023, black solid line). The red shaded area shows the mean value of the FP SIDM points with its one standard deviation, while the blue shaded area shows the same for collisionless FP runs.
Current usage metrics show cumulative count of Article Views (full-text article views including HTML views, PDF and ePub downloads, according to the available data) and Abstracts Views on Vision4Press platform.
Data correspond to usage on the plateform after 2015. The current usage metrics is available 48-96 hours after online publication and is updated daily on week days.
Initial download of the metrics may take a while.