Fig. 9.
Download original image
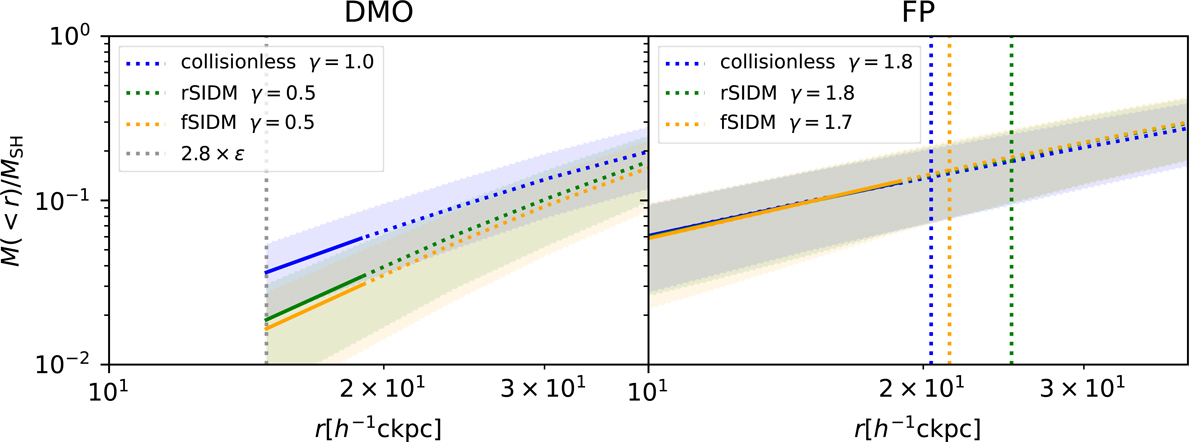
Stacked cumulative matter profiles of subhaloes in the outskirts of galaxy clusters (outside r > 0.5 Rvir), for DMO (left panel) and FP (right panel) simulations for collisionless (dotted blue lines), rSIDM (dashed green line), and fSIDM (dotted orange line) models. The solid lines show the profile fitted in the internal region (r < 20 ckpc). The labels also report the value of the fit of the NFW external logslope parameter γ. The vertical dashed lines correspond to the mean half-mass radius.
Current usage metrics show cumulative count of Article Views (full-text article views including HTML views, PDF and ePub downloads, according to the available data) and Abstracts Views on Vision4Press platform.
Data correspond to usage on the plateform after 2015. The current usage metrics is available 48-96 hours after online publication and is updated daily on week days.
Initial download of the metrics may take a while.