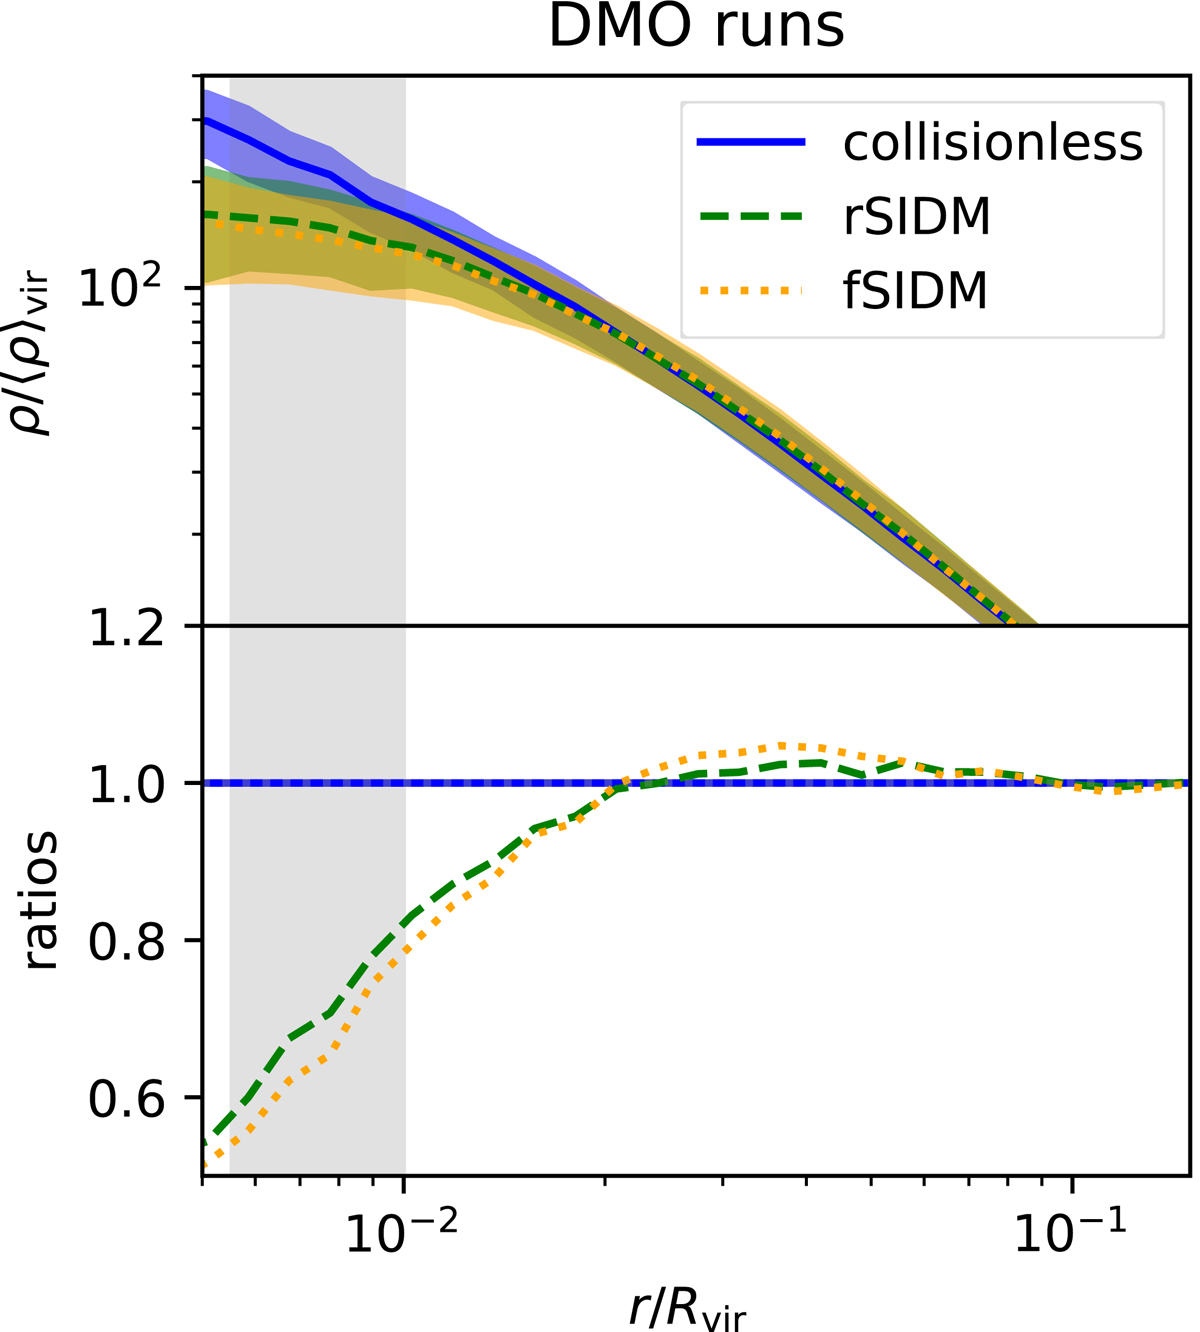
Fig. 3.
Download original image
Comparison between stacked central density profile in the DMO runs. We report collisionless DM density profile as a blue solid line, rSIDM as a green dashed line, and fSIDM as an orange dotted line (note that rSIDM and fSIDM lines almost overlap visually). Shaded areas correspond to one standard deviation of the six regions. The upper panel shows the central density, normalised by the average density at Rvir for our six regions, while the bottom panel shows the ratio between the profiles of the SIDM runs and the collisionless DM runs. The grey shaded area covers one standard deviation around the fractional fiducial DM softening 2.8 × ϵ/Rvir.
Current usage metrics show cumulative count of Article Views (full-text article views including HTML views, PDF and ePub downloads, according to the available data) and Abstracts Views on Vision4Press platform.
Data correspond to usage on the plateform after 2015. The current usage metrics is available 48-96 hours after online publication and is updated daily on week days.
Initial download of the metrics may take a while.