Open Access
Fig. 7.
Download original image
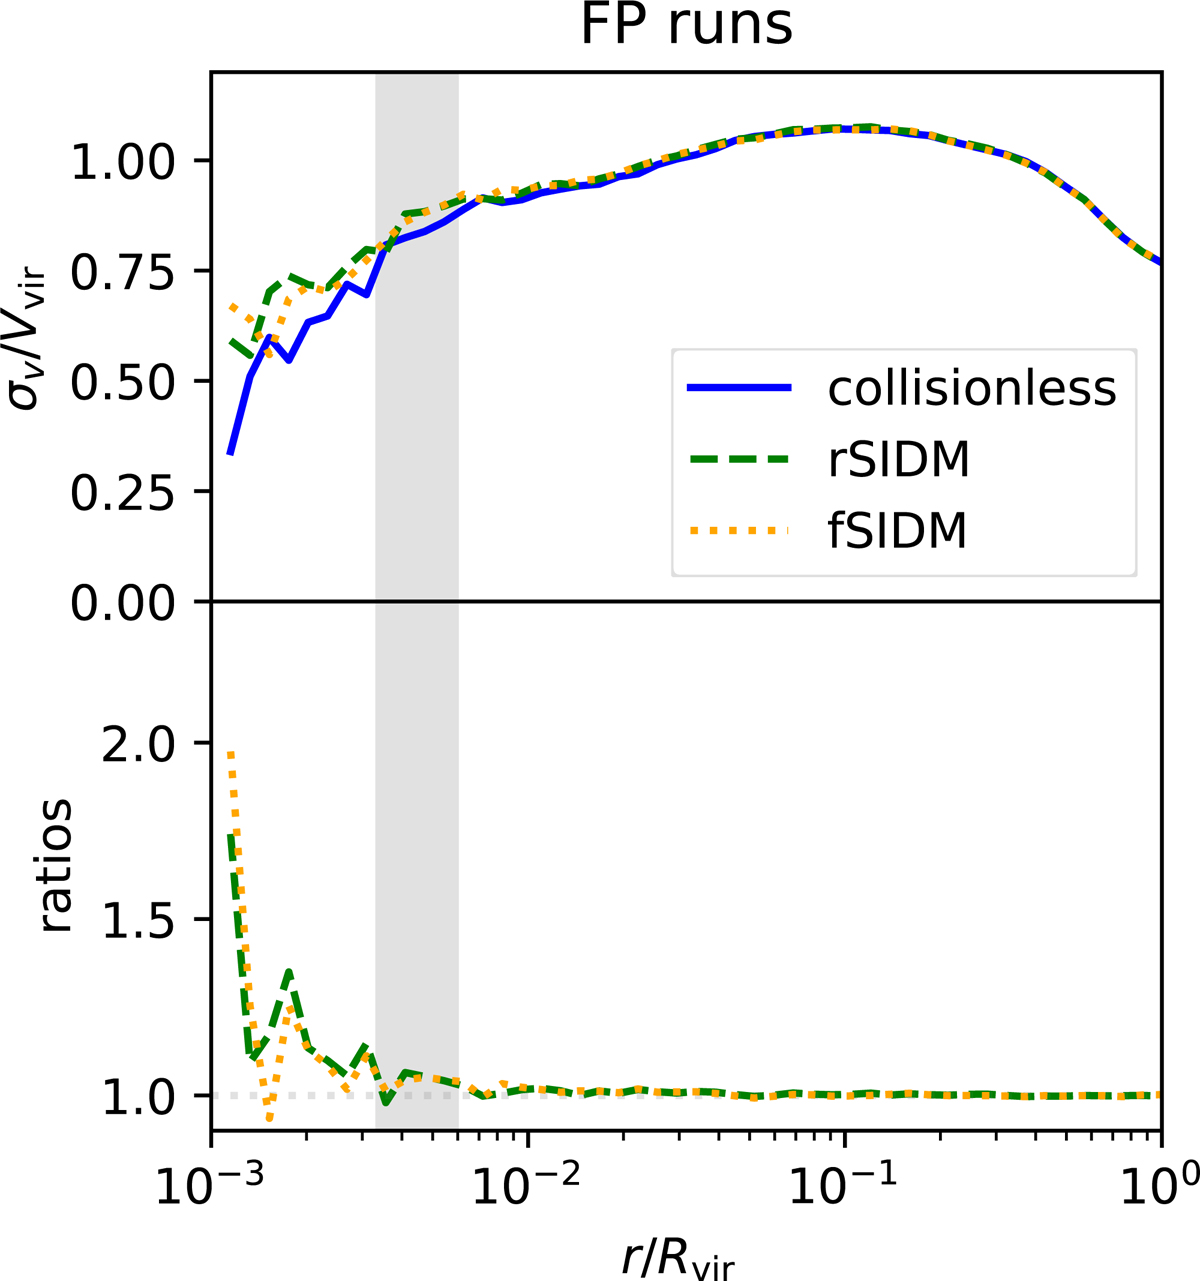
Comparison between stacked velocity dispersion profiles. The top panel presents the stacked velocity dispersion profiles for our FP simulations of galaxy clusters in units of virial velocity ![]() . Bottom panel: ratios with respect to the DMO counterparts. Lines are coloured as in Fig. 4.
. Bottom panel: ratios with respect to the DMO counterparts. Lines are coloured as in Fig. 4.
Current usage metrics show cumulative count of Article Views (full-text article views including HTML views, PDF and ePub downloads, according to the available data) and Abstracts Views on Vision4Press platform.
Data correspond to usage on the plateform after 2015. The current usage metrics is available 48-96 hours after online publication and is updated daily on week days.
Initial download of the metrics may take a while.