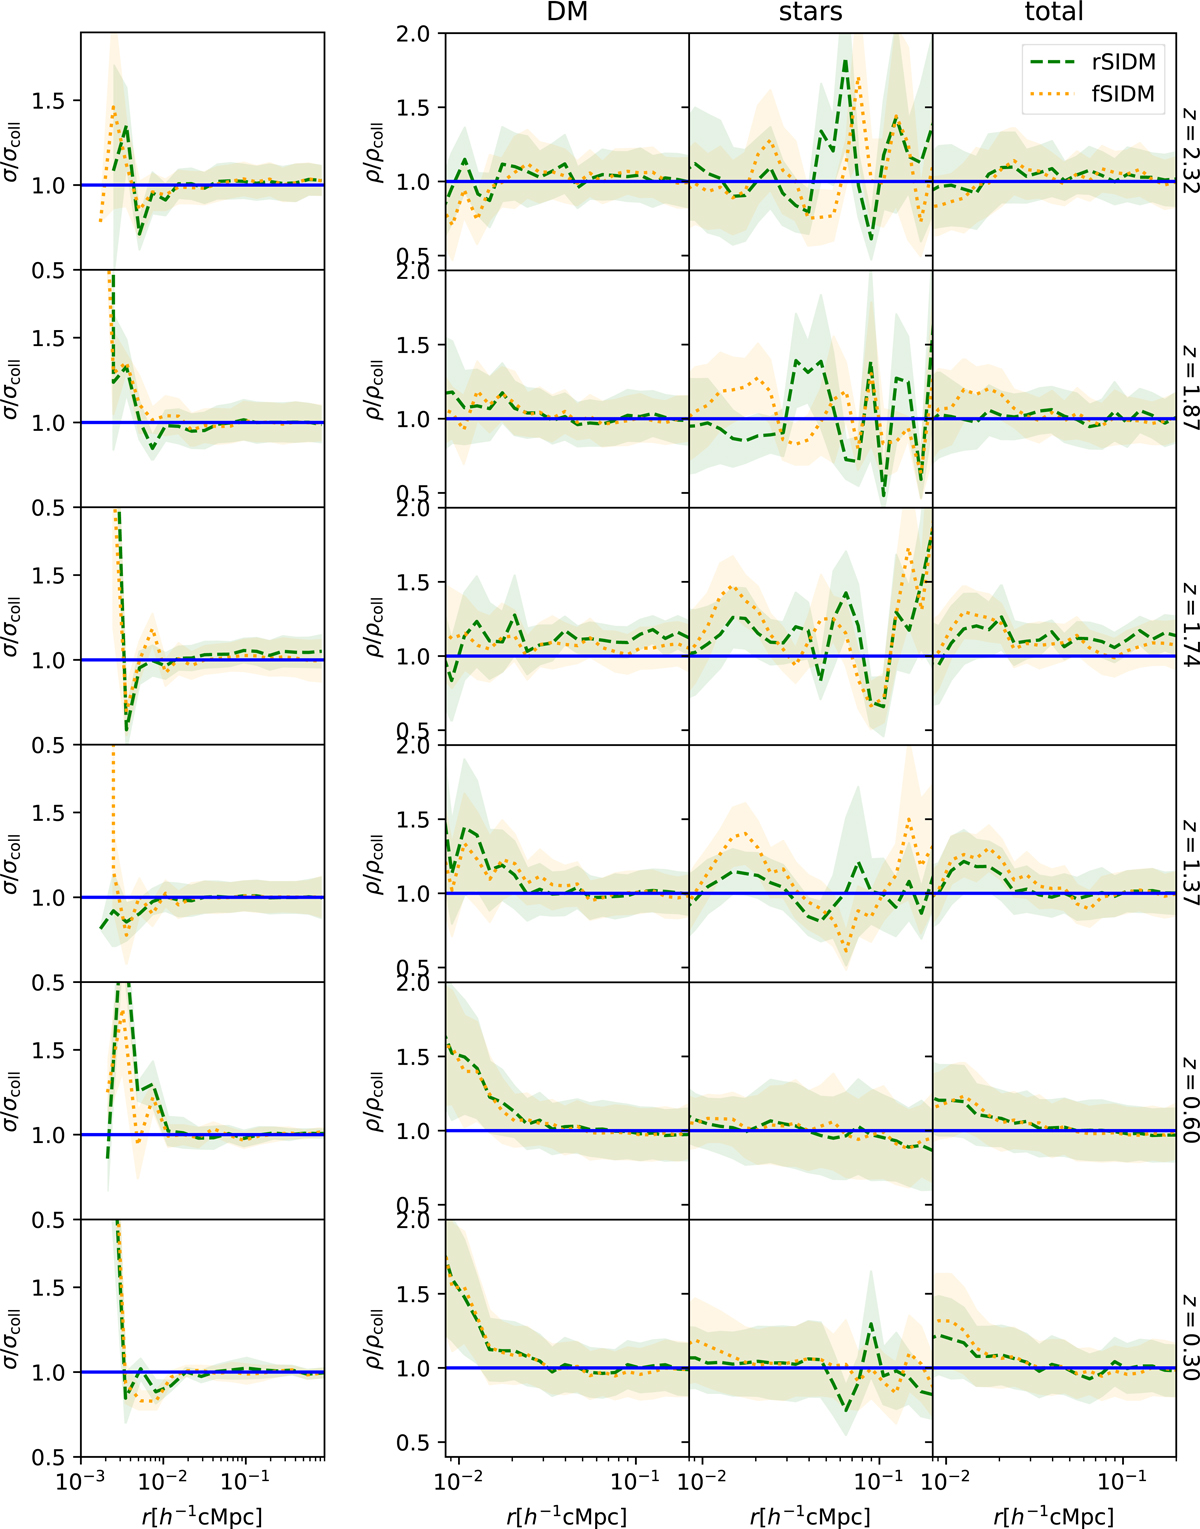
Fig. A.3.
Download original image
Relative velocity dispersion and density profiles of FP SIDM runs vs. FP collisionless DM runs. Each row represents a redshift slice. The left panel shows the relative dispersion profile, while the right panels report the relative density profiles (of DM, stars, and total matter, respectively). The dashed green lines report values for rSIDM, while dotted orange lines report values for fSIDM. The shaded area represents the error on the mean of the size regions. Note that the velocity dispersion relative difference has a different radial range compared to the density relative difference (see discussion).
Current usage metrics show cumulative count of Article Views (full-text article views including HTML views, PDF and ePub downloads, according to the available data) and Abstracts Views on Vision4Press platform.
Data correspond to usage on the plateform after 2015. The current usage metrics is available 48-96 hours after online publication and is updated daily on week days.
Initial download of the metrics may take a while.