Open Access
Fig. A.2.
Download original image
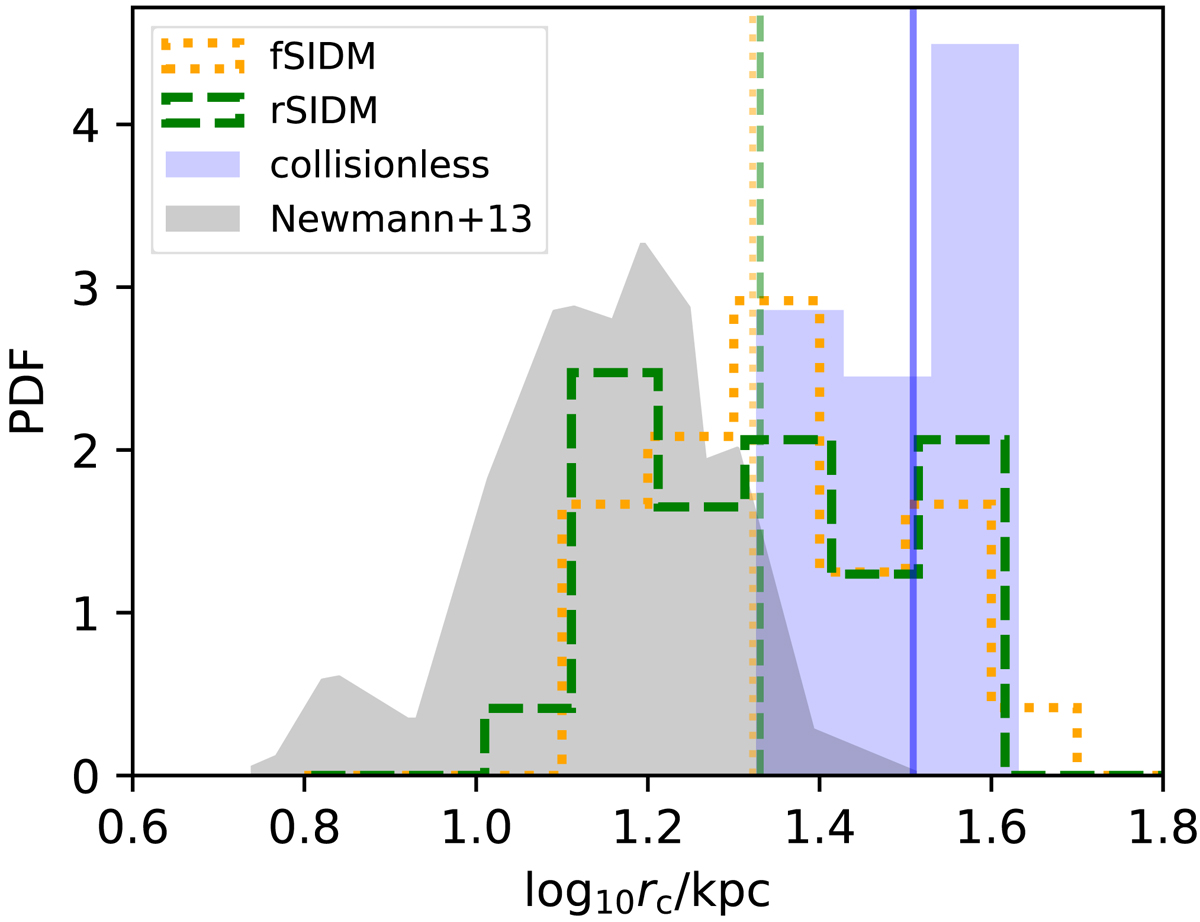
Central density DM core radius PDF. We compare our FP simulations with data from Newman et al. (2013) in the grey histogram. The solid blue histogram reports data from collisionless DM, the dotted orange histogram reports data from fSIDM, and the dashed green histogram reports data for rSIDM.
Current usage metrics show cumulative count of Article Views (full-text article views including HTML views, PDF and ePub downloads, according to the available data) and Abstracts Views on Vision4Press platform.
Data correspond to usage on the plateform after 2015. The current usage metrics is available 48-96 hours after online publication and is updated daily on week days.
Initial download of the metrics may take a while.