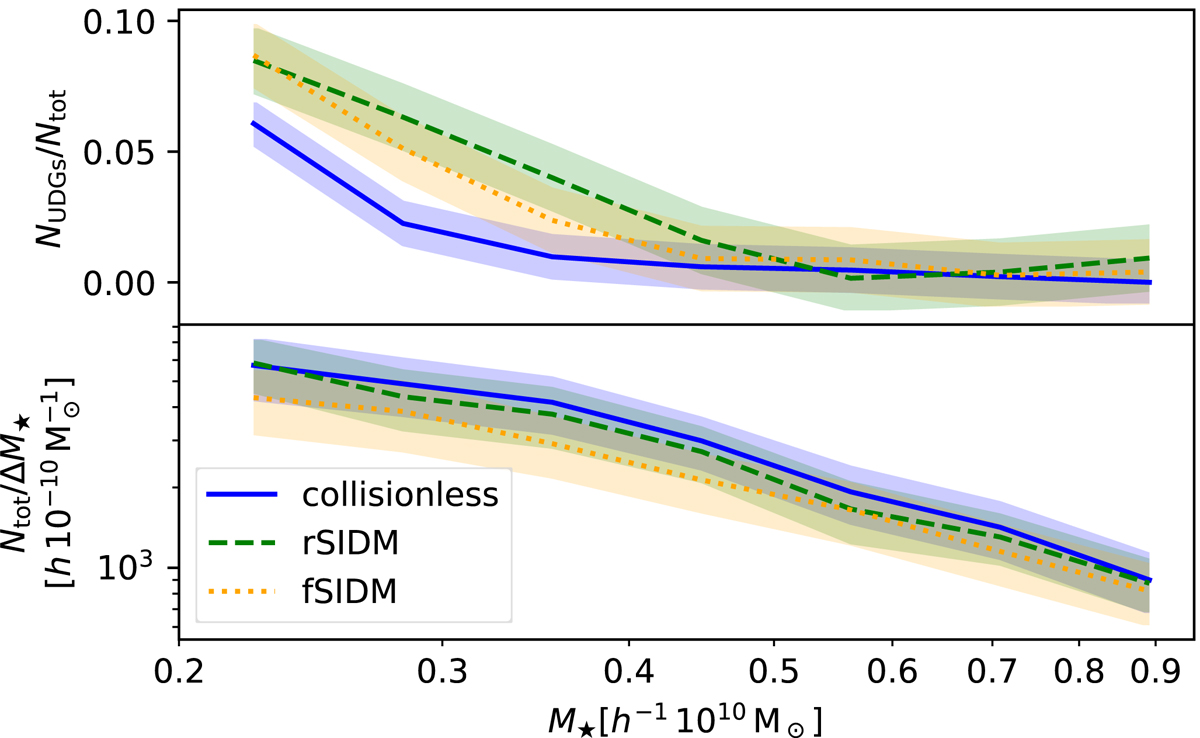
Fig. 14.
Download original image
Number of objects per mass stellar mass bins (upper panel) and the fraction above ΣUDG defined in Sales et al. (2020) for a given stellar mass bin. Here, we consider only objects outside the main halo Rvir and inside the main halo FoF group. The colours are organised as in Fig. 3; the shaded area corresponds to the error of the mean in each bin.
Current usage metrics show cumulative count of Article Views (full-text article views including HTML views, PDF and ePub downloads, according to the available data) and Abstracts Views on Vision4Press platform.
Data correspond to usage on the plateform after 2015. The current usage metrics is available 48-96 hours after online publication and is updated daily on week days.
Initial download of the metrics may take a while.