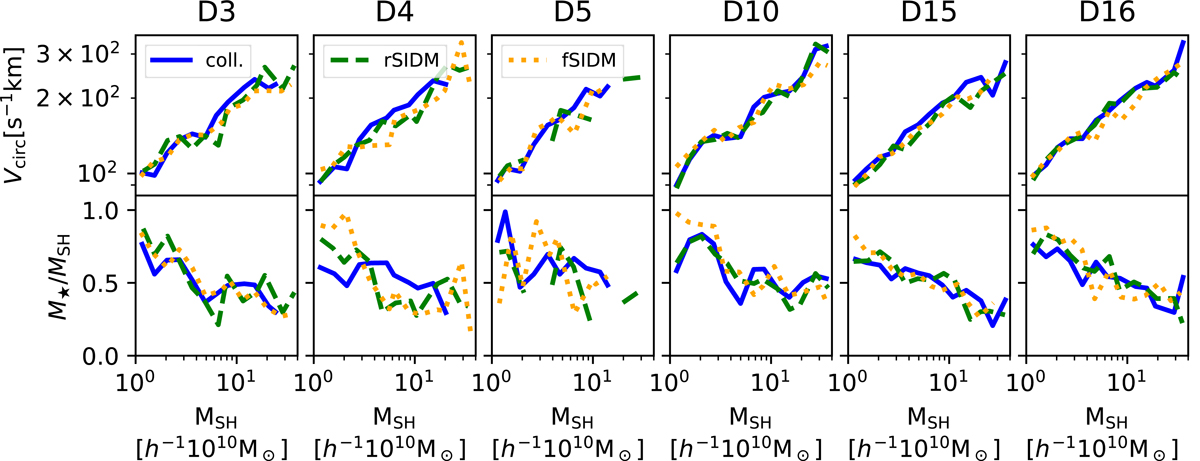
Fig. 11.
Download original image
Subhalo compactness and stellar fraction for subhaloes for cluster centric distances < 0.15 Rvir. The upper panels show the average circular velocity per subhalo mass bin, while the bottom panels refer to the stellar fraction. Each column reports the results for a given re-simulated region (see Table 1). Colour codes and line styles are as in Fig. 3.
Current usage metrics show cumulative count of Article Views (full-text article views including HTML views, PDF and ePub downloads, according to the available data) and Abstracts Views on Vision4Press platform.
Data correspond to usage on the plateform after 2015. The current usage metrics is available 48-96 hours after online publication and is updated daily on week days.
Initial download of the metrics may take a while.