| Issue |
A&A
Volume 675, July 2023
|
|
|---|---|---|
| Article Number | A34 | |
| Number of page(s) | 25 | |
| Section | Interstellar and circumstellar matter | |
| DOI | https://doi.org/10.1051/0004-6361/202245466 | |
| Published online | 29 June 2023 | |
3D physico-chemical model of a pre-stellar core
I. Environmental and structural impact on the distribution of CH3OH and c-C3H2
1
Max-Planck-Institut für extraterrestrische Physik,
Giessenbachstrasse 1,
85748
Garching, Germany
e-mail: This email address is being protected from spambots. You need JavaScript enabled to view it.
2
Niels Bohr Institute, University of Copenhagen,
Øster Voldgade 5-7,
1350
Copenhagen K, Denmark
Received:
14
November
2022
Accepted:
3
May
2023
Abstract
Context. Pre-stellar cores represent the earliest stage of the formation process of stars and planets. By characterizing the physical and chemical structure of these cores, we can establish the initial conditions for star and planet formation and determine to what degree the chemical composition of pre-stellar cores is inherited by the later stages.
Aims. We aim to determine the underlying causes of spatial chemical segregation observed in pre-stellar cores and study the effects of the core structure and external environment on the chemical structure of pre-stellar cores.
Methods. A three-dimensional (3D) magnetohydrodynamic model of a pre-stellar core embedded in a dynamic star-forming cloud was post-processed with a sequentially continuum radiative transfer, a gas-grain chemical model, and a line-radiative transfer model. The results were analyzed and compared to observations of CH3OH and c-C3H2 in L1544. We compared nine different chemical models to the observations to determine which initial conditions are compatible with the observed chemical segregation in the prototypical pre-stellar core L1544.
Results. The model is able to reproduce several aspects of the observed chemical differentiation in L1544. Extended methanol emission is shifted towards colder and more shielded regions of the core envelope, while c-C3H2 emission overlaps with the dust continuum, which is consistent with the observed chemical structure. Furthermore, these results are consistent across a broad spectrum of chemical models. Increasing the strength of the interstellar radiation field or the cosmic-ray ionization rate with respect to the typical values assumed in nearby star-forming regions leads to synthetic maps that are inconsistent with the observed chemical structure.
Conclusions. Our model shows that the observed chemical dichotomy in L1544 can arise as a result of uneven illumination due to the asymmetrical structure of the 3D core and the environment within which the core has formed. This highlights the importance of the 3D structure at the core-cloud transition on the chemistry of pre-stellar cores. The reported effect is likely to affect later stages of the formation process of stars and planets through chemical inheritance.
Key words: astrochemistry / radiative transfer / methods: numerical / ISM: abundances / stars: formation
© The Authors 2023
 Open Access article, published by EDP Sciences, under the terms of the Creative Commons Attribution License (https://creativecommons.org/licenses/by/4.0), which permits unrestricted use, distribution, and reproduction in any medium, provided the original work is properly cited.
This article is published in open access under the Subscribe to Open model.
Open Access funding provided by Max Planck Society.
1 Introduction
Stars such as the Sun form from the collapse of cold self-gravitating cores known as pre-stellar cores. The collapse of these cores marks the earliest stage of the star and planet formation process and, consequently, sets its initial conditions (e.g., Bergin & Tafalla 2007). Studying the chemical inventory during this stage thus provides direct insights into the chemical inventory that will ultimately be inherited by forming planets. (e.g., Caselli & Ceccarelli 2012).
Pre-stellar cores are found in a variety of different cloud environments, ranging from isolated Bok globules to dense clusters embedded in molecular clouds. How variations in the local environment influence the chemical composition of pre-stellar cores remains an open question. In a recent work, Spezzano et al. (2016) mapped the emission of methanol (CH3OH) and cyclopropenylidene (c-C3H2) in the pre-stellar core L1544 and found a complementary morphology in the emission of the two molecules as shown in Fig. 1. The chemical segregation observed in L1544 appeared to be caused by uneven illumination of the core by the interstellar radiation field (ISRF) because the methanol emission peaks on the northwestern side of the core where the H2 column density shows a more shallow drop than the remaining directions. Later, Spezzano et al. (2017) mapped a large selection of molecules across L1544 and performed a principal component analysis on the emission maps. Their analysis confirmed the previously reported dichotomy between c-C3H2 and CH3OH and also found additional components linked to the dust peak of the core and HNCO. The analysis has suggested that the emission morphology was determined by both local variations in temperature and the external variation in the incident ISRF. Furthermore, the observed dichotomy in c-C3H2 and CH3OH has recently been reported in a larger sample of starless and pre-stellar cores (Spezzano et al. 2020). As such, the local cloud environment appears to influence the chemical structure of pre-stellar cores and may furthermore impact the chemical composition during planet formation through chemical inheritance.
There is growing evidence that the chemistry at the pre-stellar phase is partially inherited by the later stages of star and planet formation and, consequently, this environmental effect could influence the chemistry during planet formation. One prominent tracer of chemical inheritance is the degree of deuterium fractionation which record variations in the physical conditions during the formation of deuterated molecules (e.g., van Dishoeck et al. 2014; Ceccarelli et al. 2014). By comparing the D/H ratio in Solar System bodies with astrochemical models of the protosolar nebula, Cleeves et al. (2014) demonstrated that the observed D/H ratio in the Solar System cannot be formed in situ and that it requires inheritance of pre-stellar water with a high D/H ratio. Likewise, the high D2O/HDO ratios in embedded protostars indicate a substantial degree of inheritance of water from the pre-stellar phases (Furuya et al. 2016; Jensen et al. 2021b). Furthermore, comparisons between the chemical content of the Class 0 binary source IRAS 16293–2422 and Comet 67P provides tentative support for a high degree of inheritance for a larger number of molecules, as the relative abundances of complex organic molecules (COMs) show a correlation between the protostellar hot corino chemistry and the cometary composition (Drozdovskaya et al. 2019). These results suggest that the chemical composition during the pre-stellar phase plays a crucial role in the chemical composition in protoplanetary disks during the epoch of planet formation.
To understand the degree of chemical diversity among young star-forming systems, the effect of the different environments must be studied. Examples of previous work include the systematic studies between different molecular clouds (e.g., PEACHES and ORANGES, Yang et al. 2021; Bouvier et al. 2022) and comparisons between carbon-chain molecules and complex organic molecules in different regions of molecular clouds (e.g., Higuchi et al. 2018). Another example is the comparison of the D/H ratio of water between isolated and clustered Class 0 protostars (Jensen et al. 2019). These studies indicate a dichotomy between isolated and clustered protostars and support an inheritance scenario for water. However, it is not yet understood what drives the apparent chemical differentiation between different environments and how strongly it can impact the chemical composition.
In this work, we aim to explore the origin of the observed chemical morphology of L1544 and establish what physical and chemical processes drive the chemical segregation in pre-stellar cores. L1544 is a pre-stellar core located on the edge of the Taurus molecular cloud at a distance of 170 pc (Galli et al. 2018). Both the physical and chemical structure of the core has been the subject of several studies (e.g., Tafalla et al. 2002; Caselli et al. 2012, 2019, 2022; Keto et al. 2015). The center of L1544 is cold and dense, with temperatures as low as 6.5 K and the volume density rising as high as 107 cm−3 (Crapsi et al. 2007; Chacón-Tanarro et al. 2019). Molecular line emission observed towards the dust peak of L1544 has been successfully modeled using the 1D physical model presented in Keto & Caselli (2010). However, maps of molecular emission shows clear sign of a non-spherical structure (e.g., Spezzano et al. 2017). Both the continuum emission and molecular emission show an elongated structure, which is not accounted for in 1D models. Thus, a full 3D model is likely needed to explain the chemical segregation within the core. Furthermore, Caselli et al. (2019) and Zhao et al. (2021) studied the collapse of a dense core using a three-dimensional (3D) non-ideal magnetohydrodynamic (MHD) code and found that an asymmetric disk-like structure forms in the pre-stellar phase. This work presents a 3D ideal-MHD model of a pre-stellar core analog to L1544. The model includes a detailed chemical network and realistic boundary conditions from a large-scale molecular cloud simulation. This allows us to study the chemical structure of a non-spherical pre-stellar core in a realistic dynamic star-forming environment and test the proposed origin of the chemical structure of the core. In this initial work, we focus on the chemical structure of CH3OH and c-C3H2, leaving other molecules for future publications.
The paper is organized as follows. The second section introduces each element of the model. In the third section, we compare both the continuum and the molecular emission from the simulated pre-stellar core with L1544. The implications of the model, along with its caveats, are discussed in the fourth section. Our conclusions are presented in the last section.
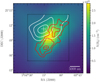 |
Fig. 1 Observations of c-C3H2 and CH3OH toward L1544 with the IRAM 30m telescope. The red contours show the integrated emission of c-C3H2 32,2−31,3 and the crosshair indicates the peak of the emission map. White contours and crosshair show the same for CH3OH 21,2−11,1. For both molecules, the contours indicate 50, 70, and 90% of the peak emission. The black dotted square indicates the region mapped with the 30 m. The colormap shows the H2 column density map derived from Herschel/SPIRE observations. Both the column density and molecular emission maps are drawn from Spezzano et al. (2016). |
2 Model description
2.1 Physical pre-stellar core models
To study the impact of the surrounding star-forming environment, we selected a pre-stellar core embedded in a large-scale simulation of a 4 pc3 star-forming molecular cloud. The dynamical evolution of the molecular cloud was modeled using the adaptive mesh refinement finite volume ideal-MHD code RAMSES (Teyssier 2002). A detailed description of the physical model is presented in Haugbølle et al. (2018). Here, we briefly introduce the characteristics of the model. In the model, turbulence in the gas is driven with a solenoidal powerspectrum on the largest scales maintaining a 3D rms velocity of 2 km s−1 and an isothermal equation of state is used. Sink particles that can accrete gas from the surroundings and represent stars form at the highest level of refinement, when a grid cell is detected as unequivocally collapsing (Haugbølle et al. 2018). There are 134 million Lagranian tracer particles, with 6.6 Earth masses apiece, which passively follow the flow of the gas while recording the density, velocities, and magnetic field strengths to record the flow of matter in the model. The molecular cloud model reproduce well the physical and statistical conditions of a local low mass star forming region, including the star formation rate and initial mass function (Haugbølle et al. 2018), core mass function (Pelkonen et al. 2021), and the multiplicity distribution (Kuruwita & Haugbølle 2023). The model is well suited to study star formation as a heterogeneous process, where the physical evolution on larger scales may impact the physical and chemical evolution on smaller scales. The physical simulation uses adaptive mesh refinement (AMR) with a root grid of 5123 and six levels of refinement. This results in a minimum cell-size of 25 au in models presented here. This resolution is sufficient to study the dynamics from the larger molecular cloud scales down to individual pre-stellar cores. Protostellar feedback, for instance, jets and outflows, were not included in the model, since we are concerned with pre-stellar phase in this work. In addition, L1544 is rather isolated so nearby protostars are unlikely to impact the structure of the core. The entire 4 pc3 box is shown in Fig. 2.
Within the computational domain we selected a pre-stellar core resembling L1544. A description of the selection criteria is presented in Sect. 3.1. Around the selected pre-stellar core, we extracted a spherical cutout with a radius of 5 × 10⁴ au, which is used for the post-processing steps of the model, introduced in the subsequent sections. We carried out the post-processing and analysis on this reduced domain because performing a full radiative transfer simulation on the entire 4 pc3 box is unfeasible given the number of photons needed to sample a domain of that size. The center of the core is defined as the cell with the highest density.
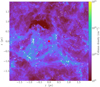 |
Fig. 2 Projected H2 column densities in the molecular cloud simulation. A total of 233 protostars, denoted with white crosses have formed in this snapshot from the simulation (t = 1.66 Myr). Most protostars form in clusters along filaments. The red diamond marks the protostar that is studied here during the pre-stellar phase. We centered the pre-stellar core in the figure for clarity, since the box has periodic boundary conditions. |
2.2 Continuum radiative transfer
To determine the thermal structure of the pre-stellar core, we computed the dust temperature in the core using the MCTHERM routine from the Monte Carlo radiative transfer code RADMC-3D (Dullemond et al. 2012). The radiation source was the ISRF, irradiating the core from the edges of the 5 × 10⁴ au cutout around the pre-stellar core. A high number of photons was necessary to sample the central parts of the core due to the high opacity and large computational domain and we chose to inject 2.5 × 10⁸ photons in this work. We used the ISRF from Zucconi et al. (2001), with the modification in the mid-infrared as presented in Hocuk et al. (2017). The UV range of the ISRF is composed of the Draine field (Draine 1978), similar to the one used to compute the photo-rates in Heays et al. (2017), for consistency with the chemical model. We denote the standard strength of the ISRF as G. In the fiducial model, we assumed an external extinction of Av,ext = 2 mag around the core. This value was previously used in the 1D radiative hydrodynamical model presented in Sipilä et al. (2017). Values with Av,ext = 0 mag and Av,ext = 4 mag were also tested. A lower limit on the temperature of 6 K was imposed. Due to the high density in the center of the core and the large computational domain, some cells were not be well sampled (i.e., low photon counts) and thus exhibit temperatures below this limit. We do not consider this to be physical but rather a limitation of the current model. Nonetheless, the hard limit of 6 K does not have a notable impact on the results presented here as the cells with temperature below 6 K represent less than 0.6% of the total number of cells.
We assumed that dust and gas are well-coupled and remain in thermal equilibrium. This assumption only holds at higher densities (≳105 cm−3, Goldsmith 2001), however, previous 1D studies of pre-stellar cores with coupled radiative hydrodynamics have found that the difference between gas and dust temperatures remains limited (i.e., ΔΤ ≲ 2 K, Sipilä et al. 2017) and, consequently, the impact on the chemistry is negligible compared to the uncertainties on other parameters in grain-surface chemical models.
The fiducial model used the dust opacities for protostellar cores presented in Ossenkopf & Henning (1994) for thin ice layers and dust coagulation for 105 years at a density of n = 106 cm−3 (from here-on referred to as OH94). These opacities provide a good match to observations of pre- and protostellar cores (e.g., van der Tak et al. 1999; Evans et al. 2001; Jørgensen et al. 2002). However, using a single set of dust opacities across the core is a simplification, since the ice thickness, composition, and grain size may vary across the core, impacting the opacity of the dust grains. Changing the dust opacity to bare dust grains or grains covered with thick ice layers, as per Ossenkopf & Henning (1994), only has a limited impact on the thermal structure of the core presented here.
In addition to the thermal dust continuum calculation, we calculated the radiation field in the core using the MCMONO routine in RADMC3D for a single wavelength, λ = 550 nm. This allowed us to estimate the visual extinction in each cell of the model, which was used for the chemical post-processing. We computed the visual extinction following the approach of Hocuk et al. (2017), as follows:
 (1)
(1)
where τ550 is the optical depth at 550 nm computed from:
 (2)
(2)
Here, Icell,550 denotes the computed intensity in a cell at 550 nm, while IISRF,550 is the unattenuated intensity of the interstellar radiation field at the same wavelength.
2.3 Chemical model
The chemical structure of the pre-stellar core was computed using a rate-equation approach (Hasegawa et al. 1992). Rather than calculating the evolution independently for each cell (>106 cells), we computed the chemical evolution for a grid of physical conditions and used a linear interpolation to estimate the chemical composition in each cell. The interpolation grid consists of six dimensions: total density of hydrogen, nH, extinction, Av, temperature, T, ISRF factor, G, and cosmic-ray ionization rate, ηCR. A linear interpolation was performed using the NDLINEARINTERPOLATION routine from SCIPY (Virtanen et al. 2020), which relies on QHULL (Barber et al. 1996) for interpolation in higher dimensions. Density and cosmic-ray ionization rate were interpolated in log-space. To validate the interpolation method, we compared direct and interpolated chemical abundances on the 1D model of L1544 derived in Keto et al. (2015) in Appendix A.
The chemical model was introduced in Jensen et al. (2021a) and we limit this introduction to the key aspects. The gas-phase network was based on the KIDA network (Wakelam et al. 2015), extended to include deuterated species and spin-chemistry for H2 and  , as presented in Majumdar et al. (2017) and Sipilä et al. (2017). A total of ~950 gas-phase species and ~50 000 reactions are included. Furthermore, a number of photo dissociation rates have been updated based on Heays et al. (2017). Three-body reactions were not included in the network.
The grain surface network was based on the OSU network (e.g., Garrod et al. 2007) and includes ~450 species and ~3500 reactions. The grain-surface formation pathway for methanol formation was adapted from Taquet et al. (2014). Deuterated iso-topologs are included for species with up to four carbon atoms. Surface reactions occur through the Langmuir-Hinshelwood mechanism using thermal diffusion on the grain surface. The chemical model considered a single grain size, with a radius of 10−5 cm and 1.8 × 10⁶ sites per grain (e.g., Semenov et al. 2010). Reaction barriers can either be overcome thermally or through quantum tunneling, depending on which is faster. A barrier width of 1.0 Å was assumed, except for the reactions listed in Appendix B. The model included reaction-diffusion competition, as introduced in Chang et al. (2007). The effect of grain coagulation on the chemistry is not considered in this work.
The grain-surface network included a number of non-thermal desorption mechanisms which may be crucial in starless and pre-stellar cores. Chemical desorption was included, following the implementation presented in Garrod et al. (2007) with an efficiency factor of 0.01. Cosmic-ray (CR) desorption was included using the description from Leger et al. (1985) and Hasegawa & Herbst (1993a). An updated treatment of CR desorption is presented in Sipilä et al. (2021), but is not yet implemented here. We consider both photodesorption by CR-induced UV photons and UV photons from the ISRF. Photodesorption yields for N2, CO, CO2, and H2O were based on laboratory studies of Oberg et al. (2007); Öberg et al. (2009) and Fayolle et al. (2011, 2013). For the remaining species, a fixed desorption yield of 10−3 was adopted (Furuya et al. 2015). The network included the photodissociation of grain-surface species. The rates here were approximated using the approach from Furuya et al. (2015), which estimates the grain-surface photodissociation rates by rescaling the gas-phase photodissociation rates. The scaling factor was derived from the ratio of the H2O photodissociation rates in gas and on grain surfaces, which had been calculated explicitly. The full network is available in the chemical model repository1.
In Jensen et al. (2021a) a three-phase model was utilized (i.e., separation of surface and mantle chemistry) while a simpler two-phase model was utilized here. This was done to reduce computational time. Furthermore, Sipilä et al. (2017) found that their two-phase model provides a better match to observations of L1544 than their three-phase model for a subset of deuter-ated species. We therefore opted for the simpler model to reduce the impact of uncertain parameters such as binding energies for surface and mantle species and reduce the overall complexity of the chemical model. Exploring the differences between the two and three phases models goes beyond the scope of the present paper.
Our fiducial model starts from the elemental abundances listed in Table 1 and is evolved for 106 yr for each point in the grid. A standard ISRF intensity G0=1 is used together with a cosmic-ray ionisation rate of 3 × 10⁻¹⁷s−1. This value was recently proposed as the best-fit constant value for L1544, based on 1D astrochemical modeling of ionic emission fitted to observations (Redaelli et al. 2021). Since the initial conditions and the timescale of the chemical model can have a substantial impact on the chemical abundances we tested a number of alternative chemical models. Variations include the addition of a low-density initial phase Tinit at a fixed density and temperature (nH = 5 × 102cm−3, T = 15 K), different chemical timescales Tmain in the entire physical grid and variations in the intensity of the ISRF and the cosmic-ray ionization rate. An overview is listed in Table 2.
Initial abundances following Semenov et al. (2010), except for the inclusion of ortho and para spin-states of H2.
2.4 Line radiative transfer
The last step of the model is a non-LTE calculation of molecular emission from selected molecules. We used the 3D LIME radiative transfer code (Brinch & Hogerheijde 2010). LIME is a Monte Carlo radiative transfer code which solves the radiative transfer equation using the accelerated lambda iteration (ALI) method (Rybicki & Hummer 1991). The computational grid in LIME was constructed using 3 × 10⁴ randomly sampled points P and the domain is limited to a radius of 2.5 × 10⁴ au. We limit the domain to this region to reduce computational time. The reduced domain matches the region that is usually mapped across L1544 with the 30 m telescope (e.g., Caselli et al. 1999; Spezzano et al. 2016; Redaelli et al. 2019). The code connects the random point distribution by performing a Delauney triangulation in 3D using the Qhull library (Barber et al. 1996). The grid is then constructed by performing Voronoi tesselation. In Voronoi tesselation, individual cells are created for each point P. The extent of each Voronoi cell is defined as the 3D region nearest to a point P. For a complete description of the grid construction we refer to Brinch & Hogerheijde (2010). The molecular level populations based on collisional rates is provided in the LAMDA format (Schöier et al. 2005). We ran 24 iterations for all molecules, which was sufficient to insure convergence of the level populations. LIME computes a spectral cube of the simulated frequency range from which both molecular maps and spectra can be extracted. We placed our source at a distance of 170 pc, similar to the distance to L1544 (Galli et al. 2018), and convolved the spectral cubes with a 2D Gaussian beam to match the observations. We then compared these results with the simulated images in the subsequent steps described in the following subsections.
3 Results
3.1 Selecting a L1544 candidate
We selected a pre-stellar core from the RAMSES simulation that resembles L1544 both in terms of its intrinsic characteristics such as mass and central density and the surrounding environment. The estimated mass of L1544 is variable, depending on the method employed. From C18O (1−0) observations, Tafalla et al. (1998) estimated a mass of 8 M⊙ within a contour of approximately 0.1 × 0.2 pc. However, estimates from continuum observations point to a lower mass of ~2 M⊙ (e.g., Evans et al. 2001). This difference of a factor of four likely stems from the assumptions and limitations of each method. The molecular estimate assumes a fixed relative abundance, XCO, across the core, not accounting for CO freeze-out. Meanwhile, mass estimates derived from continuum observations assume a single dust opacity across the core and are derived from observations using the “chopping” method. The use of chopping results in some filtering of extended envelope emissions which contribute to the mass estimated using molecular tracers (Shirley et al. 2000). The assumption of a single dust opacity is not likely to be satisfied. At lower densities in the exterior shells of the core, dust grains are likely covered by less ice, while dust grains at higher densities are covered by thick ice shells and may undergo coagulation. Furthermore, changes in the ice composition, for instance, due to CO freeze-out, may also impact the exact opacity. Both mass estimates also assume a single temperature across the core. To summarize, the mass of L1544 is not well-constrained, but estimates lie in the range M ∊ [2.0, 10.0] M⊙. We selected a core with a mass of 8.25 M⊙ within a radius of 2 × 10⁴ au, which is compatible with the estimated mass range.
Recent interferometric observations have revealed a kernel at the center of the core, with a radius of 1800 au and a mean density of 106 particles cm−3 (Caselli et al. 2019). The selected core in this study has a mean density of 1.2 × 10⁶ particles within a radius of 1800 au. The line-of-sight CO depletion factor in L1544 was estimated by Caselli et al. (1999) to be on the order ~10, using single-dish observations of 17CO (1−0) and continuum observations while the core studied here has a line-of-sight CO depletion factor of ~50 on similar scales (i.e., within r ~ 6500 au). This corresponds to a local CO depletion factor of more than 1000 in the central region of the core.
In terms of the local cloud environment, L1544 is located at the edge of the Taurus molecular cloud and shows evidence of uneven illumination (Spezzano et al. 2016). We therefore searched for a pre-stellar core formed in relative isolation (i.e., no nearby stars during the pre-stellar phase). The selected pre-stellar core is not representative of a Bok globule (i.e., not like B68, Alves et al. 2001) as it is still embedded in the parent molecular cloud. The core is isolated during the pre-stellar phase and remains so for the first 2 × 10⁵ yr after the formation of the protostar.
A simulated continuum image of the selected L1544 analog is shown in Fig. 3, alongside continuum observations presented in Chacón-Tanarro et al. (2019). The spectral energy distribution (SED) of the core is shown in Fig 4 and compared with the SED presented in Chacón-Tanarro et al. (2017). As found in previous works (e.g., Zucconi et al. 2001), the OH94 dust opacities lead to a brighter continuum than what is observed, which is also evident from the SED in Fig. 4. A lower dust opacity of 0.2 × κOH94 is also included for comparison. A lower mass core would bring the modeled continuum closer to the observed value, but be inconsistent with the derived molecular masses. A more realistic dust model, accounting for different dust sizes and ice coverage and the consequent variations in opacity is likely needed to remove these discrepancies.
The morphology of the selected core shares similarities with L1544. The core is not spherically symmetric, but rather elongated along the southwest to northeast diagonal in the sky. The flattened disk-like appearance can arise from either the compressive flows in the turbulent molecular cloud or due to the preferential collapse of the cloud parallel to the direction of the magnetic field (e.g., Ciolek & Basu 2000).
Overview of the different chemical setups included in this work.
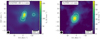 |
Fig. 3 Comparison of the continuum at 1.1 mm as modeled using RADMC-3D and as observed using the AzTEC continuum camera at the LMT (presented in Chacón-Tanarro et al. 2019). Contours indicate 40, 60, and 80% of the peak intensity in each case. The beam-size of the AzTEC bolometer is 12.6″ and the synthetic observation has been convolved with a Gaussian of the same size. The linear scale is shown in the lower left of each panel, assuming a distance of 170 pc to L1544 and the model core. The beam size is shown in black in the lower left corner. |
3.2 Comparing 1D and 3D models of L1544
The 1D spherically symmetric model presented in Keto & Caselli (2010) has been used in a number of works to successfully reproduce the line profiles of several molecules toward the dust peak (e.g., Caselli et al. 2012; Redaelli et al. 2019; Giers et al. 2022). However, the dust continuum emission toward L1544 shows a clear asymmetry, which may impact the chemical structure on larger scales. In this section, we first compare the prestellar core structure from the 3D MHD simulation to the 1D hydrodynamical structure from Keto & Caselli (2010). Later, we compare the radial abundance profiles of select species.
In Fig. 5, we show a comparison of the radial temperature, density, and visual extinction in the 3D MHD model and the canonical 1D model from Keto & Caselli (2010). The 3D model shows higher temperatures for the region with r > 103 au. The variation in temperature stems from both variations in the assumed dust opacity, but also variation in the large-scale structure of the core. For the density profiles, the 1D model resembles a mean profile of the 3D profiles out to around 104 au. The visual extinction profiles for the 3D model show some deviations from the 1D profile, especially at larger radii (e.g., the pink and orange profiles). Most notable is the brown profile for which the visual extinction increases beyond Av = 10 at a radius of ≳3 × 10³ au, while the remaining profiles reach Av = 10 at r < 2 × 10³ au. The higher shielding can locally increase the CO freeze-out and promote the formation of complex organic molecules (Vasyunin et al. 2017). Overall, the 3D model clearly shows a deviation from the spherical model. Nonetheless, the structure of the 1D model is a good match to the 3D model at lower radius, where the density is high, and also follows a similar trend as the average profile for the 3D model (Ciolek & Basu 2000; Chacón-Tanarro et al. 2019). To provide a visual indication of the asymmetries in the 3D model, we computed Gaussian kernel density estimates (KDE) for the cell temperature, density, and extinction as a function of radius. The results are shown in Fig. 6 and demonstrate that the physical conditions present a large spread due to the asymmetrical core structure. At 1000 au, the local density varies by several orders of magnitude (105−107 cm−3), the temperature varies between 6 and 9 K, and the visual extinction ranges from 7–35 mag. In Appendix C we have included the radial profiles similar to Fig. 5 for the remaining two coordinate planes of the model.
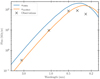 |
Fig. 4 Comparison between the spectral energy distribution of the modeled core and L1544. The observed values for L1544 are indicated with black crosses and are taken from the work by Chacón-Tanarro et al. (2017). The blue line shows the SED for the core model computed using the standard OH94 dust opacities, while the orange line shows the SED when the dust opacities have been multiplied by a factor of 0.2 to match the continuum emission at 1.1 mm. |
3.3 Chemistry of c-C3 H2 and CH3 OH
The formation of methanol in star-forming regions has been studied extensively and occurs primarily through sequential hydrogenation of CO on grain surfaces (e.g., Watanabe & Kouchi 2002; Hidaka et al. 2009; Fuchs et al. 2009; Minissale et al. 2016):
 (3)
(3)
Thus, the formation of methanol is dependent on the presence of CO ice and H atoms on the dust grains, both of which strongly depend on the local temperature, irradiation, and density. Indeed, the formation of methanol is especially efficient at the catastrophic CO freeze-out zone of pre-stellar cores (Caselli et al. 1999; Vasyunin et al. 2017), as CO ice allows CH3 OH molecules to return in the gas phase via reactive desorption more efficiently than H2O ice. The formation of c-C3H2, on the other hand, occurs through dissociative recombination in the gas-phase (e.g., Thaddeus et al. 1985; Sipilä et al. 2016):
 (4)
(4)
 (5)
(5)
These reactions are less dependent on the temperature and can occur prior to CO freeze-out at higher temperatures and lower densities. In Fig. 7, we compare the radial abundance profiles of c-C3H2 and CH3 OH for the 1D model of Keto & Caselli (2010) with abundance profiles for the 3D core presented in this work. The lower panel shows an enhancement of the methanol abundance for the brown profile at ~2500 au corresponding to the density and visual extinction enhancements seen in Fig. 5. This confirms that regions with higher visual extinction and density also show a higher methanol abundance, which may be offset from the center of the core. Figure 7 shows a significant scatter among the different radial directions of the 3D model which results from the non-symmetrical structure of the core. The same effect is seen in Fig. 8, where a Gaussian KDE is performed for the gas-phase c-C3 H2 and CH3 OH abundances for all cells in the core as a function of the local extinction. The figure shows that many cells in a model with low visual extinction (log Av < 0.4) have number densities of c-C3H2 of >10−6 cm−3. At higher visual extinction the number densities of c-C3H2 increases until around 10 mag, where freeze-out starts to lower the absolute value. For CH3 OH, the picture is different. Methanol is not formed at the lowest visual extinction, since CO does not fully freeze-out yet. From log Av > 0.45 the number densities of CH3 OH reaches ~10−6 cm−3 and at higher visual extinction methanol continues to reach higher number densities. Figure 8 also shows that c-C3H2 exhibits a stronger correlation with the local extinction, while a larger spread is seen in the CH3 OH panel at higher visual extinction. To understand this difference, we have to consider the different formation pathways of the two molecules. Methanol is formed through grain-surface reactions and desorbed into the gas-phase primarily through chemical desorption (Minissale et al. 2016; Vasyunin et al. 2017). On the other hand, c-C3H2 is formed in the gas-phase through ion-neutral reactions. This difference in formation pathways leads to the different behavior at higher visual extinction: methanol formation is still active at a higher visual extinction, with different formation rates depending on the local physical conditions and resulting in a continued release of methanol into the gas-phase through chemical desorption. For c-C3H2, the formation rate is primarily determined by the balance between the formation rate and the adsorption rate. Thus, the larger spread in gas-phase abundances for methanol stems from the stronger dependence on the local temperature and density for the grain-surface chemistry. Additional KDE figures for the cell density, temperature, and radius are shown in Appendix D.
3.4 Comparing molecular emission maps
The top row of Fig. 9 shows a comparison between the morphology of the c-C3H2 32,2−31,3 transition at 84.728 GHz and the CH3 OH 21,2−11,1 transition at 96.739 GHz, for the fiducial model. The contours show the structure of the integrated intensity (moment-zero) maps for each transition. The three top panels of the figure show that the spatial location and extent of each molecular transition depends on the viewers location of the cloud core. The selected transitions are the same as those observed in Spezzano et al. (2016) toward L1544. In L1544, these molecules were found to trace different environments, notably related to the uneven illumination of the core. To test whether the molecular morphology in the present model shows a similar dependence on illumination, we present visual-extinction and dust-temperature maps of the core in the middle and bottom rows of Fig. 9. Both panels show that the methanol emission is tracing the more shielded region of the core where the impact of photochemistry is reduced. In the top left panel of Fig. 9 (x − y plane), the methanol emission is shifted towards the right region of the dust continuum. This region also shows a drop in temperature and an increase in visual extinction, namely, a higher shielding from the ISRF. The same trend is seen in the middle figure on the top row (x − y), where the methanol emission is again extended towards the right of the dust peak which is more shielded (i.e., lower dust temperature and higher visual extinction). For the third panel, methanol emission is mostly centered on the dust continuum, but still overlapping with the more shielded regions of the core. For c-C3H2, the emission appears to trace a different gas component. In the x − y and x − z planes, the emission of c-C3 H2 peaks close the dust peak, while in the z − y plane the brightest emission is shifted far from the dust peak. The contours of the c-C3H2 and CH3OH emission overlaps to a large extend in all planes, but the peak position varies considerably.
To better quantify the observed patterns, we computed the Pearson correlation coefficients, p, between column density maps of N(H2),  ,
,  , N(CH3OH), and N(c-C3H2). Here, N denotes the column density while
  denotes the normalized column density. We used normalized column densities for visual extinction and gas temperature since the integrated column of these quantities are non-physical. The results are shown in Table 3. First of all, the analysis shows correlation between the H2 column density and integrated visual extinction (
 averaged across the three principal planes), as well as an anti-correlation between the integrated gas temperature and H2 column density (
 averaged across the three principal planes). The analysis also shows correlations between N(H2) and both N(CH3OH) and N(c-C3H2), of
  and
and  , respectively. Notably, a strong correlation of
  is found between the normalized column density of the visual extinction
  and N(CH3OH), while a weaker correlation of
  is found between
  and N(c−C3H2). Similarly, an anti-correlation is seen between the normalized integrated temperature and the two molecular species. While both molecules are correlated with the H2 column density and the integrated visual extinction in the maps as well, the analysis shows that the carbon-chain molecule c-C3H2 is more strongly correlated to the H2 column density than CH3OH, while CH3OH is more strongly correlated to the integrated visual extinction than c−C3H2.
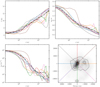 |
Fig. 5 Physical structure of the simulated core in the x − y plane. Left and top right: radial profile for the dust temperature, number density and visual extinction are shown along eight different radial cuts on the x − y plane for the simulated core. The profiles for the 1D hydrodynamical model from Keto & Caselli (2010) is indicated by the black dotted line while the dashed-dotted line shows the mean of the eight profiles in the 3D model. Lower right: the greyscale image shows the continuum image of the core at 1.1 mm, while contours indicate 15, 30, 45, 60, and 75% of the peak intensity. The dashed colored lines indicate the direction that the radial profiles on the left were extracted along. |
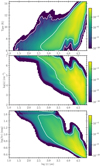 |
Fig. 6 Gaussian KDE for the cell temperature, density and visual extinction as a function of radius. White contours indicate the 50th and 75th percentiles. |
3.5 Comparing different chemical models
The exact chemical age and initial conditions for the chemistry in L1544 is uncertain and we have therefore tested a number of different initial conditions for the chemical model, as introduced in Table 2. In Fig. 10, we show the c-C3H2 and CH3OH emission in contours of red and white, respectively, for each of the models presented in Table 2. The integrated intensity of the line is also included for each molecule. The chemical morphology for these molecular emission lines show a similar morphology for models I0.0_Ml.0_standard, I0.5_M0.2_standard, I0.5_M0.5_standard, and Il.0_M0.l_standard, with methanol peaking toward the right of the core and c-C3H2 peaking close to the dust peak. Models I0.0_M1.0_κ × 0.2 and I0.0_Ml.0_CRl0 also shows a similar offset in the methanol contours, but the emission peaks on the dust peak and not offset to the right. The remaining models show a different morphology. Model I0.0_Ml.0_Gnotl00 show very faint CH3OH emission which peaks on the dust peak. Models I0.0_M0.5_standard and I0.0_Ml.0_extAv0 also show faint CH3OH emission and a brighter c-C3H2 with a larger extent. Models I0.0_M0.5_standard, I0.0_M1.0_κ × 0.2, I0.0_Ml.0_Gnotl00, and I0.0_Ml.0_extAv0 are all inconsistent with observations of L1544 due to the weak CH3 OH emission or the morphology of the emission. The stronger line strengths of c-C3H2 in models I0.0_M0.5_standard, I0.5_M0.2_standard, and I0.5_M0.5_standard is consistent with carbon-chain molecules forming earlier than CH3OH since these models are more chemically young. The behavior of models I0.0_M1.0_κ × 0.2 and I0.0_Ml.0_extAv0 are comparable as the effect of the changed opacity on the temperature structure is comparable to that of the lower visual extinction in model I0.0_Ml.0_extAv0, although the impact is strongest in I0.0_M1.0_κ × 0.2, where methanol formation is weaker. Models with very weak CH3OH emission are not consistent with observations of L1544 which shows relatively bright CH3OH emission (see also Table 4 and the section below). In Appendix E, we have included similar figures to Fig. 10 for all three planes.
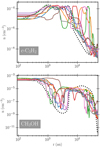 |
Fig. 7 Radial abundance profiles for c-C3 H2 (top) and CH3 OH (bottom) along the eight different profiles matching the colors shown in Fig. 5. The profiles for the 1D hydrodynamical model from Keto & Caselli (2010) is indicated by the black dotted line. |
Pearson correlation coefficients for the different column density maps.
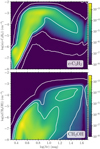 |
Fig. 8 Kernel density estimate for the chemical abundances as a function of the visual extinction. The analysis is carried out on a cell-by-cell basis in the 3D model and weighted by cell mass. Contours show the 25th, 50th, and 75th percentiles. Top panel shows c-C3H2 and the bottom panel shows CH3OH. |
3.6 Comparison of spectra for CH3 OH and c-C3 H2
Figure 11 presents a comparison between the c-C3H2 32,2−31,3 spectrum towards the dust peak of L1544 and towards the dust peak of the simulated L1544 analog for the nine different chemical models and Fig. 12 is similar for the CH3OH 21,2−11,1 transition. An overview of the modeled spectra including fitted Gaussian parameters is included in Table 4 for both transitions. We fitted Gaussian profiles to the modeled lines although some of the spectra deviate from a pure Gaussian profile due to asymmetries related to self-absorption in the infalling core. This is done because the spectral resolution of the observed spectra toward L1544 is insufficient to resolve these features.
The models show a broad range of intensities for the targeted lines, depending both on the choice of chemical age, ISRF (G0), and the cosmic-ray ionization rate. For the fiducial model, the peak brightness for c-C3H2 is about three times higher than what is observed towards L1544, while the integrated line intensity is higher by a factor of ~2.5. The width of the modeled lines are generally consistent to the observed line (0.47 km s−1 compared to 0.38–0.44 km s−1), indicating the kinematics of the modeled core is comparable to L1544 in the region traced by this c-C3H2 transition. However, the limited spectral resolution of the observed line prohibits more detailed comparison. In terms of the integrated intensities, models I0.0_M1.0_standard, I1.0_M0.1_standard, I0.0_M1.0_κ × 0.2, I0.0_M1.0_CR10, and I0.0_M1.0_extAv0 provide emission lines that agree within less than a factor of three with the observed line. For CH3OH, the fiducial model has a too low peak brightness by a factor of ~8. Models I0.0_M0.5_standard, I0.5_M0.2_standard, and I0.0_M1.0_CR10 provide the closest match to the observed peak brightness (0.33 and 1.16 K, respectively, compared to the observed 0.84 K). The methanol abundances of model I0.0_M1.0_Gnot100 are too low to provide a decent Gaussian fit. Generally, the majority of the models show weaker methanol emission than what is observed. This could be due to missing (non-thermal) desorption pathways in the shielded regions of the core.
To achieve a better match, the duration of the chemical model could be fine-tuned to fit each specific molecule, but this is beyond the scope of this work. Here, we focus on the chemical structure of the core. Finally, we note that differences in the physical structure of the modeled core and L1544 could limit the degree to which the observed spectra can be reproduced.
4 Discussion
With the development of this 3D physico-chemical model, we aim to understand the origin of the observed chemical differentiation in L1544 and other pre-stellar cores. Most notably, an offset between the dust peak and the methanol peak has been reported in several starless and pre-stellar cores (e.g., Spezzano et al. 2020; Harju et al. 2020). The observed chemical distribution could result from uneven illumination of the cores, which are not considered in the 1D models regularly used to study these cores. Uneven illumination can arise from a number of different situations. In Spezzano et al. (2020), an offset between methanol and cyclopropenylidene is reported for five out of six cores, where the sixth core showing no offset is the isolated Bok globule B68, thus uniformly illuminated. The remaining cores show an offset that is due to some form of uneven illumination of the cores. The cause of the uneven illumination varies from intrinsic variations in the density distribution to external illumination from nearby massive B-type stars. As such, uneven illumination seem to be almost ubiquitous in cores located in star-forming regions, with several different factors contributing to the effect. Indeed, Spezzano et al. (2022) studied the methanol distribution around 12 cores in the Taurus molecular cloud and found two different dichotomies related to the environment of the core. In one group, the N(CH3OH)/N(C18O) ratio peaks at the dust peak, while for the other group, the peak is offset by ~10 000 au. The first group is identified as sources located in regions with higher rates of star formation, which can influence the formation of methanol from CO in the outer layers of the core. Nearby protostars can suppress the formation of methanol through higher cosmic-ray fluxes from particles launched in outflow and jets (Padovani et al. 2016; Fitz Axen et al. 2021) or through higher rates of photodesorption, limiting CO freeze-out. Furthermore, the presence of outflows from the surrounding protostars will create a clumpier medium where the ISRF may penetrate more efficiently. The second group is located in regions with lower rates of star formation and as such these effects are diminished. In the case of L1544, the uneven illumination of the core is inferred from the sharp drop in the N(H2) column density on one side of the core (Spezzano et al. 2016). In the model presented here, we applied a uniform ISRF around the computational domain. Thus, the uneven illumination in the 3D model arises from the physical structure of the core within the computational domain (r ≤ 50 000 au), that is, at the core-cloud boundary and within the core itself. In the upper right panel in Fig. 5 a notable difference in the visual extinction is seen on scales ranging from ~1000 au to the edge of the domain at 50 000 au (e.g., from ~6 mag to 30 mag at 2000 au). Variations are also evident in the density profiles and to a lesser extent in the temperature profiles. These variations arise from the clumpy structure of the core and envelope and are the cause of the observed chemical dichotomy of the core shown in Fig. 9.
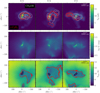 |
Fig. 9 Synthetic imaging and physical maps of the simulated core. Top: comparison between the location and spatial extent of the c-C3H2 32,2− 31,3 transition (red contours) and CH3OH 21,2−11,1 transition (white contours) emission viewed from three different directions in the simulation. Contours show 60, 70, 80, and 90% of the peak emission in the moment-zero maps for each transition. The continuum emission at 1.1 mm is shown by the color map. Middle: logarithm of the computed visual extinction in three planes of the core. A logarithmic scaling is applied to emphasize the variation across the core. A lower limit of Av = 2 mag is applied. Bottom: computed dust temperature in three planes of the core. The black and red contours indicate the 8 and 10 K temperature limits, respectively. A lower limit of 6 K is applied. |
 |
Fig. 10 Comparison between the c-C3H2 32,2−31,3 transition (red contours) and CH3OH 21,2(white contours) integrated emission for each of the nine chemical models listed in Table 2. The figure shows the x − y plane seen in the first column of Fig. 9. |
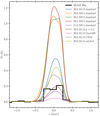 |
Fig. 11 Comparison between the c-C3H2 32,2−31,3 spectrum for each of the nine chemical models listed in Table 2 and the observed spectrum from IRAM 30 m observations (Spezzano et al. 2016). |
4.1 Comparison with the observed chemical morphology of c-C3 H2 and CH3 OH in L1544
The observed chemical morphology of c-C3H2 and CH3OH in L1544 is shown in Fig. 1. The methanol emission peaks toward the northwest of the dust peak where the column density is higher than toward the southeast. This is consistent with the methanol emission in our model, which peaks on the right side of the pre-stellar core in the x − y and x − z planes where the visual extinction is higher and the dust temperature lower, namely, the more shielded side of the core. Furthermore, this correlation is also evident from the Pearson correlation coefficients, as mentioned in Sect. 3. Meanwhile, the c-C3H2 contours in the emission map of L1544 overlaps with the continuum, but peaks toward the southern part of the core. This is also the case for our model where the contours of c-C3H2 are centered around the dust peak. Our model predicts that c-C3H2 is more abundant in the chemically younger models similar to other carbon-chain molecules (e.g., Sakai & Yamamoto 2013).
Spezzano et al. (2016) suggested that the observed offset between CH3 OH, c-C3H2 and the dust peak of L1544 was the result of an uneven irradiation of the core on different sides. The synthetic observations presented here support this explanation since the CH3OH emission peaks on the more shielded side of our L1544 analog. This is a consequence of the more efficient freeze-out of CO on this side of the core, which leads to a higher production of CH3OH through grain-surface chemistry. The desorption of methanol in the dense and cold core studied here is driven mainly by chemical desorption with insignificant contributions from cosmic-ray induced desorption and pho-todesorption. Consequently, the modeled gas-phase abundances depend sensitively on the assumed efficiency of the chemical desorption of methanol. In this work, we follow the description of Garrod et al. (2007) for all reactions, however the efficiency can vary which could impact the gas-phase abundances considerable (e.g., Minissale et al. 2016). This would however not impact the morphology of the methanol emission, which is the main focus of this work. These results confirm that the core structure and external environment has a notable impact on the methanol distribution in the core by influencing the strength of the local irradiation. Furthermore, the model predicts that the brightness of CH3OH depends strongly on the choice of chemical age and the UV irradiation. Models with lower shielding or stronger ISRF (I0.0_M1.0_κ × 0.2, I0.0_M1.0_Gnot100, and I0.0_M1.0_extAv0) show very faint CH3OH emission at the dust peak.
For c-C3H2, the location of the peak molecular emission in L1544 is closer to the high column density structure, peaking on the southern side of the core. In our model, the targeted c-C3H2 transition also peaks close to the dust peak in the x − y and x − z planes (top-left and middle figures, Fig. 9). However, the c-C3H2 emission is shifted ~8000 au from the dust peak in the z − y plane. The variation between the different planes highlights that caution is needed when interpreting observations. Combined emission maps and multi-line analysis can help to constrain the emission region (e.g., Lin et al. 2022). Comparing the synthetic observations in Fig. 9 with the column density maps in Fig. 13, it is evident that c-C3H2 is more extended than CH3OH, but the c-C3H2 32,2−31,3 transition shown in Fig. 9 predominantly traces the inner part of the core due to excitation effects (critical density >105 cm−3). When comparing the different chemical models in Fig. 10, only minimal offsets (<20″, <4000 au) between the c-C3H2 contours are present in the different chemical models, indicating that the distribution of c-C3H2 in the core does not depend strongly on the choice of chemical initial conditions and external fields.
To provide a quantitative overview, Fig. 14 shows a comparison between the molecular offsets and integrated intensities for selected models and the observed values for L1544 from Spezzano et al. (2016). Focusing on the top panel with the x − y plane, the offsets for methanol are comparable to the observed value for L1544 (circles), except for model Į0.0_M1.0_CR10. However, this is not the case in the remaining planes where a substantial scatter is visible. For c-C3H2 (crosses), the distance from the dust peak is larger in L1544 than that for most models and planes. Outliers are seen in plane z − y where the c-C3H2 emission shows a large offset of more than 50. Model I0.0_M1.0_CR10 provide the best match to the observed integrated intensities of both molecules, however it does not provide a good match for the observed chemical distribution, regardless of the imaged plane. This is also seen in Fig. 9. We note that while the present model does not reproduce the offset of the peak c-C3H2 position observed in L1544 very well, the extent of the contours show a similar trend for both models and observations, with the contours of the c-C3H2 emission centered on the dust continuum.
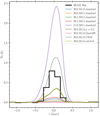 |
Fig. 12 Comparison between the CH3OH 21,2−11,1 spectrum for each of the nine chemical models listed in Table 2 and the observed spectrum from IRAM 30 m observations (Spezzano et al. 2016). |
4.2 Caveats of the model
While the present model includes several improvements over static or dynamic 1D models of L1544 and pre-stellar cores in general, a number of caveats still remain. In the present model, we do not account for the dynamical evolution of the core, namely, the gradual increase of density and decrease in temperature as the molecular cloud cools and contracts while forming the core. Following the dynamical evolution of the core when computing the chemical abundances may impact the abundance of certain species which is not fully captured in the present setup. However, if the chemical evolution is followed over time, a three-phase chemical model (i.e., separation of ice surface and ice mantle chemistry) may also be needed since two-phase models cannot record the chemical evolution in different ice layers. Such a change would further enhance the computational demands of the model. The omission of a dynamical core evolution means that we cannot predict the chemical age of the core and instead assumed several different values. Future work can address this by calculating the chemical evolution along tracer particles which trace the gas evolution during the evolution of the pre-stellar core and allow a more realistic comparison between the modeled and observed chemical abundances and morphologies (e.g., Drozdovskaya et al. 2014; Furuya et al. 2017; Jensen et al. 2021a; Ferrada-Chamorro et al. 2021).
The present model does not include thermochemistry, that is, the heating and cooling of molecular gas through absorption and emission. Furthermore, the physical evolution as computed using RAMSES assumes an isothermal gas with no feedback from the microphysics. These simplifications may impact the dynamical evolution of the model and to some extent the structure of the core. Instead, the model presented here includes the large-scale turbulence of the molecular cloud. This approach is supported by the success of the model in reproducing the star formation rate, the initial mass function, and the core mass function (Haugbølle et al. 2018; Pelkonen et al. 2021).
The present chemical model is limited to a two-phase gas-grain model as opposed to the more computationally expensive three-phase models (e.g., Hasegawa & Herbst 1993b; Vasyunin et al. 2017; Furuya et al. 2017). This choice impacts the abundances of molecules formed through grain-surface chemistry, such as methanol. In the case of our fiducial model where the chemistry was evolved for 1 Myr, the difference in abundances between the two-phase and three-phase model is low for the current network, however the differences for different chemical ages can be significantly larger. However, as this work does not aim to model the exact abundances of CH3OH and c-C3H2, the conclusions in this paper would not be impacted be a change to three-phase gas-grain model.
Another limitation of the model is the choice of a fixed cosmic-ray ionization rate throughout the core. This is a common assumption in astrochemical models (e.g., Sipilä et al. 2015; Aikawa et al. 2020). However, cosmic-rays are expected to attenuate |at higher optical depths in pre-stellar cores such as L1544 (e.g., Padovani et al. 2018; Redaelli et al. 2021). This effect could reduce the desorption of CH3OH in the central part of the core where the cosmic-ray induced desorption is a significant factor in the model. We nonetheless choose to use a constant cosmic-ray flux in this work to limit the complexity of the model and because the degree of attenuation of cosmic rays in cloud cores remains uncertain (Silsbee & Ivlev 2019).
A 3D model of L1544 was recently presented by Ge et al. (2023) to address the chemical dichotomy of L1544. The aims of that work is similar to the work presented here but the methods differ. In Ge et al. (2023), the 3D structure is inferred from the 2D density structure in the plane of the sky using the Aviator code (Hasenberger & Alves 2020). The model assumes an isothermal core and the extinction was estimated from the integrated H2 column density instead of a direct computation using radiative transfer modeling. As such the two models are complementary and show two different approaches to the 3D problem. Nonetheless, both models find that the irregular structure of the 3D cores can induce the chemical dichotomy observed in L1544.
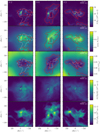 |
Fig. 13 Column density maps for N(H2), |


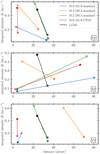 |
Fig. 14 Comparison of the molecular offsets and brightness for c-C3H2 32,2−31,3 transition (crosses) and CH3OH 21,2−11,1 (circles) for selected chemical models and L1544. The x-axis shows the distance between the dust peak and the molecular emission peak in arcseconds and the y-axis shows the integrated intensity for the molecules. |
5 Summary
This work presents a 3D MHD physico-chemical model of a pre-stellar core embedded in a realistic molecular cloud environment. The model self-consistently computes the temperature and visual extinction in the core which allows us to study the impact of the local cloud environment and core structure on the chemical morphology in the core. The model is compared with observations of the pre-stellar core L1544 in order to explain the chemical structure of L1544. The main results of the paper are as follows.
The transition from a spherically symmetric 1D model to a more realistic 3D model embedded in a molecular cloud leads to a chemical differentiation between CH3OH and c-C3H2 that can be explained by the uneven illumination within the pre-stellar core and envelope. This is consistent with the observed dichotomy in L1544 and supports the explanation provided in Spezzano et al. (2016). Uneven illumination occurs in this model as a direct consequence of the realistic environment of the molecular cloud simulation, which determines the core and envelope structure and asymmetries which provoke the chemical structure.
The observed chemical differentiation between CH3OH and c-C3H2 is present for a broad range of different initial conditions for the chemical model, when standard values for the ISRF (G0 = 1) and cosmic-ray flux (ζCR = 3 × 10⁻¹⁷ s−1) are used. However, spectral comparison between the modeled core and L1544 demonstrates that the model presented here needs fine-tuning to better reproduce the brightness and line profile of both molecules.
The observed brightness and dichotomy of CH3OH and c-C3H2 emission in L1544 cannot be reproduced by models with an enhanced ISRF of G0 = 100 or an increased cosmic-ray ionization rate of 3×10⁻¹⁶ s−1.
Comparison between the 1D and 3D models shows that the inner core structure (r < 1000 au) shows a similar structure and temperature profile. On larger scales the 3D model shows considerable scatter between radial profiles. We show in this work that these non-spherical features lead to the chemical dichotomy of the core as observed in L1544 and other cores (Sipilä et al. 2016; Spezzano et al. 2020). It is therefore necessary to consider non-spherical features when interpreting molecular emission maps. Nonetheless, the mean profile averaged over different directions remains close to the 1D model.
This work demonstrates how the local cloud structure can directly impact the chemical structure of pre-stellar cores and highlights the importance of realistic 3D models when studying the core-envelope transition of young cores. This conclusion is further supported by the observations of CH3OH and c-C3H2 presented in Spezzano et al. (2016) and Spezzano et al. (2020). Through chemical inheritance, the imprinted chemical segregation can impact the system at later stages of the star- and planet-formation process, particularly at the onset of planet formation. Future work will extent this study to include the dynamics of the gas and broaden the molecular tracers studied. With this model, we can also study the accretion process onto the core and analyze the formation and evolution of streamers which may play an important role in the physical and chemical evolution of protostellar envelopes and protoplanetary disks (e.g., Pineda et al. 2020; Valdivia-Mena et al. 2022; Gupta et al. 2023; Kuffmeier et al. 2023).
Appendix A Comparing interpolation and direct chemical modeling on 1D model of L1544
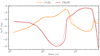 |
Fig. A.1 Comparison between the radial chemical profiles when computing the chemical abundances directly on the 1D model grid (solid lines) and when using the interpolation module (dotted lines) for CH3 OH and c-C3H2. |
Appendix B Surface reactions with custom barriers
Reactions with custom barrier widths. Note that deuterated variants of the reactions have been excluded from the list, but share the same barrier widths.
Appendix C Radial profiles for the core
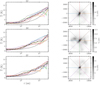 |
Fig. C.1 Thermal structure of the simulated core. Left: Radial profiles for the dust temperature along 8 different radial cuts on the x-y, z-x, and z-y planes. The profiles for the 1D hydrodynamical model from Keto & Caselli (2010) is indicated by the black dotted line. Right: Greyscale images shows the continuum emission of the core at 1.1 mm, while contours indicate 15%, 30%, 45%, 60%, and 75 % of the peak intensity. The dotted colored lines indicate the direction along which the radial profiles in the other panel were extracted. |
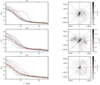 |
Fig. C.2 Visual extinction within the simulated core. Left: Radial profile for the visual extinction along 8 different radial cuts on the x-y, z-x, and z-y planes. The profiles for the 1D hydrodynamical model from Keto & Caselli (2010) is indicated by the black dotted line. Right: Greyscale images shows the continuum image of the core at 1.1 mm, while contours indicate 15%, 30%, 45%, 60%, and 75 % of the peak intensity. The dashed colored lines indicate the direction along which the radial profiles in the left panel were extracted. |
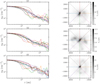 |
Fig. C.3 Density structure of the simulated core. Left: Radial profile for the number density along 8 different radial cuts on the x-y, z-x, and z-y planes. The profiles for the 1D hydrodynamical model from Keto & Caselli (2010) is indicated by the black dotted line. Right: Greyscale images shows the continuum image of the core at 1.1 mm, while contours indicate 15%, 30%, 45%, 60%, and 75 % of the peak intensity. The dashed colored lines indicate the direction along which the radial profiles in the left panel were extracted. |
Appendix D Kernel density estimates
Figures D.1 and D.2 show the Gaussian KDE for c-C3H2 and CH3OH as a function of density and radius. Figure D.3 shows the Gaussian KDE as a function of temperature.
 |
Fig. D.1 Gaussian KDE for the absolute chemical abundances as a function of number density for each cell in the 3D model. Contours show the 25th, 50th, and 75th percentiles. Top panel shows c-C3H2 and bottom panel shows CH3OH. |
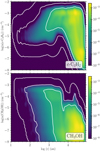 |
Fig. D.2 Gaussian KDE for the absolute chemical abundances as a function of radius for each cell in the 3D model. Contours show the 25th, 50th, and 75th percentiles. Top panel shows c-C3H2 and bottom panel shows CH3OH. |
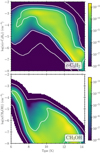 |
Fig. D.3 Gaussian KDE for the absolute chemical abundances as a function of temperature for each cell in the 3D model. Contours show the 25th, 50th, and 75th percentiles. Top panel shows c-C3H2 and bottom panel shows CH3OH. For CH3OH, the 25th percentile is not visible is it is below the limit of the colorbar. |
Appendix E Model comparison for plane z-x and z-y
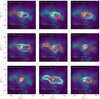 |
Fig. E.1 Comparison between the c-C3H2 32,2−31,3 transition (red contours) and CH3OH 21,2−11,1 (white contours) integrated emission for each of the nine chemical models listed in Table 2. The layout of the figure is similar to that of Fig. 10 but for the z-x plane in the model. |
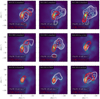 |
Fig. E.2 Comparison between the c-C3H2 32,2−31,3 transition (red contours) and CH3OH 21,2−11,1 (white contours) integrated emission for each of the nine chemical models listed in Table 2. The layout of the figure is similar to that of Fig. 10 but for the z-y plane in the model. |
References
- Aikawa, Y., Wakelam, V., Hersant, F., Garrod, R. T., & Herbst, E. 2012, ApJ, 760, 40 [NASA ADS] [CrossRef] [Google Scholar]
- Aikawa, Y., Furuya, K., Yamamoto, S., & Sakai, N. 2020, ApJ, 897, 110 [Google Scholar]
- Alves, J. F., Lada, C. J., & Lada, E. A. 2001, Nature, 409, 159 [NASA ADS] [CrossRef] [Google Scholar]
- Barber, C. B., Dobkin, D. P., & Huhdanpaa, H. 1996, ACM Trans. Math. Softw., 22, 469 [CrossRef] [Google Scholar]
- Bergin, E. A., & Tafalla, M. 2007, ARA&A, 45, 339 [Google Scholar]
- Bouvier, M., Ceccarelli, C., López-Sepulcre, A., et al. 2022, ApJ, 929, 10 [NASA ADS] [CrossRef] [Google Scholar]
- Brinch, C., & Hogerheijde, M. R. 2010, A&A, 523, A25 [NASA ADS] [CrossRef] [EDP Sciences] [Google Scholar]
- Caselli, P., & Ceccarelli, C. 2012, A&A Rev., 20, 56 [NASA ADS] [CrossRef] [Google Scholar]
- Caselli, P., Walmsley, C. M., Tafalla, M., Dore, L., & Myers, P. C. 1999, ApJ, 523, L165 [Google Scholar]
- Caselli, P., Keto, E., Bergin, E. A., et al. 2012, ApJ, 759, L37 [Google Scholar]
- Caselli, P., Pineda, J. E., Zhao, B., et al. 2019, ApJ, 874, 89 [NASA ADS] [CrossRef] [Google Scholar]
- Caselli, P., Pineda, J. E., Sipilä, O., et al. 2022, ApJ, 929, 13 [NASA ADS] [CrossRef] [Google Scholar]
- Ceccarelli, C., Caselli, P., Bockelée-Morvan, D., et al. 2014, in Protostars and Planets VI, eds. H. Beuther, R. S. Klessen, C. P. Dullemond, & T. Henning (Tucson: University of Arizona Press), 859 [Google Scholar]
- Chacón-Tanarro, A., Caselli, P., Bizzocchi, L., et al. 2017, A&A, 606, A142 [NASA ADS] [CrossRef] [EDP Sciences] [Google Scholar]
- Chacón-Tanarro, A., Pineda, J. E., Caselli, P., et al. 2019, A&A, 623, A118 [NASA ADS] [CrossRef] [EDP Sciences] [Google Scholar]
- Chang, Q., Cuppen, H. M., & Herbst, E. 2007, A&A, 469, 973 [NASA ADS] [CrossRef] [EDP Sciences] [Google Scholar]
- Ciolek, G. E., & Basu, S. 2000, ApJ, 529, 925 [Google Scholar]
- Cleeves, L. I., Bergin, E. A., Alexander, C. M. O. D., et al. 2014, Science, 345, 1590 [NASA ADS] [CrossRef] [Google Scholar]
- Crapsi, A., Caselli, P., Walmsley, M. C., & Tafalla, M. 2007, A&A, 470, 221 [NASA ADS] [CrossRef] [EDP Sciences] [Google Scholar]
- Draine, B. T. 1978, ApJS, 36, 595 [Google Scholar]
- Drozdovskaya, M. N., Walsh, C., Visser, R., Harsono, D., & van Dishoeck, E. F. 2014, MNRAS, 445, 913 [NASA ADS] [CrossRef] [Google Scholar]
- Drozdovskaya, M. N., van Dishoeck, E. F., Rubin, M., Jørgensen, J. K., & Altwegg, K. 2019, MNRAS, 490, 50 [Google Scholar]
- Dullemond, C. P., Juhasz, A., Pohl, A., et al. 2012, Astrophysics Source Code Library [record ascl:1202.015] [Google Scholar]
- Evans, I., Neal J., Rawlings, J. M. C., Shirley, Y. L., & Mundy, L. G. 2001, ApJ, 557, 193 [NASA ADS] [CrossRef] [Google Scholar]
- Fayolle, E. C., Bertin, M., Romanzin, C., et al. 2011, ApJ, 739, L36 [Google Scholar]
- Fayolle, E. C., Bertin, M., Romanzin, C., et al. 2013, A&A, 556, A122 [NASA ADS] [CrossRef] [EDP Sciences] [Google Scholar]
- Ferrada-Chamorro, S., Lupi, A., & Bovino, S. 2021, MNRAS, 505, 3442 [NASA ADS] [CrossRef] [Google Scholar]
- Fitz Axen, M., Offner, S. S. S., Gaches, B. A. L., et al. 2021, ApJ, 915, 43 [NASA ADS] [CrossRef] [Google Scholar]
- Fuchs, G. W., Cuppen, H. M., Ioppolo, S., et al. 2009, A&A, 505, 629 [NASA ADS] [CrossRef] [EDP Sciences] [Google Scholar]
- Furuya, K., Aikawa, Y., Hincelin, U., et al. 2015, A&A, 584, A124 [NASA ADS] [CrossRef] [EDP Sciences] [Google Scholar]
- Furuya, K., van Dishoeck, E. F., & Aikawa, Y. 2016, A&A, 586, A127 [NASA ADS] [CrossRef] [EDP Sciences] [Google Scholar]
- Furuya, K., Drozdovskaya, M. N., Visser, R., et al. 2017, A&A, 599, A40 [NASA ADS] [CrossRef] [EDP Sciences] [Google Scholar]
- Galli, P. A. B., Loinard, L., Ortiz-Léon, G. N., et al. 2018, ApJ, 859, 33 [Google Scholar]
- Garrod, R. T. 2013, ApJ, 765, 60 [Google Scholar]
- Garrod, R. T., & Pauly, T. 2011, ApJ, 735, 15 [Google Scholar]
- Garrod, R. T., Wakelam, V., & Herbst, E. 2007, A&A, 467, 1103 [NASA ADS] [CrossRef] [EDP Sciences] [Google Scholar]
- Ge, J., Mardones, D., Inostroza-Pino, N., & Peng, Y. 2023, MNRAS, 521, 2833 [NASA ADS] [CrossRef] [Google Scholar]
- Giers, K., Spezzano, S., Alves, F., et al. 2022, A&A, 664, A119 [NASA ADS] [CrossRef] [EDP Sciences] [Google Scholar]
- Goldsmith, P. F. 2001, ApJ, 557, 736 [Google Scholar]
- Gupta, A., Miotello, A., Manara, C. F., et al. 2023, A&A, 670, L8 [NASA ADS] [CrossRef] [EDP Sciences] [Google Scholar]
- Harju, J., Pineda, J. E., Vasyunin, A. I., et al. 2020, ApJ, 895, 101 [NASA ADS] [CrossRef] [Google Scholar]
- Hasegawa, T. I., & Herbst, E. 1993a, MNRAS, 261, 83 [NASA ADS] [CrossRef] [Google Scholar]
- Hasegawa, T. I., & Herbst, E. 1993b, MNRAS, 263, 589 [Google Scholar]
- Hasegawa, T. I., Herbst, E., & Leung, C. M. 1992, ApJS, 82, 167 [Google Scholar]
- Hasenberger, B., & Alves, J. 2020, A&A, 633, A132 [NASA ADS] [CrossRef] [EDP Sciences] [Google Scholar]
- Haugbølle, T., Padoan, P., & Nordlund, Å. 2018, ApJ, 854, 35 [CrossRef] [Google Scholar]
- Heays, A. N., Bosman, A. D., & van Dishoeck, E. F. 2017, A&A, 602, A105 [NASA ADS] [CrossRef] [EDP Sciences] [Google Scholar]
- Hidaka, H., Watanabe, M., Kouchi, A., & Watanabe, N. 2009, ApJ, 702, 291 [NASA ADS] [CrossRef] [Google Scholar]
- Higuchi, A. E., Sakai, N., Watanabe, Y., et al. 2018, ApJS, 236, 52 [Google Scholar]
- Hocuk, S., SzUcs, L., Caselli, P., et al. 2017, A&A, 604, A58 [NASA ADS] [CrossRef] [EDP Sciences] [Google Scholar]
- Jensen, S. S., Jørgensen, J. K., Kristensen, L. E., et al. 2019, A&A, 631, A25 [NASA ADS] [CrossRef] [EDP Sciences] [Google Scholar]
- Jensen, S. S., Jørgensen, J. K., Furuya, K., Haugbølle, T., & Aikawa, Y. 2021a, A&A, 649, A66 [NASA ADS] [CrossRef] [EDP Sciences] [Google Scholar]
- Jensen, S. S., Jørgensen, J. K., Kristensen, L. E., et al. 2021b, A&A, 650, A172 [EDP Sciences] [Google Scholar]
- Jørgensen, J. K., Schöier, F. L., & van Dishoeck, E. F. 2002, A&A, 389, 908 [CrossRef] [EDP Sciences] [Google Scholar]
- Keto, E., & Caselli, P. 2010, MNRAS, 402, 1625 [Google Scholar]
- Keto, E., Caselli, P., & Rawlings, J. 2015, MNRAS, 446, 3731 [NASA ADS] [CrossRef] [Google Scholar]
- Kuffmeier, M., Jensen, S. S., & Haugbølle, T. 2023, Eur. Phys. J. Plus, 138, 272 [NASA ADS] [CrossRef] [Google Scholar]
- Kuruwita, R. L., & Haugbølle, T. 2023, A&A, 674, A196 [NASA ADS] [CrossRef] [EDP Sciences] [Google Scholar]
- Leger, A., Jura, M., & Omont, A. 1985, A&A, 144, 147 [Google Scholar]
- Lin, Y., Spezzano, S., Sipilä, O., Vasyunin, A., & Caselli, P. 2022, A&A, 665, A131 [NASA ADS] [CrossRef] [EDP Sciences] [Google Scholar]
- Majumdar, L., Gratier, P., Ruaud, M., et al. 2017, MNRAS, 466, 4470 [Google Scholar]
- Minissale, M., Dulieu, F., Cazaux, S., & Hocuk, S. 2016, A&A, 585, A24 [NASA ADS] [CrossRef] [EDP Sciences] [Google Scholar]
- Oberg, K. I., Fuchs, G. W., & van Dishoeck, E. F. 2007, in Molecules in Space and Laboratory, eds. J. L. Lemaire & F. Combes, 80 [Google Scholar]
- Öberg, K. I., van Dishoeck, E. F., & Linnartz, H. 2009, A&A, 496, 281 [NASA ADS] [CrossRef] [EDP Sciences] [Google Scholar]
- Ossenkopf, V., & Henning, T. 1994, A&A, 291, 943 [NASA ADS] [Google Scholar]
- Padovani, M., Marcowith, A., Hennebelle, P., & Ferrière, K. 2016, A&A, 590, A8 [NASA ADS] [CrossRef] [EDP Sciences] [Google Scholar]
- Padovani, M., Galli, D., Ivlev, A. V., Caselli, P., & Ferrara, A. 2018, A&A, 619, A144 [NASA ADS] [CrossRef] [EDP Sciences] [Google Scholar]
- Pelkonen, V. M., Padoan, P., Haugbølle, T., & Nordlund, Å. 2021, MNRAS, 504, 1219 [NASA ADS] [CrossRef] [Google Scholar]
- Pineda, J. E., Segura-Cox, D., Caselli, P., et al. 2020, Nat. Astron., 4, 1158 [NASA ADS] [CrossRef] [Google Scholar]
- Redaelli, E., Bizzocchi, L., Caselli, P., et al. 2019, A&A, 629, A15 [NASA ADS] [CrossRef] [EDP Sciences] [Google Scholar]
- Redaelli, E., Sipilä, O., Padovani, M., et al. 2021, A&A, 656, A109 [NASA ADS] [CrossRef] [EDP Sciences] [Google Scholar]
- Rybicki, G. B., & Hummer, D. G. 1991, A&A, 245, 171 [NASA ADS] [Google Scholar]
- Sakai, N., & Yamamoto, S. 2013, Chem. Rev., 113, 8981 [Google Scholar]
- Schöier, F. L., van der Tak, F. F. S., van Dishoeck, E. F., & Black, J. H. 2005, A&A, 432, 369 [Google Scholar]
- Semenov, D., Hersant, F., Wakelam, V., et al. 2010, A&A, 522, A42 [NASA ADS] [CrossRef] [EDP Sciences] [Google Scholar]
- Shirley, Y. L., Evans, I., Neal J., Rawlings, J. M. C., & Gregersen, E. M. 2000, ApJS, 131, 249 [NASA ADS] [CrossRef] [Google Scholar]
- Silsbee, K., & Ivlev, A. V. 2019, ApJ, 879, 14 [NASA ADS] [CrossRef] [Google Scholar]
- Sipilä, O., Caselli, P., & Harju, J. 2015, A&A, 578, A55 [Google Scholar]
- Sipilä, O., Spezzano, S., & Caselli, P. 2016, A&A, 591, L1 [NASA ADS] [CrossRef] [EDP Sciences] [Google Scholar]
- Sipilä, O., Harju, J., & Caselli, P. 2017, A&A, 607, A26 [NASA ADS] [CrossRef] [EDP Sciences] [Google Scholar]
- Sipilä, O., Silsbee, K., & Caselli, P. 2021, ApJ, 922, 126 [CrossRef] [Google Scholar]
- Spezzano, S., Bizzocchi, L., Caselli, P., Harju, J., & Brünken, S. 2016, A&A, 592, L11 [NASA ADS] [CrossRef] [EDP Sciences] [Google Scholar]
- Spezzano, S., Caselli, P., Bizzocchi, L., Giuliano, B. M., & Lattanzi, V. 2017, A&A, 606, A82 [NASA ADS] [CrossRef] [EDP Sciences] [Google Scholar]
- Spezzano, S., Caselli, P., Pineda, J. E., et al. 2020, A&A, 643, A60 [NASA ADS] [CrossRef] [EDP Sciences] [Google Scholar]
- Spezzano, S., Fuente, A., Caselli, P., et al. 2022, A&A, 657, A10 [NASA ADS] [CrossRef] [EDP Sciences] [Google Scholar]
- Tafalla, M., Mardones, D., Myers, P. C., et al. 1998, ApJ, 504, 900 [NASA ADS] [CrossRef] [Google Scholar]
- Tafalla, M., Myers, P. C., Caselli, P., Walmsley, C. M., & Comito, C. 2002, ApJ, 569, 815 [Google Scholar]
- Taquet, V., Charnley, S. B., & Sipilä, O. 2014, ApJ, 791, 1 [NASA ADS] [CrossRef] [Google Scholar]
- Teyssier, R. 2002, A&A, 385, 337 [CrossRef] [EDP Sciences] [Google Scholar]
- Thaddeus, P., Vrtilek, J. M., & Gottlieb, C. A. 1985, ApJ, 299, L63 [NASA ADS] [CrossRef] [Google Scholar]
- Valdivia-Mena, M. T., Pineda, J. E., Segura-Cox, D. M., et al. 2022, A&A, 667, A12 [NASA ADS] [CrossRef] [EDP Sciences] [Google Scholar]
- van der Tak, F. F. S., van Dishoeck, E. F., Evans, I., Neal J., Bakker, E. J., & Blake, G. A. 1999, ApJ, 522, 991 [NASA ADS] [CrossRef] [Google Scholar]
- van Dishoeck, E. F., Bergin, E. A., Lis, D. C., & Lunine, J. I. 2014, in Protostars and Planets VI, eds. H. Beuther, R. S. Klessen, C. P. Dullemond, & T. Henning (Tucson: University of Arizona Press), 835 [Google Scholar]
- Vasyunin, A. I., Caselli, P., Dulieu, F., & Jiménez-Serra, I. 2017, ApJ, 842, 33 [Google Scholar]
- Virtanen, P., Gommers, R., Oliphant, T. E., et al. 2020, Nat. Methods, 17, 261 [Google Scholar]
- Wakelam, V., Loison, J. C., Herbst, E., et al. 2015, ApJS, 217, 20 [NASA ADS] [CrossRef] [Google Scholar]
- Watanabe, N., & Kouchi, A. 2002, ApJ, 571, L173 [Google Scholar]
- Yang, Y.-L., Sakai, N., Zhang, Y., et al. 2021, ApJ, 910, 20 [Google Scholar]
- Zhao, B., Caselli, P., Li, Z.-Y., et al. 2021, MNRAS, 505, 5142 [NASA ADS] [CrossRef] [Google Scholar]
- Zucconi, A., Walmsley, C. M., & Galli, D. 2001, A&A, 376, 650 [NASA ADS] [CrossRef] [EDP Sciences] [Google Scholar]
All Tables
Initial abundances following Semenov et al. (2010), except for the inclusion of ortho and para spin-states of H2.
Reactions with custom barrier widths. Note that deuterated variants of the reactions have been excluded from the list, but share the same barrier widths.
All Figures
|
Fig. 1 Observations of c-C3H2 and CH3OH toward L1544 with the IRAM 30m telescope. The red contours show the integrated emission of c-C3H2 32,2−31,3 and the crosshair indicates the peak of the emission map. White contours and crosshair show the same for CH3OH 21,2−11,1. For both molecules, the contours indicate 50, 70, and 90% of the peak emission. The black dotted square indicates the region mapped with the 30 m. The colormap shows the H2 column density map derived from Herschel/SPIRE observations. Both the column density and molecular emission maps are drawn from Spezzano et al. (2016). |
| In the text | |
|
Fig. 2 Projected H2 column densities in the molecular cloud simulation. A total of 233 protostars, denoted with white crosses have formed in this snapshot from the simulation (t = 1.66 Myr). Most protostars form in clusters along filaments. The red diamond marks the protostar that is studied here during the pre-stellar phase. We centered the pre-stellar core in the figure for clarity, since the box has periodic boundary conditions. |
| In the text | |
|
Fig. 3 Comparison of the continuum at 1.1 mm as modeled using RADMC-3D and as observed using the AzTEC continuum camera at the LMT (presented in Chacón-Tanarro et al. 2019). Contours indicate 40, 60, and 80% of the peak intensity in each case. The beam-size of the AzTEC bolometer is 12.6″ and the synthetic observation has been convolved with a Gaussian of the same size. The linear scale is shown in the lower left of each panel, assuming a distance of 170 pc to L1544 and the model core. The beam size is shown in black in the lower left corner. |
| In the text | |
|
Fig. 4 Comparison between the spectral energy distribution of the modeled core and L1544. The observed values for L1544 are indicated with black crosses and are taken from the work by Chacón-Tanarro et al. (2017). The blue line shows the SED for the core model computed using the standard OH94 dust opacities, while the orange line shows the SED when the dust opacities have been multiplied by a factor of 0.2 to match the continuum emission at 1.1 mm. |
| In the text | |
|
Fig. 5 Physical structure of the simulated core in the x − y plane. Left and top right: radial profile for the dust temperature, number density and visual extinction are shown along eight different radial cuts on the x − y plane for the simulated core. The profiles for the 1D hydrodynamical model from Keto & Caselli (2010) is indicated by the black dotted line while the dashed-dotted line shows the mean of the eight profiles in the 3D model. Lower right: the greyscale image shows the continuum image of the core at 1.1 mm, while contours indicate 15, 30, 45, 60, and 75% of the peak intensity. The dashed colored lines indicate the direction that the radial profiles on the left were extracted along. |
| In the text | |
|
Fig. 6 Gaussian KDE for the cell temperature, density and visual extinction as a function of radius. White contours indicate the 50th and 75th percentiles. |
| In the text | |
|
Fig. 7 Radial abundance profiles for c-C3 H2 (top) and CH3 OH (bottom) along the eight different profiles matching the colors shown in Fig. 5. The profiles for the 1D hydrodynamical model from Keto & Caselli (2010) is indicated by the black dotted line. |
| In the text | |
|
Fig. 8 Kernel density estimate for the chemical abundances as a function of the visual extinction. The analysis is carried out on a cell-by-cell basis in the 3D model and weighted by cell mass. Contours show the 25th, 50th, and 75th percentiles. Top panel shows c-C3H2 and the bottom panel shows CH3OH. |
| In the text | |
|
Fig. 9 Synthetic imaging and physical maps of the simulated core. Top: comparison between the location and spatial extent of the c-C3H2 32,2− 31,3 transition (red contours) and CH3OH 21,2−11,1 transition (white contours) emission viewed from three different directions in the simulation. Contours show 60, 70, 80, and 90% of the peak emission in the moment-zero maps for each transition. The continuum emission at 1.1 mm is shown by the color map. Middle: logarithm of the computed visual extinction in three planes of the core. A logarithmic scaling is applied to emphasize the variation across the core. A lower limit of Av = 2 mag is applied. Bottom: computed dust temperature in three planes of the core. The black and red contours indicate the 8 and 10 K temperature limits, respectively. A lower limit of 6 K is applied. |
| In the text | |
|
Fig. 10 Comparison between the c-C3H2 32,2−31,3 transition (red contours) and CH3OH 21,2(white contours) integrated emission for each of the nine chemical models listed in Table 2. The figure shows the x − y plane seen in the first column of Fig. 9. |
| In the text | |
|
Fig. 11 Comparison between the c-C3H2 32,2−31,3 spectrum for each of the nine chemical models listed in Table 2 and the observed spectrum from IRAM 30 m observations (Spezzano et al. 2016). |
| In the text | |
|
Fig. 12 Comparison between the CH3OH 21,2−11,1 spectrum for each of the nine chemical models listed in Table 2 and the observed spectrum from IRAM 30 m observations (Spezzano et al. 2016). |
| In the text | |
|
Fig. 13 Column density maps for N(H2), |
| In the text | |
|
Fig. 14 Comparison of the molecular offsets and brightness for c-C3H2 32,2−31,3 transition (crosses) and CH3OH 21,2−11,1 (circles) for selected chemical models and L1544. The x-axis shows the distance between the dust peak and the molecular emission peak in arcseconds and the y-axis shows the integrated intensity for the molecules. |
| In the text | |
|
Fig. A.1 Comparison between the radial chemical profiles when computing the chemical abundances directly on the 1D model grid (solid lines) and when using the interpolation module (dotted lines) for CH3 OH and c-C3H2. |
| In the text | |
|
Fig. C.1 Thermal structure of the simulated core. Left: Radial profiles for the dust temperature along 8 different radial cuts on the x-y, z-x, and z-y planes. The profiles for the 1D hydrodynamical model from Keto & Caselli (2010) is indicated by the black dotted line. Right: Greyscale images shows the continuum emission of the core at 1.1 mm, while contours indicate 15%, 30%, 45%, 60%, and 75 % of the peak intensity. The dotted colored lines indicate the direction along which the radial profiles in the other panel were extracted. |
| In the text | |
|
Fig. C.2 Visual extinction within the simulated core. Left: Radial profile for the visual extinction along 8 different radial cuts on the x-y, z-x, and z-y planes. The profiles for the 1D hydrodynamical model from Keto & Caselli (2010) is indicated by the black dotted line. Right: Greyscale images shows the continuum image of the core at 1.1 mm, while contours indicate 15%, 30%, 45%, 60%, and 75 % of the peak intensity. The dashed colored lines indicate the direction along which the radial profiles in the left panel were extracted. |
| In the text | |
|
Fig. C.3 Density structure of the simulated core. Left: Radial profile for the number density along 8 different radial cuts on the x-y, z-x, and z-y planes. The profiles for the 1D hydrodynamical model from Keto & Caselli (2010) is indicated by the black dotted line. Right: Greyscale images shows the continuum image of the core at 1.1 mm, while contours indicate 15%, 30%, 45%, 60%, and 75 % of the peak intensity. The dashed colored lines indicate the direction along which the radial profiles in the left panel were extracted. |
| In the text | |
|
Fig. D.1 Gaussian KDE for the absolute chemical abundances as a function of number density for each cell in the 3D model. Contours show the 25th, 50th, and 75th percentiles. Top panel shows c-C3H2 and bottom panel shows CH3OH. |
| In the text | |
|
Fig. D.2 Gaussian KDE for the absolute chemical abundances as a function of radius for each cell in the 3D model. Contours show the 25th, 50th, and 75th percentiles. Top panel shows c-C3H2 and bottom panel shows CH3OH. |
| In the text | |
|
Fig. D.3 Gaussian KDE for the absolute chemical abundances as a function of temperature for each cell in the 3D model. Contours show the 25th, 50th, and 75th percentiles. Top panel shows c-C3H2 and bottom panel shows CH3OH. For CH3OH, the 25th percentile is not visible is it is below the limit of the colorbar. |
| In the text | |
|
Fig. E.1 Comparison between the c-C3H2 32,2−31,3 transition (red contours) and CH3OH 21,2−11,1 (white contours) integrated emission for each of the nine chemical models listed in Table 2. The layout of the figure is similar to that of Fig. 10 but for the z-x plane in the model. |
| In the text | |
|
Fig. E.2 Comparison between the c-C3H2 32,2−31,3 transition (red contours) and CH3OH 21,2−11,1 (white contours) integrated emission for each of the nine chemical models listed in Table 2. The layout of the figure is similar to that of Fig. 10 but for the z-y plane in the model. |
| In the text | |
Current usage metrics show cumulative count of Article Views (full-text article views including HTML views, PDF and ePub downloads, according to the available data) and Abstracts Views on Vision4Press platform.
Data correspond to usage on the plateform after 2015. The current usage metrics is available 48-96 hours after online publication and is updated daily on week days.
Initial download of the metrics may take a while.