Fig. 1
Download original image
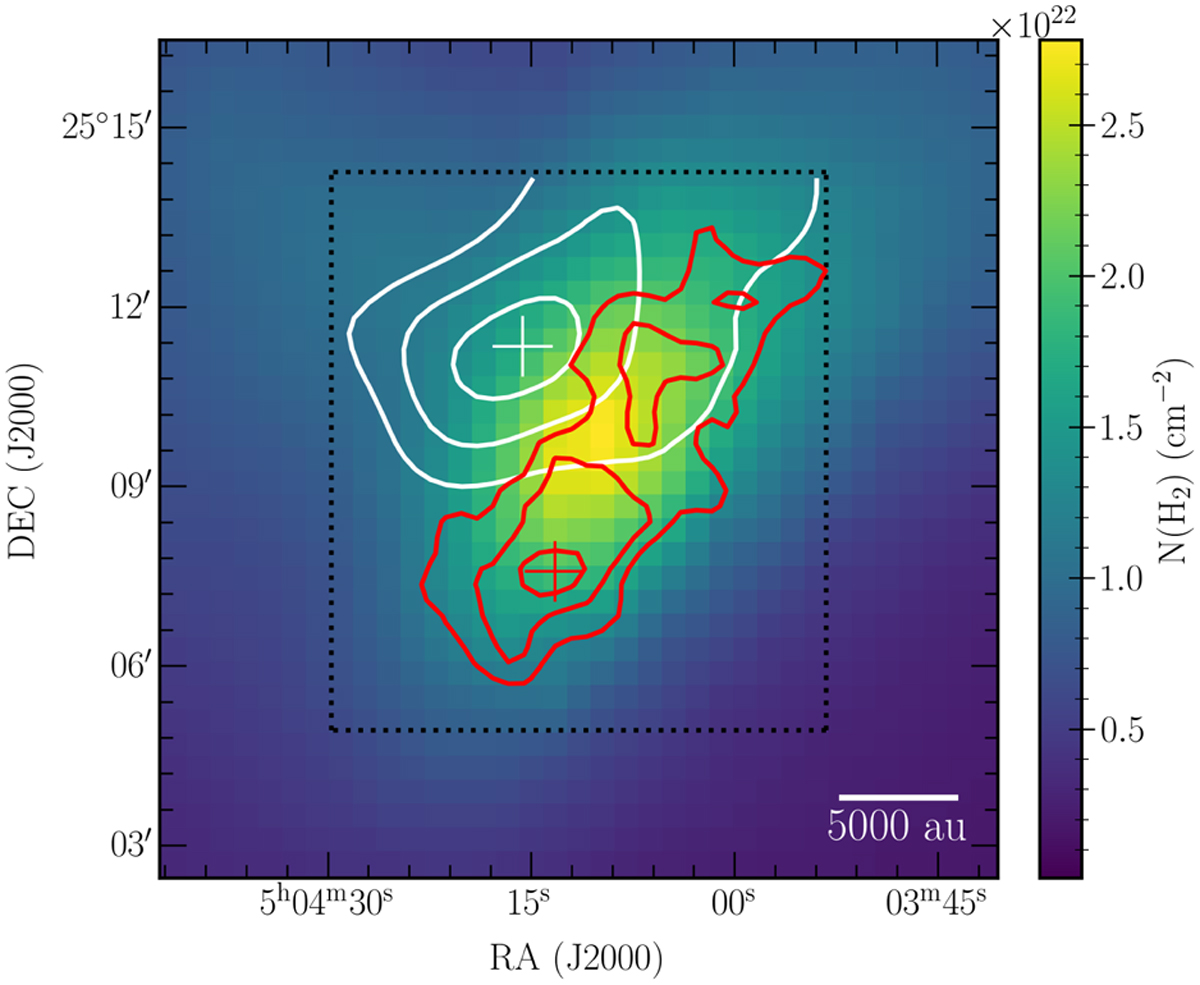
Observations of c-C3H2 and CH3OH toward L1544 with the IRAM 30m telescope. The red contours show the integrated emission of c-C3H2 32,2−31,3 and the crosshair indicates the peak of the emission map. White contours and crosshair show the same for CH3OH 21,2−11,1. For both molecules, the contours indicate 50, 70, and 90% of the peak emission. The black dotted square indicates the region mapped with the 30 m. The colormap shows the H2 column density map derived from Herschel/SPIRE observations. Both the column density and molecular emission maps are drawn from Spezzano et al. (2016).
Current usage metrics show cumulative count of Article Views (full-text article views including HTML views, PDF and ePub downloads, according to the available data) and Abstracts Views on Vision4Press platform.
Data correspond to usage on the plateform after 2015. The current usage metrics is available 48-96 hours after online publication and is updated daily on week days.
Initial download of the metrics may take a while.