| Issue |
A&A
Volume 661, May 2022
|
|
|---|---|---|
| Article Number | A111 | |
| Number of page(s) | 9 | |
| Section | Interstellar and circumstellar matter | |
| DOI | https://doi.org/10.1051/0004-6361/202243073 | |
| Published online | 24 May 2022 | |
H2CS deuteration maps towards the pre-stellar core L1544⋆
1
Max-Planck-Institut für Extraterrestrische Physik,
Giessenbachstrasse 1,
85748
Garching,
Germany
e-mail: spezzano@mpe.mpg.de
2
University of Bologna, Dipartimento di Chimica “Giacomo Ciamician”,
Bologna,
Italy
3
Observatorio Astronómico Nacional (OAN),
Alfonso XII, 3,
28014
Madrid,
Spain
Received:
10
January
2022
Accepted:
6
March
2022
Context. Deuteration is a crucial tool for understanding the complexity of interstellar chemical processes, especially when they involve the interplay of gas-phase and grain-surface chemistry. In the case of multiple deuteration, comparing observation with the results of chemical modelling is particularly effective to study how molecules are inherited in the different stages within the process of star and planet formation.
Aims. We aim to study the D/H ratio in H2CS across the prototypical pre-stellar core L1544. This study allows us to test current gas–dust chemical models involving sulfur in dense cores.
Methods. Here, we present single-dish observations of H2CS, HDCS and D2CS with the IRAM 30 m telescope. We analysed their column densities and distributions and compared these observations with gas–grain chemical models. The deuteration maps of H2CS in L1544 were compared with the deuteration maps of methanol, H2CO, N2H+, and HCO+ towards the same source. Furthermore, we compared the single and double deuteration of H2CS towards the dust peak of L1544 with H2CO and c-C3H2. The difference between the deuteration of these molecules in L1544 is discussed and compared with the prediction of chemical models.
Results. The maximum deuterium fractionation for the first deuteration of H2CS is N(HDCS)/N(H2CS) ~ 30% and is located towards the north-east at a distance of about 10000 AU from the dust peak. While for c-C3H2 the first and second deuteration have a similar efficiency, for H2CS and H2CO the second deuteration is more efficient, leading to D2CX/HDCX ~ 100% (with X = O or S).
Conclusions. Our results imply that the large deuteration of H2CO and H2CS observed in protostellar cores as well as in comets is likely inherited from the pre-stellar phase. However, comparison with state-of-the-art chemical models suggests that the reaction network for the formation of the doubly deuterated H2CS and H2CO it is not complete yet.
Key words: ISM: clouds / ISM: molecules
© S. Spezzano et al. 2022
 Open Access article, published by EDP Sciences, under the terms of the Creative Commons Attribution License (https://creativecommons.org/licenses/by/4.0), which permits unrestricted use, distribution, and reproduction in any medium, provided the original work is properly cited.
Open Access funding provided by Max Planck Society.
1 Introduction
A considerable enhancement in molecular deuteration is observed towards the early stages of star formation. Despite the cosmic deuterium abundance relative to hydrogen being ~1.5 × 10⁻⁵ (Linsky 2003), the abundances of deuterated molecules relative to the correspondent main species range from ~20% for N2H+ towards pre-stellar cores to 10% for methanol and formaldehyde in protostellar cores (Parise et al. 2006). These enhancements are a consequence of the exothermic reaction,
 (1)
(1)
and successive deuterations up to the formation of  (see Ceccarelli et al. 2014 and references therein). The deuterated isotopologues of
  can also dissociatively recombine with electrons, enhancing the atomic D/H ratio in the gas phase (Roberts et al. 2003). While H2D+, and the multiply deuterated isotopologues of
  , are deuterating molecules in the gas phase, the enhanced atomic D/H ratio is transferred to grains, where it deuterates the molecules on the surface. Isotopic fractionation, and in particular the deuterium fractionation, is a powerful tool for studying the evolution of material during the process of star and planetary system formation. Observations of ortho- and para-H2D+, for example, have allowed us to derive the age of a core forming a Sun-like star (Brünken et al. 2014). Furthermore, observing and modelling water and its deuterated isotopologues has established that a substantial fraction of the water in the Solar System is inherited from the pre-stellar core where the Sun formed (Cleeves et al. 2014; van Dishoeck et al. 2021). The case of water has highlighted how powerful it is to use deuteration as a probe of inheritance, and it is important to note that the conclusive evidence was found in the high abundances of the doubly deuterated water. Molecules with the possibility of multiple deuteration provide in fact crucial constraints not only to the deuteration processes involved, but also to the formation of the main species. This is essential, particularly in the case of molecules such as H2CO and H2CS, which are formed with an interplay of gas-phase and grain-surface chemistry.
Similarly to H2CO, H2CS is formed both in the gas phase (mainly from atomic S) and on the surface of dust grains by the addition of hydrogen atoms on CS. H2CS has been observed towards cold molecular clouds, protostellar cores, hot cores, circumstellar envelopes, and protoplanetary discs (Sinclair et al. 1973; Vastel et al. 2018; Agúndez et al. 2008; Le Gal et al. 2019; Drozdovskaya et al. 2018). Its deuterated isotopologues have also been observed towards starless and prostostellar cores (Marcelino et al. 2005; Drozdovskaya et al. 2018).
The low-mass pre-stellar core L1544, located in the Taurus molecular cloud at 170 pc (Galli et al. 2019), is a well-studied object. It is centrally concentrated (Ward-Thompson et al. 1999) and shows signs of contraction motion. Its central density is between ~ 106 and ~ 107 cm−3 and the central temperature is ~6 K (Keto & Caselli 2010; Crapsi et al. 2007). The core exhibits a high degree of CO freeze-out and a high level of deuteration towards its centre (Crapsi et al. 2005). It is chemically rich, showing spatial inhomogeneities in the distribution of molecular emission (Spezzano et al. 2017; Redaelli et al. 2019; Chacón-Tanarro et al. 2019). The sulfur chemistry towards the dust peak of the pre-stellar core L1544 was presented in Vastel et al. (2018), showing that the sulfur-bearing species in L1544 are emitting from an external layer (~104 AU from the core centre). Furthermore, only a fraction of a percent of the cosmic sulfur fractional abundance with respect to total H nuclei (1.5 × 10⁻⁵) is needed to reproduce the observations, confirming that sulfur is highly depleted in the dense interstellar medium (Laas & Caselli 2019).
In this paper, we present the first deuteration maps of H2CS towards the pre-stellar core L1544. In Sect. 2, we present the observations. The analysis is described in Sect. 3, and the chemical modelling is presented in Sect. 4. We discuss the results in Sect. 5 and summarise our conclusions in Sect. 6.
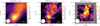 |
Fig. 1 Integrated intensity maps of the 30,з–20,2 transitions of H2CS, HDCS, and D2CS towards the inner 2.5′ × 2.5′ of L1544. All maps have been smoothed to 30.5″, and the beam is shown at the bottom left of each map. The solid white contours are the 30%, 60%, and 90% of the peak intensity of the N(H2) map of L1544 computed from Herschel/SPIRE data (Spezzano et al. 2016). The dashed white contours indicate the 3σ integrated emission with steps of 3σ ( |


2 Observations
The emission maps of H2CS, HDCS, and D2CS towards L1544 were obtained using the IRAM 30 m telescope (Pico Veleta, Spain) in two different observing runs in 2013 and 2015, and these are shown in Fig. 1. The size of the D2CS map shown in Fig. 1 is smaller with respect to the size of the H2CS and HDCS maps because, given the weakness of the D2CS line, in 2015 a deeper integration for this line was performed towards the inner region of L1544. The spectra of the three isotopologues extracted towards the dust peak of L1544 are shown in Fig. A.1. We performed a 2.5′ × 2.5′ on-the-fly (OTF) map centred on the source dust emission peak (α2000 = 05h04m17s.21, δ2000 = +25° 10′42″.8). We used position switching with the reference position set at (−180″, 180″) offset with respect to the map centre. The observed transitions are summarised in Table 1. The EMIR E090 receiver was used with the Fourier transform spectrometer backend (FTS) with a spectral resolution of 50 kHz. The mapping was carried out in good weather conditions (τ225GHz ~ 0.3) and at a typical system temperature of Tsys ~ 90–150 K. The data processing was done using the GILDAS software (Pety 2005). The emission maps of H2CS and HDCS have been smoothed to the beam size of D2CS (30.5″). All maps have been gridded to a pixel size of 6″ with the CLASS software in the GILDAS package, which corresponds to 1/5 of the beam size. The integrated intensity maps shown in Fig. 1 have been computed in the 6.9–7.6 km s−1 velocity range. To compute the column densities, we used the forward efficiency Feff = 0.95 and main beam efficiency Beff = 0.76 to convert the  temperature scale into the TMB temperature scale. The velocity rest frame used in this work is the local standard of rest (lsr).
Spectroscopic parameters of the observed lines.
3 Analysis
The column density maps of each H2CS isotopologue (shown in Fig. A.2) have been computed using the formula reported in Mangum & Shirley (2015), assuming that the source fills the beam and the excitation temperature Tex is constant:
 (2)
(2)
where  is the source function in Kelvin, k is the Boltzmann constant, v is the frequency of the line, h is the Planck constant, c is the speed of light, Aul is the Einstein coefficient of the transition, W is the integrated intensity, gu is the degeneracy of the upper state, Eu is the energy of the upper state, Qrot is the partition function of the molecule at the given temperature Tex, and Tbg is the background (2.7 K) temperature. Following the results of the Markov chain Monte Carlo (MCMC) analysis reported in Vastel et al. (2018), we assumed Tex = 12.3, 6.8, and 9.3 K for H2CS, HDCS, and D2CS, respectively. While computing the column density across the core, the excitation temperature was kept constant for each isotopologue. The error introduced by using a constant excitation temperature to calculate the column density map across a pre-stellar core was found negligible in a previous study of L1544 (see appendix of Redaelli et al. 2019).
The deuteration maps are shown in Fig. 2. Towards the dust peak, N(HDCS)/N(H2CS) ~ 12 ± 2%, N(D2CS)/N(H2CS) ~ 12 ± 2%, and N(D2CS)/N(HDCS) ~ 100 ± 16%, consistently with the values reported in Vastel et al. (2018), where the column densities were derived assuming constant excitation temperature with the MCMC as well as with the rotational diagram method and using three rotational transitions for each of the H2CS isotopologues. The column density ratios involving D2CS were detected with a signal-to-noise ratio larger than 3 only towards a 30″ × 60″ region around the centre of L1544, and they show an increase of deuteration towards the dust peak. However, given the small coverage, it is difficult to draw conclusions on spatial variations of the efficacy of the second deuteration of H2CS. The N(HDCS)/N(H2CS) map shows that the deuteration peak for H2CS in L1544 is located towards the north-east at a distance of about 10000 AU (~60″) from the dust peak, where N(HDCS)/N(H2CS) ~ 27 ± 7%. To test the effects of using different excitation temperatures for the three isotopologues on our results, we computed the column density maps and deuteration maps assuming Tex = 9.3 K for all isotopologues (see Fig. A.3). The difference in the corresponding column densities is rather small, with N(H2CS) showing the largest variation (~20%). However, the deuteration maps do not show significant changes, and most importantly the single deuteration peak is still located in the same position as in the map shown in Fig. 2.
 |
Fig. 2 Deuteration maps of H2CS towards L1544. The column density ratio has been computed only in pixels where both molecules have been observed at least at a 3σ level. The solid white contours are the 30%, 60%, and 90% of the peak intensity of the N(H2) map of L1544 computed from Herschel/SPIRE data. The dotted white contours indicate the 3σ integrated emission contour for HDCS in the left panel, and of D2CS in the central and right panel. |
4 Comparison with chemical models
To investigate whether the observed trends in the deuteration of H2CS and H2CO can be understood in the context of the current knowledge of deuterium chemistry in the ISM, we ran a set of gas-grain chemical simulations attempting to reproduce the column densities and column density ratios observed towards L1544. For this, we used our chemical model that includes an extensive description of deuterium and spin-state chemistry; the main features of the chemical code and the chemical networks are described in detail in Sipilä et al. (2015a,b, 2019) and are omitted here for brevity. We assumed monodisperse spherical grains with a radius of 0.1 μm and use the initial abundances displayed in Table 2. The simulation results discussed below correspond to a two-phase chemical model, that is one where the ice on the grain-surface layer is treated as a single active layer.
For the present work, we ran a set of single-point chemical simulations to check the effect of the volume density on the deuterium fractionations. In these simulations, the temperature and visual extinction are set to ‘standard’ values for starless cores: Tgas = Tdust = 10 K, AV = 10 mag. We also ran a core simulation using the physical model for L1544 presented by Keto & Caselli (2010); the physical model was divided into concentric shells, and chemical simulations were run in each shell to produce time-dependent, radially varying abundance profiles. Essentially the same modelling procedure was recently used in Redaelli et al. (2021) to investigate the r dependence of the cosmic-ray ionisation rate in L1544. It was found in that paper that observations of the line profiles of several species are well matched by the ‘low’ model of Padovani et al. (2018); we adopted that model here as well. We also employed the new description for cosmic ray induced desorption presented in Sipilä et al. (2021).
Figure 3 shows the simulated gas-phase and grain-surface deuterium fraction of H2CO and H2CS in the single-point chemical models. The values of the various ratios depend on the volume density, but it is evident that in all cases the simulated doubly-to-singly deuterated ratios are clearly below unity and lie between 0.05 and 0.4. In particular, the ratios are well below unity also on the grain surfaces, which shows that the low gasphase ratios (as compared to the observations) are not due to inadequate desorption.
The results of the L1544 simulation are shown in Fig. 4, which displays the simulated column density ratios toward the centre of the model core, i.e., towards the dust peak in L1544. The column densities were convolved to the appropriate beam sizes. Comparing the simulated ratios to the observations tabulated in Table 3 shows that the model reproduces the HDCX/H2CX ratios well (X = O or S), while the amount of double deuteration is again underestimated by the model by an order of magnitude. We note that in the core model, the D2CO/HDCO ratio is enhanced with respect to the HDCO/H2CO ratio when compared to the results of the single-point simulations (Fig. 3). In the core model, the temperature ranges from ~6 K in the centre to ~20 K in the outer core. The efficiency of deuterium chemistry is sensitive to the temperature, and hence the spatial variations in temperature affect deuteration across the core. The ratios shown in Fig. 4 are a result of a line-of-sight integration of the column densities, which include these spatial variations. For this reason, the results of the core model cannot be compared one-to-one to the single point models, which adopt a constant temperature of 10 K. The deuterium fractions c-C3H2 are slightly underestimated by the model, but lie within a factor of about two of the observed values. Again, in this case, the model predicts an enhancement of the double-to-single deuteration ratio over the singly-deuterated-to-normal ratio1.
The simulation results are naturally sensitive to the adopted model parameters. We tested several variations of our models in an effort to boost the doubly-to-singly deuterated ratios: (1) gas-phase chemistry only; (2) multi-layer ice chemistry; (3) modifications to the branching ratios of surface reactions to promote the formation of doubly deuterated molecules; (4) decreased activation energies for the formation of D-bearing molecules on the grain surface; (5) switching from complete scrambling to proton hop as the main deuteration mechanism (Sipilä et al. 2019). Some of these schemes are able to boost the doubly-to-singly deuterated ratios of H2CO and H2Cs to a level of ~0.5, but always at the associated cost of increasing the HDCX/H2CX ratios as well. It remains unknown why the doubly-to-singly deuterated ratios in L1544 are boosted for H2CO and H2Cs, but not for c-C3H2 (see Table 2). It is, however, important to note that the main difference between c-C3H2 and H2CO or H2CS is that towards cold cores, c-C3H2 is formed and deuterated only by gas-phase reactions (Spezzano et al. 2013), while H2CO and H2CS need a combination of reactions in the gas phase and on the surface of dust grains.
Initial abundances (with respect to nH ≈ 2 n(H2)) used in the chemical modelling.
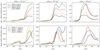 |
Fig. 3 Simulated deuterium fraction ratios of H2CO and H2CS as functions of time in the single point model (0D). The top row displays gas-phase abundance ratios, while the grain-surface ratios are displayed on the bottom row. From left to right, the columns correspond to a volume density of n(H2) = 104 cm−3, n(H2) = 105 cm−3, or n(H2) = 106 cm−3, respectively. The asterisks denote grain-surface molecules. |
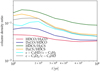 |
Fig. 4 Simulated column density deuterium fractions of H2CO, H2CS, and c-C3H2 as functions of time in the L1544 model (1D). |
5 Discussion
5.1 Deuteration maps
The N(HDCS)/N(H2CS) deuteration map shown in the left panel of Fig. 2 presents a peak towards the north-east of L1544. The column density ratio error map is shown in Fig. A.4. H2CS is the first molecule whose deuteration peak is not coincident with the dust peak or in its vicinity within 5000 AU. The deuteration peak of H2CS towards the north-east seems to suggest that its deuteration is more efficient in the outer layers of the core. The normal and deuterated isotopologues of H2CS do not necessarily trace the same regions within pre-stellar cores, and we expect H2CS to also be present in the external layers of L1544, while HDCS and D2CS will only be efficiently produced in the inner 6000 AU of the core, which is the so-called deuteration zone (Caselli & Ceccarelli 2012). When moving from the dust peak towards the N(HDCS)/N(H2CS) peak in the north-east, the column density of H2CS shows a steeper decrease compared to the HDCS column density. While the H2CS column density drops by 50%, the HDCS column density drops by only 20%, suggesting that the deuteration peak towards the north-east of L1544 might be a consequence of the steeper drop of the H2CS in the outer layers of L1544, and not the result of a local enhancement in the deuteration of the molecule. The chemistry in the outer layers of L1544, where we only expect H2CS and not its deuterated isotopologues to be present, is more affected by the uneven illumination onto the core than the inner layers, and in turn the distribution of H2CS is not expected to be even either, but to peak towards the south (the c-C3H2 peak) and decrease towards the north-east (the CH3OH peak) (Spezzano et al. 2016, 2017). With the column density being a measure of the column of molecules along the line of sight, it takes into account the molecules present in the outer as well as in the inner layers of the core, and the column density ratios that we measure at different offsets are affected by the inhomogeneous distribution of the molecule in the different layers of the core. The illumination does not have an effect on the D/H ratio, it only dilutes the N(HDCS)/N(H2CS) ratio towards the south of L1544, where H2CS is more efficiently formed in the outer layers of the core. This is due to the fact that more efficient formation of H2CS is expected in regions where C atoms are not mainly locked in CO (as in the southern region of L1544, which is rich in carbon-chain molecules; Spezzano et al. 2017). The same behaviour as H2CS is also seen in CH3OH and H2CO (Chacón-Tanarro et al. 2019), although H2CS shows the farthest distance of the deuteration peak from the dust peak (~ 10 000 AU). The deuteration peak for methanol and formaldehyde is shifted by a few thousand AU towards the south-west and north-west of the dust peak, respectively, in agreement with the direction of steepest decrease of the column density of the main isotopologue. The situation is slightly different for N2H+ and HCO+, whose deuteration maps were studied in Redaelli et al. (2019). N2H+ forms directly from molecular nitrogen, N2, a latetype molecule that is not very abundant in the outer layers of L1544, and as a consequence N2H+ is more abundant towards the centre of the core (Caselli et al. 1999; Hily-Blant et al. 2010). N2H+ shows signs of depletion only at the very centre of starless cores (Bergin et al. 2002; Caselli et al. 2002; Redaelli et al. 2019), where N2 also starts to freeze out. Both N2H+ ad N2D+ are centrally concentrated in starless cores, and, consequently, the N(N2D+)/N(N2H+) map also peaks at the centre of L1544. HCO+ and DCO+, instead, are also quite abundant in the cloud surrounding the core, and their column density maps and deuteration map will reflect the overall gas distribution. In the case of L1544, N(HCO+), N(DCO+), and their ratio map peak towards the north-west of the dust peak (see the bottom panel of Figs. 8 and 10 in Redaelli et al. 2019).
It is important to note that the N(HDCS)/N(H2CS) ratio is 0.12 ± 0.02 at the dust peak and 0.27 ± 0.07 at the deuteration peak towards the north-east, so the difference in the deuteration at the two peaks is only at 2σ level. Furthermore, the position of the N(HDCS)/N(H2CS) peak is at the border of the 3σ contour of the HDCS column density map. Maps with higher sensitivity and angular resolution are needed in order to make quantitative conclusions on the possible local increase of deuteration fraction of H2CS towards the north–east.
5.2 Deuteration towards the dust peak
With the D2CS map not being much extended across the core, it is not possible to draw conclusions about the N(D2CS)/N(H2CS) and N(D2CS)/N(HDCS) deuteration maps. However, we can compare the single and double deuteration of H2CS with cyclopropenylidene, c-C3H2, and H2CO, which were previously observed in their singly and doubly deuterated isotopologues towards the dust peak of L1544 (Spezzano et al. 2013; Chacón-Tanarro et al. 2019). The column densities and deuteration ratios are summarised in Table 3. Three main conclusions can be drawn from the numbers reported in Table 3: (i) in the case of c-C3H2, N(c-C3HD)/N(c-C3H2)~N(c-C3D2)/N(c-C3HD)~10%; (ii) H2CS is more efficiently deuterated than H2CO; (iii) the column densities of the singly and doubly deuterated isotopologues of H2CS and H2CO are the same within error bars, leading to a D2CX/HDCX ~ 100% (with X = S or O). As discussed in Sect. 4, the deuteration of c-C3H2 is reproduced fairly well (factor of ~2) by the chemical models with gas-phase reactions. c-C3HD is mainly formed by the reaction of c-C3H2 with H2D+ or other deuterated isotopologues of  , followed by dissociative recombination with electrons. c-C3D2 is formed in the same fashion from the reaction of c-C3HD with H2D+. The formation of H2CO and H2CS instead occur both in the gas phase and on the surface of dust grains (by hydrogenation of CO and CS). Despite the similar formation pathways, H2CS is more efficiently deuterated than H2CO as a consequence of the longer time spent on the surface because of its higher binding energy. Another noticeable difference among the deuteration of these three molecules is that the column densities of the singly and doubly deuterated H2CO and H2CS are, within error bars, the same, while the column density of the doubly deuterated c-C3H2 is 10% of the column density of the singly deuterated one. A larger D2CO/HDCO ratio (12%) with respect to the HDCO/H2CO ratio (6%) has been observed towards the protostellar core IRAS 16293-2422 B with ALMA observations (Persson et al. 2018). The results of Persson et al. (2018) can be reproduced with the gas-grain chemical model described in Taquet et al. (2014), where the physical and chemical evolution of a collapsing core is followed until the end of the deeply-embedded protostellar stage (Class 0). The time step that best reproduces the observations of Persson et al. (2018) is 1 × 10⁵ yr, at the beginning of the Class 0 stage, suggesting that the deuterium fractionation observed for H2CO in IRAS 16293-2422 B is mostly inherited from the pre-stellar core phase.
It is interesting to note that towards the protostellar core IRAS 16293-2422 B, as well as towards the pre-stellar core L1544, the HDCS/H2CS ratio is larger than the HDCO/H2CO ratio, suggesting an inheritance of H2CO, H2CS and their deuterated isotopologues from the pre-stellar to protostellar phase. We were, however, unable to reproduce the D2CX/HDCX ratios (with X = S or O) observed towards the pre-stellar core L1544, despite using the same reaction schemes used in Taquet et al. (2014) that include the abstraction and substitution reactions studied in the laboratory by Hidaka et al. (2009). The deuteration efficiency is affected when the chemical model is coupled with a hydrodynamical description of core collapse instead of using a static physical model, as was done here; however, even in such a case, a D2CX/HDCX= 100% ratio cannot be reached (see Fig. 12 in Sipilä & Caselli 2018). The deuteration on the surface is boosted significantly when using a three-phase model with respect to the two-phase model, but it still fails to reproduce the D2CX/HDCX and HDCX/H2CX ratios observed for H2CO and H2CS towards the centre of L1544. Our chemical models can reproduce the HDCX/H2CX fairly well for both H2CO and H2CS, suggesting that the reaction network for the formation of the doubly deuterated H2CS and H2CO are not complete yet. Additionally, the exothermicity of the formation of D2CX could be larger than for HDCX, leading to a more efficient reactive desorption for the doubly deuterated isotopologues. Different reactive desorption rates for the different isotopologues are not implemented in our chemical models, where all molecules desorb with a constant efficiency from the grains (1%). However, as pointed out in Sect. 4, a higher desorption rate for D2CO and D2CS alone will not be able to reproduce the observations. Marcelino et al. (2005) observed H2CS, HDCS, and D2CS towards Barnard 1 and found N(HDCS)/N(H2CS) ~ N(D2CS)/N(HDCS) ~ 0.3. The authors used steady state gas-phase chemical models and were able to reproduce the observed column density ratios. However, at the time, many surface processes were still poorly known and were not included. Efficient H–D substitution reactions on the surfaces may play an important role, and more laboratory work is needed to quantify their rates.
Column density of the normal and singly and doubly deuterated isotopologues of c-C3H2, H2CO, and H2CS, and their deuteration ratios towards the dust peak of L1544.
6 Conclusions
We carried out a comprehensive observational study of the deuteration of H2CS towards the pre-stellar core L1544, and compared its deuteration with other molecules observed towards the same source. We find that the N(HDCS)/N(H2CS) deuteration map presents a peak towards the north-east of L1544. Given that the column density of the main species towards the north-east of the core drops faster with respect to the deuterated isotopologue, we suggest that the deuteration peak of H2CS towards the north-east could be a consequence of the steeper drop of the H2CS in the outer layers of L1544. However, deeper integrations and observations at higher angular resolution are needed to draw conclusions on the H2CS deuteration peak towards the north-east of L1544. The present results imply that the large deuteration of H2CO and H2CS observed in protostellar cores as well as in comets could be inherited from the pre-stellar phase, as suggested by previous works. We compared the single and double deuteration of c-C3H2, H2CS and H2CO and found that while for c-C3H2 both deuteration ratios are ~ 10%, for H2CS and H2CO the second deuteration is more efficient than the first one, leading to a similar column densities for the singly and doubly deuterated isotopologues. We used state-of-the-art chemical models to reproduce the observed column density ratios and found that the deuteration of c-C3H2 can be very well reproduced both for the single as well as for the double deuteration, but this is not the case for H2CO and H2CS. Our models can reproduce the column densities of H2CO, H2CS, HDCO, and HDCS well, but they fail to reproduce the observed large D2CO and D2CS column densities, suggesting that the reaction network for the formation of the doubly deuterated H2CS and H2CO is not complete yet. More laboratory work should be dedicated to studying H–D substitution reactions on the surface of dust grains. Also, a more efficient reactive desorption for the doubly deuterated isotopologues with respect to the singly deuterated and main isotopologues might play a role.
Acknowledgments
S.S. thanks the Max Planck Society for the Independent Max Planck Research Group funding. A.F. and G.E. thank the Spanish MICINN for funding support from PID2019-106235GB-I00.
Appendix A Spectra and column density maps
The spectra of the 30,3–20,2 transition of H2CS, HDCS, and D2CS extracted towards the dust peak of L1544, i.e. around the centre of the maps shown in Figure 1, are shown in Figure A.1. The column density maps of H2CS, HDCS, and D2CS computed assuming Tex = 12.3,6.8, and 9.3 К for H2CS, HDCS, and D2CS, respectively, are shown in Figure A.2.
The column density maps computed assuming Tex = 9.3 K for all isotopologues, as well as the corresponding deuteration maps, are shown in Figure A.3. Figure A.3 shows that our main results and conclusions hold, even when assuming the same Tex for all isotopologues; in fact, the N(HDCS)/N(H2CS) peaks towards the north-east of L1544, and the N(D2CS)/N(HDCS) is ~ 100%. The error maps for the column density ratios in Figure 2 are shown in Figure A.4.
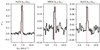 |
Fig. A.1 Spectra of the 30,3–20,2 transition of H2CS, HDCS, and D2CS extracted towards the dust peak of L1544. The vertical dashed red line shows the vLSR of the source: 7.2 km/s. |
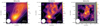 |
Fig. A.2 Column density maps of H2CS, HDCS, and D2CS towards L1544. The column density was computed assuming a constant Tex = 12.3, 6.8, and 9.3 K for H2CS, HDCS, and D2CS, respectively. The solid white contours are 30%, 60%, and 90% of the peak intensity of the N(H2) map of L1544 computed from Herschel/SPIRE data. The dotted white contours indicate the 3σ integrated emission contour with steps of 3σ ( |


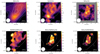 |
Fig. A.3 Column density and deuteration maps calculated assuming a constant Tex = 9.3 K for all species. Top panels: Column density maps of H2CS, HDCS, and D2CS towards L1544. The column density was computed assuming a constant Tex = 9.3 K for all species. The solid white contours are 30%, 60%, and 90% of the peak intensity of the N(H2) map of L1544 computed from Herschel/SPIRE data. The dotted white contours indicate the 3σ integrated emission contour with steps of 3σ ( |


 |
Fig. A.4 Column density ratio error maps. The solid white contours are the 30%, 60%, and 90% of the peak intensity of the N(H2) map of L1544 computed from Herschel/SPIRE data (Spezzano et al. 2016). The dashed white contours indicate the 3σ integrated emission with steps of 3σ ( |


References
- Agúndez, M., Fonfría, J. P., Cernicharo, J., et al. 2008, A&A, 479, 493 [NASA ADS] [CrossRef] [EDP Sciences] [Google Scholar]
- Bergin, E. A., Alves, J., Huard, T., et al. 2002, ApJ, 570, L101 [NASA ADS] [CrossRef] [Google Scholar]
- Bizzocchi, L., Caselli, P., Spezzano, S., et al. 2014, A&A, 569, A27 [NASA ADS] [CrossRef] [EDP Sciences] [Google Scholar]
- Brünken, S., Sipilä, O., Chambers, E. T., et al. 2014, Nature, 516, 219 [Google Scholar]
- Caselli, P., & Ceccarelli, C. 2012, A&ARv, 20, 56 [Google Scholar]
- Caselli, P., Walmsley, C. M., Tafalla, M., et al. 1999, ApJ, 523, L165 [NASA ADS] [CrossRef] [Google Scholar]
- Caselli, P., Walmsley, C. M., Zucconi, A., et al. 2002, ApJ, 565, 344 [Google Scholar]
- Ceccarelli, C., Caselli, P., Bockelée-Morvan, D., et al. 2014, Protostars and Planets VI, 859 [Google Scholar]
- Chacón-Tanarro, A., Caselli, P., Bizzocchi, L., et al. 2019, A&A, 622, A141 [Google Scholar]
- Cleeves, L. I., Bergin, E. A., Alexander, C. M. O. D., et al. 2014, Science, 345, 1590 [NASA ADS] [CrossRef] [Google Scholar]
- Crapsi, A., Caselli, P., Walmsley, C. M., et al. 2005, ApJ, 619, 379 [Google Scholar]
- Crapsi, A., Caselli, P., Walmsley, M. C., et al. 2007, A&A, 470, 221 [NASA ADS] [CrossRef] [EDP Sciences] [Google Scholar]
- Drozdovskaya, M. N., van Dishoeck, E. F., Jørgensen, J. K., et al. 2018, MNRAS, 476, 4949 [Google Scholar]
- Feng, S., Codella, C., Ceccarelli, C., et al. 2020, ApJ, 896, 37 [NASA ADS] [CrossRef] [Google Scholar]
- Galli, P. A. B., Loinard, L., Bouy, H., et al. 2019, A&A, 630, A137 [NASA ADS] [CrossRef] [EDP Sciences] [Google Scholar]
- Goicoechea, J. R., Pety, J., Gerin, M., et al. 2006, A&A, 456, 565 [NASA ADS] [CrossRef] [EDP Sciences] [Google Scholar]
- Hidaka, H., Watanabe, M., Kouchi, A., et al. 2009, ApJ, 702, 291 [NASA ADS] [CrossRef] [Google Scholar]
- Hily-Blant, P., Walmsley, M., Pineau Des Forêts, G., et al. 2010, A&A, 513, A41 [NASA ADS] [CrossRef] [EDP Sciences] [Google Scholar]
- Keto, E., & Caselli, P. 2010, MNRAS, 402, 1625 [Google Scholar]
- Laas, J. C., & Caselli, P. 2019, A&A, 624, A108 [NASA ADS] [CrossRef] [EDP Sciences] [Google Scholar]
- Le Gal, R., Öberg, K. I., Loomis, R. A., et al. 2019, ApJ, 876, 72 [NASA ADS] [CrossRef] [Google Scholar]
- Linsky, J. L. 2003, Space Sci. Rev., 106, 49 [Google Scholar]
- Mangum, J. G., & Shirley, Y. L. 2015, PASP, 127, 266 [Google Scholar]
- Marcelino, N., Cernicharo, J., Roueff, E., et al. 2005, ApJ, 620, 308 [Google Scholar]
- Müller, H. S. P., Maeda, A., Thorwirth, S., et al. 2019, A&A, 621, A143 [NASA ADS] [CrossRef] [EDP Sciences] [Google Scholar]
- Neufeld, D. A., Godard, B., Gerin, M., et al. 2015, A&A, 577, A49 [NASA ADS] [CrossRef] [EDP Sciences] [Google Scholar]
- Padovani, M., Ivlev, A. V., Galli, D., & Caselli, P. 2018, A&A, 614, A111 [NASA ADS] [CrossRef] [EDP Sciences] [Google Scholar]
- Palumbo, M. E., Geballe, T. R., & Tielens, A. G. G. M. 1997, ApJ, 479, 839 [NASA ADS] [CrossRef] [Google Scholar]
- Parise, B., Ceccarelli, C., Tielens, A. G. G. M., et al. 2006, A&A, 453, 949 [NASA ADS] [CrossRef] [EDP Sciences] [Google Scholar]
- Persson, M. V., Jørgensen, J. K., Müller, H. S. P., et al. 2018, A&A, 610, A54 [NASA ADS] [CrossRef] [EDP Sciences] [Google Scholar]
- Pety, J. 2005, SF2A-2005: Semaine de l’Astrophysique Francaise, Eds. F. Casoli, T. Contini, J.M. Hameury, & L. Pagani (Les Ulis: EdP Sciences) 721 [Google Scholar]
- Redaelli, E., Bizzocchi, L., Caselli, P., et al. 2019, A&A, 629, A15 [NASA ADS] [CrossRef] [EDP Sciences] [Google Scholar]
- Redaelli, E., Sipilä, O., Padovani, M., et al. 2021, A&A, 656, A109 [NASA ADS] [CrossRef] [EDP Sciences] [Google Scholar]
- Roberts, H., Herbst, E., & Millar, T. J. 2003, ApJ, 591, L41 [CrossRef] [Google Scholar]
- Roueff, E., Lis, D. C., van der Tak, F. F. S., et al. 2005, A&A, 438, 585 [NASA ADS] [CrossRef] [EDP Sciences] [Google Scholar]
- Sinclair, M. W., Fourikis, N., Ribes, J. C., et al. 1973, Austr. J. Phys., 26, 85 [NASA ADS] [CrossRef] [Google Scholar]
- Sipilä, O., & Caselli, P. 2018, A&A, 615, A15 [Google Scholar]
- Sipilä, O., Caselli, P., & Harju, J. 2015a, A&A, 578, A55 [Google Scholar]
- Sipilä, O., Harju, J., Caselli, P., & Schlemmer, S. 2015b, A&A, 581, A122 [NASA ADS] [CrossRef] [EDP Sciences] [Google Scholar]
- Sipilä, O., Caselli, P., & Harju, J. 2019, A&A, 631, A63 [Google Scholar]
- Sipilä, O., Silsbee, K., & Caselli, P. 2021, ApJ, 922, 126 [CrossRef] [Google Scholar]
- Spezzano, S., Brünken, S., Schilke, P., et al. 2013, ApJ, 769, L19 [Google Scholar]
- Spezzano, S., Bizzocchi, L., Caselli, P., et al. 2016, A&A, 592, L11 [NASA ADS] [CrossRef] [EDP Sciences] [Google Scholar]
- Spezzano, S., Caselli, P., Bizzocchi, L., et al. 2017, A&A, 606, A82 [NASA ADS] [CrossRef] [EDP Sciences] [Google Scholar]
- Taquet, V., Charnley, S. B., & Sipilä, O. 2014, ApJ, 791, 1 [NASA ADS] [CrossRef] [Google Scholar]
- van Dishoeck, E. F., Kristensen, L. E., Mottram, J. C., et al. 2021, A&A, 648, A24 [NASA ADS] [CrossRef] [EDP Sciences] [Google Scholar]
- Vastel, C., Quénard, D., Le Gal, R., et al. 2018, MNRAS, 478, 5514 [Google Scholar]
- Ward-Thompson, D., Motte, F., & Andre, P. 1999, MNRAS, 305, 143 [Google Scholar]
- Zasowski, G., Kemper, F., Watson, D. M., et al. 2009, ApJ, 694, 459 [CrossRef] [Google Scholar]
And the opposite in the single-point models (not shown in Fig. 3).
All Tables
Initial abundances (with respect to nH ≈ 2 n(H2)) used in the chemical modelling.
Column density of the normal and singly and doubly deuterated isotopologues of c-C3H2, H2CO, and H2CS, and their deuteration ratios towards the dust peak of L1544.
All Figures
|
Fig. 1 Integrated intensity maps of the 30,з–20,2 transitions of H2CS, HDCS, and D2CS towards the inner 2.5′ × 2.5′ of L1544. All maps have been smoothed to 30.5″, and the beam is shown at the bottom left of each map. The solid white contours are the 30%, 60%, and 90% of the peak intensity of the N(H2) map of L1544 computed from Herschel/SPIRE data (Spezzano et al. 2016). The dashed white contours indicate the 3σ integrated emission with steps of 3σ ( |
| In the text | |
|
Fig. 2 Deuteration maps of H2CS towards L1544. The column density ratio has been computed only in pixels where both molecules have been observed at least at a 3σ level. The solid white contours are the 30%, 60%, and 90% of the peak intensity of the N(H2) map of L1544 computed from Herschel/SPIRE data. The dotted white contours indicate the 3σ integrated emission contour for HDCS in the left panel, and of D2CS in the central and right panel. |
| In the text | |
|
Fig. 3 Simulated deuterium fraction ratios of H2CO and H2CS as functions of time in the single point model (0D). The top row displays gas-phase abundance ratios, while the grain-surface ratios are displayed on the bottom row. From left to right, the columns correspond to a volume density of n(H2) = 104 cm−3, n(H2) = 105 cm−3, or n(H2) = 106 cm−3, respectively. The asterisks denote grain-surface molecules. |
| In the text | |
|
Fig. 4 Simulated column density deuterium fractions of H2CO, H2CS, and c-C3H2 as functions of time in the L1544 model (1D). |
| In the text | |
|
Fig. A.1 Spectra of the 30,3–20,2 transition of H2CS, HDCS, and D2CS extracted towards the dust peak of L1544. The vertical dashed red line shows the vLSR of the source: 7.2 km/s. |
| In the text | |
|
Fig. A.2 Column density maps of H2CS, HDCS, and D2CS towards L1544. The column density was computed assuming a constant Tex = 12.3, 6.8, and 9.3 K for H2CS, HDCS, and D2CS, respectively. The solid white contours are 30%, 60%, and 90% of the peak intensity of the N(H2) map of L1544 computed from Herschel/SPIRE data. The dotted white contours indicate the 3σ integrated emission contour with steps of 3σ ( |
| In the text | |
|
Fig. A.3 Column density and deuteration maps calculated assuming a constant Tex = 9.3 K for all species. Top panels: Column density maps of H2CS, HDCS, and D2CS towards L1544. The column density was computed assuming a constant Tex = 9.3 K for all species. The solid white contours are 30%, 60%, and 90% of the peak intensity of the N(H2) map of L1544 computed from Herschel/SPIRE data. The dotted white contours indicate the 3σ integrated emission contour with steps of 3σ ( |
| In the text | |
|
Fig. A.4 Column density ratio error maps. The solid white contours are the 30%, 60%, and 90% of the peak intensity of the N(H2) map of L1544 computed from Herschel/SPIRE data (Spezzano et al. 2016). The dashed white contours indicate the 3σ integrated emission with steps of 3σ ( |
| In the text | |
Current usage metrics show cumulative count of Article Views (full-text article views including HTML views, PDF and ePub downloads, according to the available data) and Abstracts Views on Vision4Press platform.
Data correspond to usage on the plateform after 2015. The current usage metrics is available 48-96 hours after online publication and is updated daily on week days.
Initial download of the metrics may take a while.