Fig. 2
Download original image
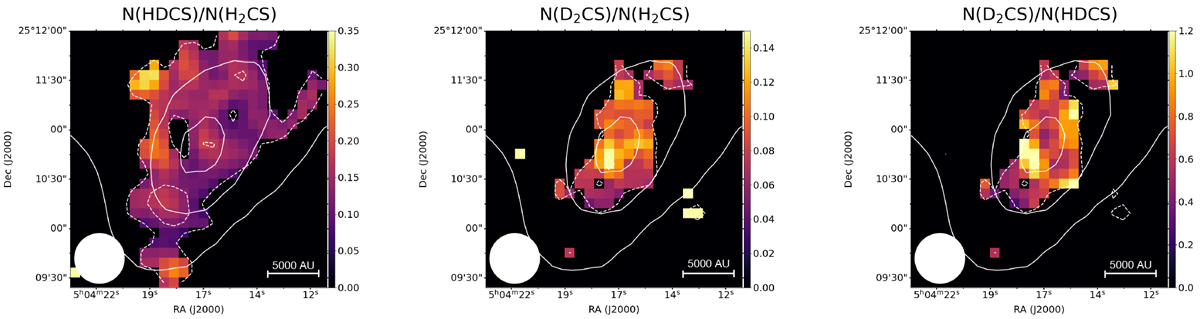
Deuteration maps of H2CS towards L1544. The column density ratio has been computed only in pixels where both molecules have been observed at least at a 3σ level. The solid white contours are the 30%, 60%, and 90% of the peak intensity of the N(H2) map of L1544 computed from Herschel/SPIRE data. The dotted white contours indicate the 3σ integrated emission contour for HDCS in the left panel, and of D2CS in the central and right panel.
Current usage metrics show cumulative count of Article Views (full-text article views including HTML views, PDF and ePub downloads, according to the available data) and Abstracts Views on Vision4Press platform.
Data correspond to usage on the plateform after 2015. The current usage metrics is available 48-96 hours after online publication and is updated daily on week days.
Initial download of the metrics may take a while.